| Pos. | |
Name | |
Today | |
3 weeks | |
6 weeks | |
26 weeks | |
1DAY | |
Ytoday | |
1YEAR | |
|| |
Pos. | |
Name | |
Today | |
3 weeks | |
6 weeks | |
26 weeks | |
1DAY | |
7DAY | |
30DAY | |
Ytoday | |
1YEAR | |
Ratio_GP | |
Ratio_NI | |
ROE | |
| 1.0 |
Communication Equipment |
100.0 |
100.0 |
100.0 |
73.0 |
-1.19 |
47.62 |
95.73 |
35.53 |
-12.18 |
4.55 |
|| |
26.0 |
Electronic Gaming & Multimedia |
82.0 |
97.0 |
63.0 |
39.0 |
0.39 |
24.85 |
30.77% |
58.61 |
-1.71 |
-19.3 |
| 2.0 |
Leisure |
99.0 |
93.0 |
92.0 |
57.0 |
-1.34 |
46.94 |
55.43 |
43.44 |
-0.7 |
1.33 |
|| |
27.0 |
Food Distribution |
82.0 |
80.0 |
54.0 |
40.0 |
-0.51 |
10.86 |
32.37% |
14.18 |
0.86 |
14.85 |
| 3.0 |
Utilities - Independent Power Producers |
98.0 |
98.0 |
97.0 |
98.0 |
-0.16 |
91.46 |
130.93 |
30.83 |
16.36 |
20.5 |
|| |
28.0 |
Travel Services |
81.0 |
51.0 |
45.0 |
86.0 |
-1.51 |
25.76 |
73.51% |
52.87 |
24.21 |
17.93 |
| 4.0 |
Healthcare Plans |
97.0 |
99.0 |
99.0 |
69.0 |
-1.52 |
28.2 |
48.31 |
47.73 |
0.29 |
-5.42 |
|| |
29.0 |
Financial Conglomerates |
80.0 |
86.0 |
91.0 |
100.0 |
-3.13 |
34.66 |
145.93% |
73.49 |
2.54 |
-19.86 |
| 5.0 |
Silver |
97.0 |
88.0 |
98.0 |
75.0 |
-1.99 |
76.25 |
90.5 |
20.47 |
10.84 |
8.45 |
|| |
30.0 |
REIT - Diversified |
80.0 |
81.0 |
87.0 |
26.0 |
-0.1 |
8.72 |
31.94% |
62.32 |
18.74 |
3.11 |
| 6.0 |
Medical Care Facilities |
96.0 |
82.0 |
89.0 |
63.0 |
-0.76 |
22.16 |
52.86 |
26.04 |
-1.32 |
38.6 |
|| |
31.0 |
Tobacco |
79.0 |
89.0 |
74.0 |
25.0 |
-0.43 |
8.68 |
27.31% |
45.54 |
8.77 |
-32.24 |
| 7.0 |
Information Technology Services |
95.0 |
92.0 |
74.0 |
27.0 |
-0.97 |
13.43 |
39.09 |
30.3 |
-3.68 |
25.11 |
|| |
32.0 |
REIT - Industrial |
78.0 |
66.0 |
78.0 |
42.0 |
0.71 |
0.51 |
33.83% |
56.5 |
25.47 |
5.6 |
| 8.0 |
Capital Markets |
95.0 |
94.0 |
86.0 |
96.0 |
-2.64 |
24.76 |
76.1 |
49.55 |
11.06 |
2.57 |
|| |
33.0 |
Diagnostics & Research |
78.0 |
82.0 |
89.0 |
81.0 |
-1.04 |
8.54 |
46.89% |
41.2 |
-13.65 |
-2.97 |
| 9.0 |
Pollution & Treatment Controls |
94.0 |
90.0 |
91.0 |
65.0 |
-0.44 |
45.74 |
59.92 |
37.88 |
8.89 |
9.09 |
|| |
34.0 |
Credit Services |
77.0 |
74.0 |
51.0 |
88.0 |
-1.37 |
36.84 |
103.66% |
71.1 |
13.02 |
14.15 |
| 10.0 |
Personal Services |
93.0 |
96.0 |
96.0 |
70.0 |
0.67 |
30.01 |
57.52 |
36.95 |
10.59 |
137.71 |
|| |
35.0 |
Metal Fabrication |
76.0 |
74.0 |
85.0 |
64.0 |
-0.99 |
29.45 |
56.03% |
23.76 |
4.15 |
7.6 |
| 11.0 |
Drug Manufacturers - Specialty & Generic |
93.0 |
70.0 |
85.0 |
74.0 |
-1.1 |
25.71 |
55.11 |
54.95 |
-9.43 |
126.04 |
|| |
36.0 |
Auto & Truck Dealerships |
76.0 |
87.0 |
60.0 |
63.0 |
-0.69 |
13.62 |
49.88% |
28.4 |
-2.31 |
-0.3 |
| 12.0 |
Biotechnology |
92.0 |
58.0 |
70.0 |
97.0 |
-1.11 |
39.19 |
94.49 |
40.54 |
164.46 |
21.68 |
|| |
37.0 |
Gambling |
75.0 |
57.0 |
76.0 |
87.0 |
-0.57 |
42.33 |
56.58% |
52.45 |
0.8 |
-13.03 |
| 13.0 |
Engineering & Construction |
91.0 |
91.0 |
88.0 |
91.0 |
-1.37 |
54.3 |
80.36 |
22.95 |
4.06 |
11.42 |
|| |
38.0 |
Aerospace & Defense |
74.0 |
68.0 |
69.0 |
60.0 |
-0.56 |
28.44 |
49.8% |
25.39 |
-3.82 |
4.49 |
| 14.0 |
Insurance Brokers |
91.0 |
93.0 |
95.0 |
59.0 |
-0.54 |
29.35 |
46.35 |
40.46 |
7.12 |
4.73 |
|| |
39.0 |
REIT - Specialty |
74.0 |
69.0 |
67.0 |
21.0 |
0.53 |
10.43 |
32.64% |
49.92 |
18.33 |
5.3 |
| 15.0 |
Thermal Coal |
90.0 |
97.0 |
37.0 |
4.0 |
-0.86 |
6.4 |
5.7 |
37.86 |
45.64 |
27.18 |
|| |
40.0 |
Financial Data & Stock Exchanges |
73.0 |
65.0 |
58.0 |
79.0 |
-0.6 |
17.22 |
53.51% |
62.33 |
23.2 |
3.16 |
| 16.0 |
REIT - Office |
89.0 |
87.0 |
82.0 |
34.0 |
-1.29 |
17.84 |
49.62 |
41.65 |
-0.73 |
-3.09 |
|| |
41.0 |
Grocery Stores |
72.0 |
77.0 |
80.0 |
21.0 |
0.45 |
20.35 |
26.19% |
29.63 |
3.57 |
12.7 |
| 17.0 |
Publishing |
89.0 |
95.0 |
93.0 |
56.0 |
0.83 |
35.32 |
42.48 |
36.84 |
-9.99 |
26.06 |
|| |
42.0 |
REIT - Retail |
72.0 |
72.0 |
83.0 |
31.0 |
0.17 |
10.48 |
34.35% |
58.01 |
22.52 |
5.98 |
| 18.0 |
REIT - Healthcare Facilities |
88.0 |
95.0 |
94.0 |
23.0 |
0.69 |
11.09 |
27.32 |
49.02 |
1.43 |
1.48 |
|| |
43.0 |
Insurance - Life |
71.0 |
56.0 |
49.0 |
47.0 |
-0.32 |
18.27 |
41.94% |
88.64 |
9.87 |
7.78 |
| 19.0 |
Gold |
87.0 |
73.0 |
97.0 |
50.0 |
-2.08 |
39.33 |
58.92 |
28.62 |
1.67 |
-0.05 |
|| |
44.0 |
Electronic Components |
70.0 |
67.0 |
70.0 |
82.0 |
-0.14 |
20.55 |
42.7% |
28.42 |
5.23 |
11.9 |
| 20.0 |
Telecom Services |
87.0 |
89.0 |
79.0 |
10.0 |
0.25 |
9.71 |
23.13 |
45.3 |
0.52 |
57.82 |
|| |
45.0 |
Consulting Services |
70.0 |
71.0 |
71.0 |
52.0 |
-0.18 |
27.25 |
37.1% |
38.78 |
10.53 |
26.4 |
| 21.0 |
Banks - Regional |
86.0 |
80.0 |
87.0 |
36.0 |
0.28 |
15.01 |
47.93 |
90.67 |
16.88 |
10.82 |
|| |
46.0 |
Insurance - Diversified |
69.0 |
70.0 |
62.0 |
46.0 |
-0.37 |
26.84 |
40.75% |
63.89 |
27.93 |
11.13 |
| 22.0 |
Furnishings, Fixtures & Appliances |
85.0 |
76.0 |
77.0 |
71.0 |
-0.62 |
36.12 |
66.54 |
38.38 |
1.09 |
18.85 |
|| |
47.0 |
Utilities - Regulated Electric |
68.0 |
72.0 |
80.0 |
16.0 |
0.56 |
17.06 |
26.23% |
35.15 |
10.92 |
11.96 |
| 23.0 |
Real Estate Services |
85.0 |
91.0 |
90.0 |
61.0 |
-1.24 |
16.19 |
56.41 |
31.12 |
-2.72 |
-1.62 |
|| |
48.0 |
Insurance - Specialty |
68.0 |
63.0 |
73.0 |
48.0 |
-0.47 |
26.56 |
44.08% |
85.98 |
25.76 |
7.42 |
| 24.0 |
Other Precious Metals & Mining |
84.0 |
76.0 |
95.0 |
84.0 |
-3.23 |
64.04 |
83.35 |
11.84 |
-6.04 |
-6.69 |
|| |
49.0 |
Insurance - Reinsurance |
67.0 |
78.0 |
78.0 |
29.0 |
-0.5 |
22.67 |
28.22% |
91.77 |
15.94 |
16.99 |
| 25.0 |
Rental & Leasing Services |
83.0 |
61.0 |
61.0 |
51.0 |
-0.75 |
27.56 |
59.13 |
40.43 |
12.54 |
10.33 |
|| |
50.0 |
Uranium |
66.0 |
19.0 |
12.0 |
17.0 |
-4.06 |
12.94 |
24.07% |
472.0 |
-36.49 |
-9.38 |
| Pos. | |
Name | |
RS Today | |
RS 3Wk | |
RS 6Wk | |
RS 26wk | |
Secotr | |
Industry | |
Pos Ind | |
EPS | |
SMR | |
A/C | |
CR | |
Ind Pos. | |
Sec Pos. | |
Close. | |
10wk | |
26wk | |
| 1.0 |
VERA |
98.46 |
98.49 |
95.59 |
99.65 |
Healthcare |
Biotechnology |
12 |
34.61 |
0.0 |
32.87 |
0.0 |
20.0 |
30.0 |
39.88 |
0.0 |
1.0 |
| 2.0 |
OSCR |
97.6 |
98.67 |
99.22 |
97.95 |
Healthcare |
Healthcare Plans |
4 |
83.17 |
92.71 |
39.16 |
24.89 |
2.0 |
41.0 |
15.93 |
0.0 |
0.0 |
| 3.0 |
INSM |
96.46 |
97.84 |
98.48 |
70.67 |
Healthcare |
Biotechnology |
12 |
11.5 |
84.98 |
59.16 |
65.87 |
36.0 |
54.0 |
71.94 |
0.0 |
1.0 |
| 4.0 |
INOD |
96.12 |
90.21 |
94.54 |
21.72 |
Technology |
Information Technology Services |
7 |
46.95 |
95.92 |
30.22 |
29.56 |
2.0 |
18.0 |
18.96 |
1.0 |
1.0 |
| 5.0 |
CLS |
94.86 |
91.87 |
94.88 |
99.19 |
Technology |
Electronic Components |
44 |
99.22 |
96.63 |
63.95 |
67.8 |
1.0 |
20.0 |
57.47 |
1.0 |
1.0 |
| 6.0 |
DNTH |
93.45 |
95.38 |
95.92 |
100.0 |
Healthcare |
Biotechnology |
12 |
74.85 |
38.94 |
54.98 |
41.83 |
59.0 |
82.0 |
26.94 |
0.0 |
1.0 |
| 7.0 |
INBK |
93.01 |
89.56 |
93.55 |
95.49 |
Financial |
Banks - Regional |
21 |
0.0 |
0.0 |
13.25 |
0.0 |
6.0 |
24.0 |
36.52 |
1.0 |
1.0 |
| 8.0 |
GDDY |
92.74 |
93.75 |
95.15 |
89.04 |
Technology |
Software - Infrastructure |
60 |
99.87 |
38.24 |
66.67 |
87.82 |
10.0 |
37.0 |
161.88 |
1.0 |
1.0 |
| 9.0 |
MPWR |
92.4 |
91.84 |
94.29 |
80.57 |
Technology |
Semiconductors |
106 |
52.95 |
24.35 |
27.41 |
99.2 |
6.0 |
41.0 |
883.64 |
0.0 |
1.0 |
| 10.0 |
AORT |
91.75 |
85.25 |
89.85 |
82.65 |
Healthcare |
Medical Devices |
69 |
41.97 |
45.1 |
62.56 |
41.87 |
7.0 |
95.0 |
26.86 |
1.0 |
1.0 |
| 11.0 |
BURL |
91.63 |
94.18 |
93.52 |
28.36 |
Consumer Cyclical |
Apparel Retail |
84 |
96.47 |
76.77 |
60.92 |
94.39 |
4.0 |
26.0 |
255.66 |
0.0 |
1.0 |
| 12.0 |
AGIO |
91.57 |
85.87 |
91.02 |
77.71 |
Healthcare |
Biotechnology |
12 |
10.45 |
22.36 |
16.88 |
48.02 |
66.0 |
96.0 |
44.33 |
0.0 |
1.0 |
| 13.0 |
WING |
91.26 |
96.21 |
96.91 |
92.73 |
Consumer Cyclical |
Restaurants |
102 |
96.41 |
85.43 |
8.02 |
96.47 |
4.0 |
28.0 |
366.6 |
0.0 |
0.0 |
| 14.0 |
LGND |
91.05 |
88.11 |
89.36 |
27.87 |
Healthcare |
Biotechnology |
12 |
76.12 |
66.66 |
98.28 |
81.77 |
67.0 |
98.0 |
106.88 |
1.0 |
1.0 |
| 15.0 |
NVMI |
90.03 |
89.38 |
92.72 |
93.1 |
Technology |
Semiconductor Equipment and Materials |
134 |
86.66 |
57.52 |
20.83 |
89.48 |
1.0 |
54.0 |
182.88 |
0.0 |
0.0 |
| 16.0 |
LOVE |
89.54 |
75.25 |
59.82 |
19.08 |
Consumer Cyclical |
Furnishings, Fixtures and Appliances |
22 |
11.75 |
22.26 |
92.95 |
42.66 |
4.0 |
31.0 |
28.65 |
1.0 |
1.0 |
| 17.0 |
DKS |
89.29 |
92.82 |
93.61 |
79.45 |
Consumer Cyclical |
Specialty Retail |
51 |
0.0 |
0.0 |
10.68 |
0.0 |
2.0 |
32.0 |
205.69 |
0.0 |
0.0 |
| 18.0 |
GHM |
88.65 |
87.22 |
93.77 |
96.15 |
Industrials |
Specialty Industrial Machinery |
65 |
92.76 |
94.64 |
66.67 |
51.38 |
6.0 |
56.0 |
29.7 |
0.0 |
1.0 |
| 19.0 |
MHK |
88.43 |
91.75 |
87.51 |
45.25 |
Consumer Cyclical |
Furnishings, Fixtures and Appliances |
22 |
33.68 |
49.95 |
81.76 |
86.58 |
5.0 |
35.0 |
151.69 |
0.0 |
1.0 |
| 20.0 |
GKOS |
88.13 |
88.21 |
90.13 |
95.74 |
Healthcare |
Medical Devices |
69 |
5.22 |
53.44 |
14.57 |
78.9 |
10.0 |
113.0 |
129.94 |
1.0 |
1.0 |
| 21.0 |
UTI |
88.03 |
89.65 |
94.51 |
95.81 |
Consumer Defensive |
Education and Training Services |
123 |
98.2 |
79.65 |
16.88 |
30.11 |
1.0 |
14.0 |
16.09 |
0.0 |
1.0 |
| 22.0 |
ULH |
87.76 |
88.7 |
85.44 |
71.44 |
Industrials |
Trucking |
94 |
0.0 |
0.0 |
29.01 |
0.0 |
1.0 |
58.0 |
42.36 |
1.0 |
1.0 |
| 23.0 |
SMC |
87.63 |
91.93 |
98.14 |
92.42 |
Energy |
Oil and Gas Midstream |
93 |
19.48 |
0.0 |
45.16 |
0.0 |
2.0 |
3.0 |
35.15 |
0.0 |
1.0 |
| 24.0 |
DECK |
87.2 |
91.07 |
91.76 |
89.91 |
Consumer Cyclical |
Footwear and Accessories |
82 |
89.79 |
93.51 |
30.22 |
88.03 |
3.0 |
43.0 |
150.96 |
0.0 |
0.0 |
| 25.0 |
REVG |
85.97 |
85.74 |
92.59 |
95.03 |
Industrials |
Farm and Heavy Construction Machinery |
130 |
92.45 |
86.1 |
1.99 |
44.6 |
2.0 |
64.0 |
26.96 |
0.0 |
1.0 |
| 26.0 |
BHE |
85.14 |
88.51 |
90.22 |
80.01 |
Technology |
Electronic Components |
44 |
86.51 |
52.77 |
52.43 |
59.3 |
3.0 |
79.0 |
42.95 |
1.0 |
1.0 |
| Pos. | |
Name | |
RS Today | |
RS 3Wk | |
RS 6Wk | |
RS 26wk | |
Secotr | |
Industry | |
Pos Ind | |
EPS | |
SMR | |
A/C | |
CR | |
Ind Pos. | |
Sec Pos. | |
Close. | |
10wk | |
26wk | |
| 1.0 |
RVT |
52.15 |
50.53 |
51.74 |
51.3 |
Financial |
Closed-End Fund - Equity |
73 |
0.0 |
0.0 |
86.79 |
0.0 |
33.0 |
405.0 |
15.43 |
1.0 |
1.0 |
| 2.0 |
EIG |
51.1 |
45.73 |
57.13 |
52.57 |
Financial |
Insurance - Specialty |
48 |
47.07 |
65.92 |
4.94 |
61.34 |
13.0 |
414.0 |
48.02 |
1.0 |
1.0 |
| 3.0 |
BR |
51.07 |
48.16 |
51.37 |
75.26 |
Technology |
Information Technology Services |
7 |
36.0 |
61.05 |
69.15 |
92.94 |
24.0 |
229.0 |
216.36 |
1.0 |
1.0 |
| 4.0 |
LDP |
51.04 |
59.89 |
57.75 |
51.21 |
Financial |
Closed-End Fund - Debt |
91 |
63.06 |
37.27 |
98.63 |
42.15 |
25.0 |
415.0 |
21.12 |
1.0 |
1.0 |
| 5.0 |
HPE |
50.89 |
49.95 |
31.45 |
62.13 |
Technology |
Communication Equipment |
1 |
72.44 |
43.05 |
74.11 |
39.41 |
17.0 |
230.0 |
19.3 |
1.0 |
1.0 |
| 6.0 |
WTW |
50.64 |
69.31 |
79.34 |
53.94 |
Financial |
Insurance Brokers |
14 |
66.62 |
81.48 |
75.87 |
96.26 |
6.0 |
419.0 |
291.92 |
1.0 |
1.0 |
| 7.0 |
WSBC |
50.55 |
45.7 |
60.62 |
45.62 |
Financial |
Banks - Regional |
21 |
20.13 |
51.65 |
26.35 |
44.84 |
174.0 |
420.0 |
30.76 |
1.0 |
1.0 |
| 8.0 |
NPFD |
50.24 |
57.8 |
56.73 |
49.44 |
Financial |
Closed-End Fund - Equity |
73 |
0.0 |
0.0 |
81.76 |
0.0 |
35.0 |
424.0 |
18.93 |
1.0 |
1.0 |
| 9.0 |
IRMD |
50.15 |
46.01 |
35.67 |
38.33 |
Healthcare |
Medical Devices |
69 |
93.34 |
82.03 |
52.43 |
68.29 |
29.0 |
244.0 |
50.49 |
1.0 |
1.0 |
| 10.0 |
BGH |
49.96 |
50.66 |
53.68 |
49.06 |
Financial |
Closed-End Fund - Debt |
91 |
41.91 |
87.29 |
84.64 |
34.12 |
30.0 |
427.0 |
15.3 |
1.0 |
1.0 |
| 11.0 |
FMS |
49.9 |
25.76 |
23.62 |
19.39 |
Healthcare |
Medical Care Facilities |
6 |
9.89 |
32.94 |
48.55 |
34.95 |
16.0 |
245.0 |
21.04 |
1.0 |
1.0 |
| 12.0 |
PAYX |
49.41 |
46.9 |
54.2 |
54.0 |
Technology |
Software - Application |
87 |
50.01 |
53.89 |
11.67 |
85.85 |
64.0 |
233.0 |
141.42 |
1.0 |
1.0 |
| 13.0 |
GD |
49.38 |
67.31 |
74.43 |
73.02 |
Industrials |
Aerospace and Defense |
38 |
41.63 |
50.43 |
94.17 |
96.3 |
24.0 |
216.0 |
304.39 |
1.0 |
1.0 |
| 14.0 |
L |
49.32 |
53.24 |
61.97 |
74.48 |
Financial |
Insurance - Property and Casualty |
77 |
85.27 |
73.78 |
45.59 |
77.86 |
22.0 |
432.0 |
80.94 |
1.0 |
1.0 |
| 15.0 |
WTM |
48.98 |
42.62 |
43.78 |
68.34 |
Financial |
Insurance - Property and Casualty |
77 |
49.73 |
71.7 |
48.55 |
99.79 |
23.0 |
438.0 |
1831.97 |
1.0 |
1.0 |
| 16.0 |
EVRG |
48.92 |
54.72 |
47.7 |
20.39 |
Utilities |
Utilities - Regulated Electric |
47 |
27.83 |
34.58 |
39.16 |
65.9 |
18.0 |
37.0 |
61.95 |
1.0 |
1.0 |
| 17.0 |
NODK |
48.89 |
45.24 |
60.68 |
52.85 |
Financial |
Insurance - Property and Casualty |
77 |
32.19 |
80.75 |
81.76 |
33.47 |
24.0 |
439.0 |
15.6 |
1.0 |
1.0 |
| 18.0 |
PAXS |
47.41 |
52.57 |
55.16 |
47.39 |
Financial |
Closed-End Fund - Debt |
91 |
0.0 |
0.0 |
86.79 |
0.0 |
46.0 |
468.0 |
16.28 |
1.0 |
1.0 |
| 19.0 |
BKH |
47.38 |
54.01 |
41.41 |
19.02 |
Utilities |
Utilities - Regulated Gas |
108 |
24.15 |
52.96 |
81.76 |
69.39 |
6.0 |
38.0 |
61.06 |
1.0 |
1.0 |
| 20.0 |
COR |
46.95 |
48.69 |
73.85 |
81.12 |
Healthcare |
Medical Distribution |
140 |
68.04 |
29.13 |
20.83 |
92.42 |
1.0 |
253.0 |
234.52 |
1.0 |
1.0 |
| 21.0 |
BERY |
46.27 |
46.75 |
36.44 |
36.03 |
Consumer Cyclical |
Packaging and Containers |
116 |
33.18 |
14.14 |
11.67 |
64.07 |
11.0 |
165.0 |
68.12 |
1.0 |
1.0 |
| 22.0 |
ES |
46.15 |
46.04 |
38.94 |
15.05 |
Utilities |
Utilities - Regulated Electric |
47 |
41.38 |
33.62 |
59.16 |
70.29 |
20.0 |
41.0 |
67.08 |
1.0 |
1.0 |
| 23.0 |
HOLX |
45.78 |
40.47 |
48.75 |
23.43 |
Healthcare |
Medical Instruments and Supplies |
71 |
39.83 |
41.45 |
2.73 |
71.3 |
16.0 |
257.0 |
81.34 |
1.0 |
1.0 |
| 24.0 |
NIE |
45.38 |
40.62 |
49.86 |
50.99 |
Financial |
Closed-End Fund - Equity |
73 |
68.82 |
0.0 |
70.26 |
0.0 |
47.0 |
494.0 |
23.27 |
1.0 |
1.0 |
| 25.0 |
IIIV |
45.35 |
32.44 |
32.68 |
38.14 |
Technology |
Software - Infrastructure |
60 |
25.82 |
62.78 |
39.16 |
40.49 |
56.0 |
248.0 |
22.75 |
1.0 |
1.0 |
| 26.0 |
FE |
44.68 |
57.61 |
58.92 |
34.72 |
Utilities |
Utilities - Regulated Electric |
47 |
21.65 |
45.74 |
39.16 |
57.08 |
21.0 |
43.0 |
44.27 |
1.0 |
1.0 |
| 27.0 |
FWONK |
44.55 |
36.9 |
49.49 |
34.88 |
Communication Services |
Entertainment |
83 |
73.16 |
23.53 |
2.73 |
72.13 |
15.0 |
74.0 |
79.23 |
1.0 |
1.0 |
| 28.0 |
VOYA |
44.49 |
47.36 |
43.41 |
24.02 |
Financial |
Financial Conglomerates |
29 |
87.47 |
77.09 |
81.76 |
80.01 |
2.0 |
507.0 |
81.58 |
1.0 |
1.0 |
| 29.0 |
SPXX |
44.24 |
38.44 |
51.27 |
35.5 |
Financial |
Closed-End Fund - Equity |
73 |
0.0 |
0.0 |
69.15 |
0.0 |
52.0 |
513.0 |
16.82 |
1.0 |
1.0 |
| 30.0 |
OSBC |
44.09 |
33.82 |
54.57 |
58.72 |
Financial |
Banks - Regional |
21 |
50.51 |
43.27 |
91.81 |
34.71 |
188.0 |
515.0 |
16.62 |
1.0 |
1.0 |
| 31.0 |
MPLX |
43.72 |
59.0 |
64.81 |
63.53 |
Energy |
Oil and Gas Midstream |
93 |
90.34 |
71.31 |
54.98 |
64.55 |
16.0 |
40.0 |
43.84 |
1.0 |
1.0 |
| 32.0 |
KVUE |
43.66 |
37.3 |
44.09 |
0.0 |
Consumer Defensive |
Household and Personal Products |
129 |
35.38 |
42.18 |
96.04 |
43.6 |
6.0 |
54.0 |
22.76 |
1.0 |
1.0 |
| 33.0 |
AMH |
43.57 |
38.78 |
47.27 |
49.5 |
Real Estate |
REIT - Residential |
52 |
67.67 |
35.77 |
86.79 |
60.85 |
13.0 |
101.0 |
39.04 |
1.0 |
1.0 |
| 34.0 |
GNTY |
42.65 |
38.25 |
56.95 |
65.79 |
Financial |
Banks - Regional |
21 |
16.54 |
34.71 |
98.28 |
53.21 |
193.0 |
532.0 |
34.34 |
1.0 |
1.0 |
| 35.0 |
ET |
42.37 |
50.38 |
56.61 |
67.41 |
Energy |
Oil and Gas Midstream |
93 |
73.61 |
34.0 |
81.76 |
35.16 |
17.0 |
43.0 |
16.37 |
1.0 |
1.0 |
| 36.0 |
PFIS |
42.28 |
38.13 |
33.17 |
30.57 |
Financial |
Banks - Regional |
21 |
6.74 |
44.52 |
66.67 |
60.47 |
196.0 |
537.0 |
47.2 |
1.0 |
1.0 |
| 37.0 |
IVT |
42.06 |
51.18 |
60.53 |
55.52 |
Real Estate |
REIT - Retail |
42 |
57.65 |
23.99 |
76.59 |
49.48 |
17.0 |
106.0 |
29.47 |
1.0 |
1.0 |
| 38.0 |
ED |
41.91 |
49.06 |
50.35 |
32.8 |
Utilities |
Utilities - Regulated Electric |
47 |
41.57 |
68.91 |
77.83 |
83.67 |
23.0 |
47.0 |
107.4 |
1.0 |
1.0 |
| 39.0 |
POR |
41.78 |
42.22 |
41.13 |
21.35 |
Utilities |
Utilities - Regulated Electric |
47 |
91.27 |
44.3 |
66.67 |
66.45 |
24.0 |
48.0 |
49.0 |
1.0 |
1.0 |
| 40.0 |
INCY |
41.69 |
44.47 |
34.25 |
9.99 |
Healthcare |
Biotechnology |
12 |
78.41 |
77.83 |
22.28 |
72.23 |
144.0 |
270.0 |
65.16 |
1.0 |
1.0 |
| 41.0 |
AEIS |
41.45 |
29.3 |
25.13 |
50.31 |
Industrials |
Electrical Equipment and Parts |
92 |
8.62 |
4.71 |
30.22 |
72.64 |
8.0 |
232.0 |
106.0 |
1.0 |
1.0 |
| 42.0 |
FELE |
41.23 |
42.75 |
37.34 |
58.47 |
Industrials |
Specialty Industrial Machinery |
65 |
49.45 |
42.76 |
39.16 |
79.66 |
31.0 |
233.0 |
102.02 |
1.0 |
1.0 |
| 43.0 |
GTY |
41.14 |
41.3 |
41.72 |
17.53 |
Real Estate |
REIT - Retail |
42 |
38.75 |
29.09 |
94.17 |
52.59 |
18.0 |
108.0 |
32.25 |
1.0 |
1.0 |
| 44.0 |
DGX |
40.95 |
51.67 |
63.3 |
35.59 |
Healthcare |
Diagnostics and Research |
33 |
17.56 |
37.11 |
88.16 |
87.75 |
15.0 |
275.0 |
157.11 |
1.0 |
1.0 |
| 45.0 |
WTRG |
40.86 |
44.01 |
34.93 |
21.5 |
Utilities |
Utilities - Regulated Water |
75 |
51.65 |
30.83 |
39.16 |
55.91 |
5.0 |
51.0 |
40.29 |
1.0 |
1.0 |
| 46.0 |
AVA |
40.8 |
46.16 |
42.64 |
17.34 |
Utilities |
Utilities - Diversified |
74 |
53.04 |
45.52 |
39.16 |
55.84 |
3.0 |
52.0 |
38.45 |
1.0 |
1.0 |
| 47.0 |
ALE |
40.68 |
49.49 |
49.89 |
32.71 |
Utilities |
Utilities - Diversified |
74 |
31.11 |
31.21 |
22.28 |
65.11 |
4.0 |
53.0 |
64.27 |
1.0 |
1.0 |
| 48.0 |
GSBC |
40.46 |
39.27 |
48.62 |
44.97 |
Financial |
Banks - Regional |
21 |
21.55 |
49.66 |
75.12 |
67.46 |
199.0 |
552.0 |
58.18 |
1.0 |
1.0 |
| 49.0 |
ABR |
40.43 |
36.62 |
21.73 |
51.58 |
Real Estate |
REIT - Mortgage |
114 |
0.0 |
0.0 |
90.23 |
0.0 |
11.0 |
110.0 |
15.27 |
1.0 |
1.0 |
| 50.0 |
OGE |
40.28 |
56.04 |
48.28 |
27.52 |
Utilities |
Utilities - Regulated Electric |
47 |
0.0 |
0.0 |
66.67 |
0.0 |
26.0 |
55.0 |
41.02 |
1.0 |
1.0 |
| 51.0 |
CHH |
39.94 |
34.44 |
30.24 |
29.42 |
Consumer Cyclical |
Lodging |
76 |
58.89 |
11.48 |
8.02 |
81.32 |
7.0 |
179.0 |
131.92 |
1.0 |
1.0 |
| 52.0 |
SR |
39.57 |
40.1 |
41.44 |
26.87 |
Utilities |
Utilities - Regulated Gas |
108 |
77.72 |
47.89 |
66.67 |
72.95 |
7.0 |
57.0 |
65.83 |
1.0 |
1.0 |
| 53.0 |
HSBC |
39.54 |
38.01 |
46.06 |
59.65 |
Financial |
Banks - Diversified |
79 |
83.42 |
51.36 |
27.41 |
62.06 |
15.0 |
564.0 |
44.18 |
1.0 |
1.0 |
| 54.0 |
RLI |
39.2 |
42.07 |
45.17 |
46.98 |
Financial |
Insurance - Property and Casualty |
77 |
75.81 |
52.48 |
81.76 |
91.0 |
27.0 |
567.0 |
159.71 |
1.0 |
1.0 |
| 55.0 |
SDHY |
38.86 |
44.41 |
42.52 |
39.5 |
Financial |
Closed-End Fund - Debt |
91 |
0.0 |
0.0 |
62.56 |
0.0 |
91.0 |
573.0 |
16.48 |
1.0 |
1.0 |
| 56.0 |
ARW |
38.68 |
33.51 |
29.44 |
54.96 |
Technology |
Electronics and Computer Distribution |
86 |
31.73 |
5.0 |
1.84 |
76.62 |
5.0 |
265.0 |
132.36 |
1.0 |
1.0 |
| 57.0 |
AVT |
37.82 |
36.22 |
38.32 |
64.3 |
Technology |
Electronics and Computer Distribution |
86 |
35.04 |
5.71 |
22.28 |
57.91 |
6.0 |
269.0 |
53.9 |
1.0 |
1.0 |
| 58.0 |
OGS |
37.76 |
33.67 |
27.1 |
19.86 |
Utilities |
Utilities - Regulated Gas |
108 |
17.84 |
31.82 |
72.64 |
71.92 |
8.0 |
58.0 |
73.76 |
1.0 |
1.0 |
| 59.0 |
BFC |
37.73 |
34.9 |
49.05 |
58.56 |
Financial |
Banks - Regional |
21 |
66.28 |
79.01 |
98.28 |
82.57 |
203.0 |
578.0 |
93.06 |
1.0 |
1.0 |
| 60.0 |
CII |
37.14 |
31.39 |
36.17 |
43.42 |
Financial |
Closed-End Fund - Equity |
73 |
90.31 |
74.75 |
72.64 |
42.98 |
61.0 |
583.0 |
19.7 |
1.0 |
1.0 |
| 61.0 |
NWE |
37.02 |
41.39 |
40.76 |
20.94 |
Utilities |
Utilities - Regulated Electric |
47 |
0.0 |
0.0 |
52.43 |
0.0 |
28.0 |
59.0 |
55.31 |
1.0 |
1.0 |
| 62.0 |
CPZ |
36.46 |
34.87 |
39.68 |
40.03 |
Financial |
Closed-End Fund - Equity |
73 |
0.0 |
0.0 |
88.16 |
0.0 |
63.0 |
590.0 |
15.64 |
1.0 |
1.0 |
| 63.0 |
PEBO |
34.25 |
39.08 |
52.75 |
59.62 |
Financial |
Banks - Regional |
21 |
60.06 |
65.15 |
96.04 |
54.94 |
207.0 |
604.0 |
30.95 |
1.0 |
1.0 |
| 64.0 |
ARCC |
34.22 |
36.28 |
41.75 |
54.87 |
Financial |
Asset Management |
67 |
80.97 |
88.57 |
39.16 |
43.7 |
47.0 |
605.0 |
21.5 |
1.0 |
1.0 |
| 65.0 |
AON |
32.53 |
31.76 |
37.12 |
30.66 |
Financial |
Insurance Brokers |
14 |
40.73 |
48.37 |
14.57 |
96.02 |
10.0 |
615.0 |
358.29 |
1.0 |
1.0 |
| 66.0 |
FTS |
32.28 |
42.01 |
43.23 |
24.67 |
Utilities |
Utilities - Regulated Electric |
47 |
36.74 |
29.96 |
30.22 |
56.67 |
30.0 |
62.0 |
44.9 |
1.0 |
1.0 |
| 67.0 |
XOM |
32.07 |
41.45 |
28.36 |
42.86 |
Energy |
Oil and Gas Integrated |
126 |
71.75 |
8.05 |
32.12 |
82.01 |
6.0 |
59.0 |
120.26 |
1.0 |
1.0 |
| 68.0 |
OBK |
31.98 |
32.84 |
41.9 |
46.46 |
Financial |
Banks - Regional |
21 |
32.38 |
49.75 |
39.16 |
48.3 |
212.0 |
620.0 |
32.13 |
1.0 |
1.0 |
| 69.0 |
DE |
30.93 |
33.7 |
26.95 |
45.56 |
Industrials |
Farm and Heavy Construction Machinery |
130 |
64.76 |
46.61 |
72.64 |
97.99 |
8.0 |
272.0 |
408.64 |
1.0 |
1.0 |
| 70.0 |
WABC |
29.88 |
31.79 |
48.35 |
60.21 |
Financial |
Banks - Regional |
21 |
48.19 |
41.22 |
52.43 |
64.31 |
215.0 |
635.0 |
51.72 |
1.0 |
1.0 |
| 71.0 |
IDA |
29.85 |
31.88 |
38.23 |
21.07 |
Utilities |
Utilities - Regulated Electric |
47 |
31.36 |
27.91 |
11.67 |
75.13 |
32.0 |
65.0 |
104.98 |
1.0 |
1.0 |
| 72.0 |
ATHM |
28.78 |
42.04 |
24.45 |
20.48 |
Communication Services |
Internet Content and Information |
107 |
16.08 |
48.05 |
91.18 |
49.89 |
23.0 |
89.0 |
29.12 |
1.0 |
1.0 |
| 73.0 |
NWN |
28.5 |
26.5 |
28.39 |
18.34 |
Utilities |
Utilities - Regulated Gas |
108 |
8.9 |
17.29 |
66.67 |
53.56 |
10.0 |
69.0 |
40.56 |
1.0 |
1.0 |
| 74.0 |
AWR |
28.35 |
30.8 |
30.15 |
16.2 |
Utilities |
Utilities - Regulated Water |
75 |
21.0 |
24.15 |
62.56 |
73.68 |
7.0 |
71.0 |
84.41 |
1.0 |
1.0 |
| 75.0 |
MKL |
28.13 |
32.34 |
34.22 |
47.82 |
Financial |
Insurance - Property and Casualty |
77 |
82.27 |
74.43 |
31.28 |
99.75 |
30.0 |
643.0 |
1567.56 |
1.0 |
1.0 |
| 76.0 |
FCN |
26.87 |
46.81 |
58.61 |
63.25 |
Industrials |
Consulting Services |
45 |
69.99 |
87.77 |
85.83 |
94.91 |
7.0 |
294.0 |
229.5 |
1.0 |
1.0 |
| 77.0 |
BKR |
26.29 |
37.61 |
25.34 |
57.66 |
Energy |
Oil and Gas Equipment and Services |
139 |
81.1 |
86.01 |
31.28 |
60.09 |
9.0 |
67.0 |
37.0 |
1.0 |
1.0 |
| 78.0 |
EXC |
24.72 |
32.74 |
28.8 |
23.89 |
Utilities |
Utilities - Regulated Electric |
47 |
50.13 |
56.4 |
77.83 |
61.82 |
35.0 |
74.0 |
40.74 |
1.0 |
1.0 |
| 79.0 |
VTS |
23.61 |
46.5 |
40.45 |
67.38 |
Energy |
Oil and Gas EandP |
137 |
43.92 |
17.26 |
39.16 |
40.31 |
13.0 |
76.0 |
24.86 |
1.0 |
1.0 |
| 80.0 |
TXNM |
22.97 |
25.17 |
28.12 |
13.28 |
Utilities |
Utilities - Regulated Electric |
47 |
8.22 |
0.0 |
92.51 |
0.0 |
36.0 |
76.0 |
44.61 |
1.0 |
1.0 |
| 81.0 |
SPLP |
18.35 |
18.19 |
23.77 |
24.89 |
Industrials |
Conglomerates |
95 |
90.13 |
40.42 |
85.83 |
64.86 |
11.0 |
330.0 |
41.0 |
1.0 |
1.0 |
| 82.0 |
GBLI |
16.69 |
19.23 |
28.21 |
56.14 |
Financial |
Insurance - Property and Casualty |
77 |
95.76 |
78.82 |
48.55 |
59.88 |
34.0 |
682.0 |
33.99 |
1.0 |
1.0 |
| Pos. | |
Name | |
RS Today | |
RS 3Wk | |
RS 6Wk | |
RS 26wk | |
Secotr | |
Industry | |
Pos Ind | |
EPS | |
SMR | |
A/C | |
CR | |
Ind Pos. | |
Sec Pos. | |
Close. | |
10wk | |
26wk | |
| 1.0 |
SEZL |
100.0 |
99.96 |
100.0 |
0.0 |
Financial |
Credit Services |
34 |
94.86 |
86.39 |
78.63 |
70.67 |
1.0 |
1.0 |
190.16 |
1.0 |
1.0 |
| 2.0 |
LBPH |
99.93 |
99.84 |
99.75 |
96.77 |
Healthcare |
Biotechnology |
12 |
0.0 |
0.0 |
79.01 |
0.0 |
1.0 |
2.0 |
59.54 |
1.0 |
1.0 |
| 3.0 |
LENZ |
99.9 |
99.93 |
99.93 |
99.47 |
Healthcare |
Biotechnology |
12 |
23.1 |
0.0 |
46.34 |
0.0 |
2.0 |
3.0 |
25.29 |
1.0 |
1.0 |
| 4.0 |
RNA |
99.87 |
99.9 |
99.81 |
93.69 |
Healthcare |
Biotechnology |
12 |
11.72 |
35.8 |
70.26 |
35.09 |
3.0 |
4.0 |
45.4 |
1.0 |
1.0 |
| 5.0 |
DOGZ |
99.72 |
98.43 |
98.05 |
1.58 |
Consumer Cyclical |
Leisure |
2 |
45.8 |
0.28 |
79.2 |
40.28 |
1.0 |
1.0 |
46.86 |
1.0 |
1.0 |
| 6.0 |
CVNA |
99.69 |
99.59 |
98.11 |
99.93 |
Consumer Cyclical |
Auto & Truck Dealerships |
36 |
77.54 |
76.45 |
98.94 |
83.88 |
1.0 |
2.0 |
197.33 |
1.0 |
1.0 |
| 7.0 |
EWTX |
99.5 |
99.19 |
98.3 |
92.08 |
Healthcare |
Biotechnology |
12 |
9.68 |
0.0 |
95.28 |
0.0 |
10.0 |
11.0 |
34.81 |
1.0 |
1.0 |
| 8.0 |
MSTR |
99.47 |
99.63 |
99.53 |
99.09 |
Technology |
Software - Application |
87 |
1.29 |
24.31 |
79.01 |
81.84 |
2.0 |
3.0 |
213.94 |
1.0 |
1.0 |
| 9.0 |
SPRY |
99.26 |
98.52 |
91.42 |
68.24 |
Healthcare |
Biotechnology |
12 |
26.35 |
58.29 |
47.37 |
16.14 |
13.0 |
15.0 |
16.04 |
1.0 |
1.0 |
| 10.0 |
WLFC |
99.2 |
98.95 |
98.27 |
35.31 |
Industrials |
Rental & Leasing Services |
25 |
98.51 |
97.52 |
88.83 |
86.27 |
1.0 |
2.0 |
188.05 |
1.0 |
1.0 |
| 11.0 |
CAVA |
99.1 |
99.32 |
99.35 |
0.0 |
Consumer Cyclical |
Restaurants |
102 |
0.0 |
98.71 |
81.76 |
0.0 |
1.0 |
3.0 |
136.55 |
1.0 |
1.0 |
| 12.0 |
APP |
99.07 |
98.55 |
97.44 |
99.28 |
Technology |
Software - Application |
87 |
95.14 |
99.93 |
92.95 |
84.54 |
3.0 |
4.0 |
159.39 |
1.0 |
1.0 |
| 13.0 |
PRAX |
98.89 |
97.75 |
98.64 |
98.97 |
Healthcare |
Biotechnology |
12 |
87.78 |
0.0 |
85.11 |
0.0 |
16.0 |
22.0 |
72.44 |
1.0 |
1.0 |
| 14.0 |
GGAL |
98.8 |
98.58 |
98.33 |
97.64 |
Financial |
Banks - Regional |
21 |
98.91 |
97.43 |
91.18 |
55.6 |
1.0 |
5.0 |
49.77 |
1.0 |
1.0 |
| 15.0 |
GATO |
98.73 |
98.39 |
97.19 |
90.19 |
Basic Materials |
Other Precious Metals & Mining |
24 |
93.53 |
21.88 |
92.51 |
27.73 |
1.0 |
3.0 |
19.69 |
1.0 |
1.0 |
| 16.0 |
HROW |
98.52 |
98.73 |
98.58 |
2.2 |
Healthcare |
Drug Manufacturers - Specialty & Generic |
11 |
2.53 |
69.13 |
85.83 |
54.49 |
2.0 |
29.0 |
54.22 |
1.0 |
1.0 |
| 17.0 |
TPC |
98.49 |
99.04 |
98.95 |
97.88 |
Industrials |
Engineering & Construction |
13 |
0.0 |
0.0 |
81.76 |
0.0 |
1.0 |
4.0 |
28.25 |
1.0 |
1.0 |
| 18.0 |
NGNE |
98.15 |
97.32 |
98.08 |
89.75 |
Healthcare |
Biotechnology |
12 |
0.46 |
0.0 |
75.12 |
0.0 |
22.0 |
33.0 |
48.54 |
1.0 |
1.0 |
| 19.0 |
NVDA |
97.93 |
97.35 |
98.21 |
98.57 |
Technology |
Semiconductors |
106 |
98.76 |
99.9 |
8.02 |
81.88 |
1.0 |
6.0 |
139.55 |
1.0 |
1.0 |
| 20.0 |
IESC |
97.87 |
97.69 |
96.88 |
98.47 |
Industrials |
Engineering & Construction |
13 |
94.77 |
99.0 |
56.65 |
89.59 |
2.0 |
6.0 |
210.77 |
1.0 |
1.0 |
| 21.0 |
USAP |
97.5 |
98.12 |
98.24 |
98.13 |
Basic Materials |
Steel |
125 |
91.21 |
99.61 |
19.92 |
50.2 |
1.0 |
4.0 |
43.65 |
1.0 |
1.0 |
| 22.0 |
MOD |
97.41 |
97.44 |
97.37 |
99.41 |
Consumer Cyclical |
Auto Parts |
133 |
65.97 |
56.88 |
94.17 |
80.77 |
2.0 |
8.0 |
128.27 |
1.0 |
1.0 |
| 23.0 |
VRT |
97.2 |
97.04 |
96.6 |
99.68 |
Industrials |
Electrical Equipment & Parts |
92 |
81.0 |
93.26 |
88.16 |
79.84 |
2.0 |
10.0 |
108.36 |
1.0 |
1.0 |
| 24.0 |
VHI |
97.07 |
96.98 |
95.74 |
28.24 |
Basic Materials |
Chemicals |
81 |
68.07 |
80.87 |
54.98 |
47.85 |
2.0 |
6.0 |
35.31 |
1.0 |
1.0 |
| 25.0 |
HOOD |
96.89 |
95.26 |
95.34 |
93.88 |
Financial |
Capital Markets |
8 |
86.82 |
93.16 |
94.17 |
42.56 |
2.0 |
8.0 |
26.7 |
1.0 |
1.0 |
| 26.0 |
FLXS |
96.83 |
94.61 |
96.2 |
96.39 |
Consumer Cyclical |
Furnishings, Fixtures & Appliances |
22 |
0.0 |
0.0 |
96.04 |
0.0 |
1.0 |
9.0 |
58.88 |
1.0 |
1.0 |
| 27.0 |
EAT |
96.7 |
97.41 |
96.26 |
65.08 |
Consumer Cyclical |
Restaurants |
102 |
30.34 |
24.18 |
59.16 |
70.05 |
3.0 |
10.0 |
94.31 |
1.0 |
1.0 |
| 28.0 |
CRDO |
96.49 |
88.98 |
93.37 |
96.43 |
Technology |
Semiconductors |
106 |
45.37 |
59.67 |
45.59 |
48.89 |
4.0 |
14.0 |
38.66 |
1.0 |
1.0 |
| 29.0 |
ACLX |
96.3 |
94.21 |
96.51 |
64.55 |
Healthcare |
Biotechnology |
12 |
0.0 |
0.0 |
85.11 |
0.0 |
38.0 |
57.0 |
88.19 |
1.0 |
1.0 |
| 30.0 |
QTWO |
96.15 |
96.49 |
96.33 |
96.02 |
Technology |
Software - Application |
87 |
40.33 |
70.0 |
59.16 |
70.95 |
6.0 |
17.0 |
83.01 |
1.0 |
1.0 |
| 31.0 |
SFM |
96.09 |
97.16 |
97.56 |
93.48 |
Consumer Defensive |
Grocery Stores |
41 |
0.0 |
0.0 |
54.98 |
0.0 |
1.0 |
4.0 |
118.84 |
1.0 |
1.0 |
| 32.0 |
SN |
96.0 |
96.58 |
97.59 |
0.0 |
Consumer Cyclical |
Furnishings, Fixtures & Appliances |
22 |
46.08 |
95.5 |
81.76 |
79.08 |
2.0 |
13.0 |
109.52 |
1.0 |
1.0 |
| 33.0 |
AGX |
95.97 |
94.89 |
95.03 |
85.56 |
Industrials |
Engineering & Construction |
13 |
82.74 |
57.0 |
81.76 |
80.63 |
3.0 |
15.0 |
120.52 |
1.0 |
1.0 |
| 34.0 |
FIX |
95.94 |
95.99 |
92.53 |
95.46 |
Industrials |
Engineering & Construction |
13 |
90.87 |
92.65 |
39.16 |
96.64 |
4.0 |
16.0 |
412.01 |
1.0 |
1.0 |
| 35.0 |
VRNA |
95.87 |
93.5 |
90.56 |
12.07 |
Healthcare |
Biotechnology |
12 |
21.06 |
0.0 |
66.67 |
0.0 |
42.0 |
61.0 |
34.93 |
1.0 |
1.0 |
| 36.0 |
CLBT |
95.81 |
94.92 |
96.79 |
94.44 |
Technology |
Software - Infrastructure |
60 |
53.41 |
44.17 |
86.79 |
29.52 |
4.0 |
19.0 |
17.9 |
1.0 |
1.0 |
| 37.0 |
CMPO |
95.44 |
94.85 |
92.78 |
24.36 |
Industrials |
Metal Fabrication |
35 |
48.65 |
26.72 |
81.76 |
23.61 |
1.0 |
17.0 |
15.27 |
1.0 |
1.0 |
| 38.0 |
TVTX |
95.32 |
89.16 |
25.28 |
0.68 |
Healthcare |
Biotechnology |
12 |
27.55 |
13.92 |
54.98 |
24.93 |
46.0 |
67.0 |
17.95 |
1.0 |
1.0 |
| 39.0 |
USLM |
95.29 |
94.79 |
95.0 |
93.17 |
Basic Materials |
Building Materials |
78 |
89.01 |
89.86 |
54.98 |
78.18 |
1.0 |
13.0 |
101.97 |
1.0 |
1.0 |
| 40.0 |
TYRA |
95.14 |
77.28 |
78.32 |
48.38 |
Healthcare |
Biotechnology |
12 |
2.9 |
0.0 |
84.64 |
0.0 |
48.0 |
69.0 |
28.23 |
1.0 |
1.0 |
| 41.0 |
JXN |
95.01 |
96.67 |
95.37 |
93.85 |
Financial |
Insurance - Life |
43 |
78.1 |
63.23 |
22.28 |
75.06 |
1.0 |
15.0 |
97.69 |
1.0 |
1.0 |
| 42.0 |
KKR |
94.92 |
94.3 |
93.74 |
91.65 |
Financial |
Asset Management |
67 |
0.0 |
0.0 |
86.79 |
0.0 |
1.0 |
16.0 |
138.55 |
1.0 |
1.0 |
| 43.0 |
HBB |
94.8 |
95.93 |
96.48 |
95.9 |
Consumer Cyclical |
Furnishings, Fixtures & Appliances |
22 |
72.74 |
86.65 |
98.28 |
47.99 |
3.0 |
17.0 |
30.96 |
1.0 |
1.0 |
| 44.0 |
WLDN |
94.74 |
94.24 |
92.56 |
93.14 |
Industrials |
Engineering & Construction |
13 |
99.13 |
89.95 |
81.76 |
60.44 |
5.0 |
22.0 |
44.45 |
1.0 |
1.0 |
| 45.0 |
TRU |
94.58 |
77.93 |
64.78 |
49.96 |
Financial |
Financial Data & Stock Exchanges |
40 |
29.5 |
13.85 |
81.76 |
76.93 |
2.0 |
18.0 |
108.66 |
1.0 |
1.0 |
| 46.0 |
TPG |
94.55 |
91.96 |
90.53 |
84.29 |
Financial |
Asset Management |
67 |
39.8 |
93.64 |
76.59 |
68.56 |
2.0 |
19.0 |
66.98 |
1.0 |
1.0 |
| 47.0 |
AKRO |
94.49 |
3.2 |
2.92 |
2.51 |
Healthcare |
Biotechnology |
12 |
6.0 |
0.0 |
75.12 |
0.0 |
53.0 |
74.0 |
28.67 |
1.0 |
1.0 |
| 48.0 |
RCL |
94.21 |
91.13 |
90.41 |
95.65 |
Consumer Cyclical |
Travel Services |
28 |
98.7 |
92.23 |
97.02 |
91.77 |
2.0 |
20.0 |
201.13 |
1.0 |
1.0 |
| 49.0 |
GVA |
94.15 |
93.9 |
94.07 |
81.06 |
Industrials |
Engineering & Construction |
13 |
89.17 |
77.06 |
66.67 |
74.27 |
6.0 |
26.0 |
82.62 |
1.0 |
1.0 |
| 50.0 |
ELVN |
94.09 |
91.72 |
77.76 |
23.52 |
Healthcare |
Biotechnology |
12 |
35.78 |
0.0 |
94.17 |
0.0 |
56.0 |
78.0 |
28.96 |
1.0 |
1.0 |
| 51.0 |
NVEI |
94.0 |
94.52 |
94.17 |
16.26 |
Technology |
Software - Infrastructure |
60 |
14.32 |
34.35 |
39.16 |
42.94 |
6.0 |
26.0 |
33.54 |
1.0 |
1.0 |
| 52.0 |
ENVA |
93.88 |
83.96 |
85.75 |
80.1 |
Financial |
Credit Services |
34 |
25.11 |
41.7 |
59.16 |
73.23 |
3.0 |
20.0 |
88.16 |
1.0 |
1.0 |
| 53.0 |
SPOT |
93.84 |
95.78 |
95.89 |
96.18 |
Communication Services |
Internet Content & Information |
107 |
56.41 |
90.95 |
96.04 |
96.81 |
3.0 |
6.0 |
379.83 |
1.0 |
1.0 |
| 54.0 |
BWIN |
93.72 |
94.33 |
92.13 |
47.45 |
Financial |
Insurance Brokers |
14 |
38.84 |
73.01 |
64.75 |
60.65 |
1.0 |
21.0 |
51.86 |
1.0 |
1.0 |
| 55.0 |
HWM |
93.69 |
94.95 |
95.25 |
82.8 |
Industrials |
Aerospace & Defense |
38 |
95.7 |
89.76 |
27.41 |
78.73 |
6.0 |
27.0 |
102.83 |
1.0 |
1.0 |
| 56.0 |
TSM |
93.14 |
92.89 |
94.2 |
88.48 |
Technology |
Semiconductors |
106 |
67.58 |
38.27 |
25.18 |
88.9 |
5.0 |
32.0 |
200.86 |
1.0 |
1.0 |
| 57.0 |
QFIN |
93.05 |
93.13 |
87.23 |
49.0 |
Financial |
Credit Services |
34 |
22.45 |
36.99 |
53.81 |
44.67 |
5.0 |
23.0 |
33.84 |
1.0 |
1.0 |
| 58.0 |
UI |
92.55 |
88.64 |
66.91 |
3.07 |
Technology |
Communication Equipment |
1 |
10.67 |
8.82 |
97.02 |
91.56 |
5.0 |
40.0 |
253.66 |
1.0 |
1.0 |
| 59.0 |
MCY |
92.49 |
95.13 |
94.85 |
91.55 |
Financial |
Insurance - Property & Casualty |
77 |
62.38 |
97.88 |
71.21 |
69.77 |
2.0 |
26.0 |
66.2 |
1.0 |
1.0 |
| 60.0 |
PIPR |
92.34 |
92.18 |
90.9 |
79.85 |
Financial |
Capital Markets |
8 |
80.14 |
92.1 |
59.16 |
95.19 |
5.0 |
27.0 |
288.39 |
1.0 |
1.0 |
| 61.0 |
VNO |
92.31 |
90.82 |
80.41 |
91.09 |
Real Estate |
REIT - Office |
16 |
52.83 |
47.93 |
66.67 |
56.39 |
1.0 |
3.0 |
42.86 |
1.0 |
1.0 |
| 62.0 |
PWP |
92.25 |
92.95 |
89.73 |
94.35 |
Financial |
Capital Markets |
8 |
16.26 |
51.52 |
98.28 |
34.82 |
6.0 |
28.0 |
20.7 |
1.0 |
1.0 |
| 63.0 |
MLI |
92.06 |
92.15 |
93.15 |
88.64 |
Industrials |
Metal Fabrication |
35 |
63.13 |
12.25 |
10.68 |
67.6 |
3.0 |
34.0 |
81.0 |
1.0 |
1.0 |
| 64.0 |
AXON |
92.03 |
93.81 |
93.58 |
81.93 |
Industrials |
Aerospace & Defense |
38 |
85.7 |
81.0 |
75.12 |
97.89 |
7.0 |
35.0 |
442.69 |
1.0 |
1.0 |
| 65.0 |
ROAD |
92.0 |
85.34 |
92.01 |
94.47 |
Industrials |
Engineering & Construction |
13 |
81.53 |
98.23 |
54.98 |
75.44 |
8.0 |
36.0 |
81.76 |
1.0 |
1.0 |
| 66.0 |
EME |
91.97 |
93.93 |
92.75 |
95.12 |
Industrials |
Engineering & Construction |
13 |
98.45 |
96.43 |
90.23 |
97.95 |
9.0 |
37.0 |
445.61 |
1.0 |
1.0 |
| 67.0 |
HLNE |
91.94 |
91.38 |
88.68 |
86.03 |
Financial |
Asset Management |
67 |
30.28 |
52.19 |
98.28 |
88.45 |
3.0 |
29.0 |
175.63 |
1.0 |
1.0 |
| 68.0 |
STEP |
91.72 |
92.02 |
87.78 |
88.45 |
Financial |
Asset Management |
67 |
17.63 |
80.39 |
98.28 |
66.73 |
4.0 |
31.0 |
60.27 |
1.0 |
1.0 |
| 69.0 |
TPB |
91.66 |
89.47 |
88.74 |
60.55 |
Consumer Defensive |
Tobacco |
31 |
81.34 |
87.16 |
92.51 |
62.2 |
1.0 |
8.0 |
44.61 |
1.0 |
1.0 |
| 70.0 |
IRM |
91.45 |
93.22 |
93.21 |
78.7 |
Real Estate |
REIT - Specialty |
39 |
61.76 |
32.4 |
90.23 |
82.98 |
1.0 |
4.0 |
125.54 |
1.0 |
1.0 |
| 71.0 |
DASH |
91.42 |
91.22 |
87.72 |
95.59 |
Communication Services |
Internet Content & Information |
107 |
46.58 |
89.73 |
90.23 |
87.93 |
4.0 |
7.0 |
150.91 |
1.0 |
1.0 |
| 72.0 |
TGLS |
91.38 |
93.53 |
93.0 |
68.65 |
Basic Materials |
Building Materials |
78 |
62.6 |
6.64 |
81.76 |
68.08 |
2.0 |
22.0 |
69.13 |
1.0 |
1.0 |
| 73.0 |
TOL |
91.35 |
94.76 |
93.49 |
92.55 |
Consumer Cyclical |
Residential Construction |
55 |
89.48 |
72.31 |
59.16 |
86.92 |
2.0 |
27.0 |
146.94 |
1.0 |
1.0 |
| 74.0 |
PRMW |
91.23 |
90.15 |
87.29 |
67.69 |
Consumer Defensive |
Beverages - Non-Alcoholic |
100 |
92.08 |
65.12 |
77.83 |
46.78 |
1.0 |
10.0 |
27.67 |
1.0 |
1.0 |
| 75.0 |
UAL |
91.2 |
64.57 |
43.75 |
66.26 |
Industrials |
Airlines |
88 |
95.97 |
52.83 |
96.57 |
73.4 |
2.0 |
40.0 |
73.44 |
1.0 |
1.0 |
| 76.0 |
AMAL |
91.17 |
88.91 |
90.34 |
83.02 |
Financial |
Banks - Regional |
21 |
79.39 |
64.19 |
62.56 |
51.17 |
7.0 |
32.0 |
33.97 |
1.0 |
1.0 |
| 77.0 |
GE |
91.02 |
93.69 |
93.09 |
95.06 |
Industrials |
Aerospace & Defense |
38 |
85.95 |
88.73 |
91.81 |
91.35 |
8.0 |
41.0 |
181.69 |
1.0 |
1.0 |
| 78.0 |
BSVN |
90.92 |
84.64 |
85.59 |
56.48 |
Financial |
Banks - Regional |
21 |
63.0 |
50.65 |
56.65 |
57.19 |
8.0 |
33.0 |
42.9 |
1.0 |
1.0 |
| 79.0 |
URI |
90.74 |
89.78 |
86.61 |
93.6 |
Industrials |
Rental & Leasing Services |
25 |
86.05 |
42.66 |
62.56 |
99.23 |
3.0 |
42.0 |
834.17 |
1.0 |
1.0 |
| 80.0 |
ALKT |
90.68 |
89.1 |
90.62 |
94.63 |
Technology |
Software - Application |
87 |
43.39 |
83.28 |
70.26 |
54.84 |
17.0 |
50.0 |
38.18 |
1.0 |
1.0 |
| 81.0 |
PRIM |
90.62 |
90.48 |
89.08 |
91.83 |
Industrials |
Engineering & Construction |
13 |
68.2 |
78.44 |
85.83 |
69.01 |
10.0 |
43.0 |
61.34 |
1.0 |
1.0 |
| 82.0 |
TILE |
90.59 |
90.88 |
93.7 |
94.1 |
Industrials |
Building Products & Equipment |
57 |
96.5 |
91.24 |
74.11 |
36.72 |
5.0 |
44.0 |
18.3 |
0.0 |
1.0 |
| 83.0 |
WIX |
90.55 |
87.41 |
87.97 |
78.08 |
Technology |
Software - Infrastructure |
60 |
74.26 |
73.3 |
59.16 |
89.0 |
13.0 |
51.0 |
164.11 |
1.0 |
1.0 |
| 84.0 |
EVR |
90.34 |
90.58 |
88.25 |
88.11 |
Financial |
Capital Markets |
8 |
49.7 |
62.49 |
59.16 |
93.56 |
7.0 |
34.0 |
257.73 |
1.0 |
1.0 |
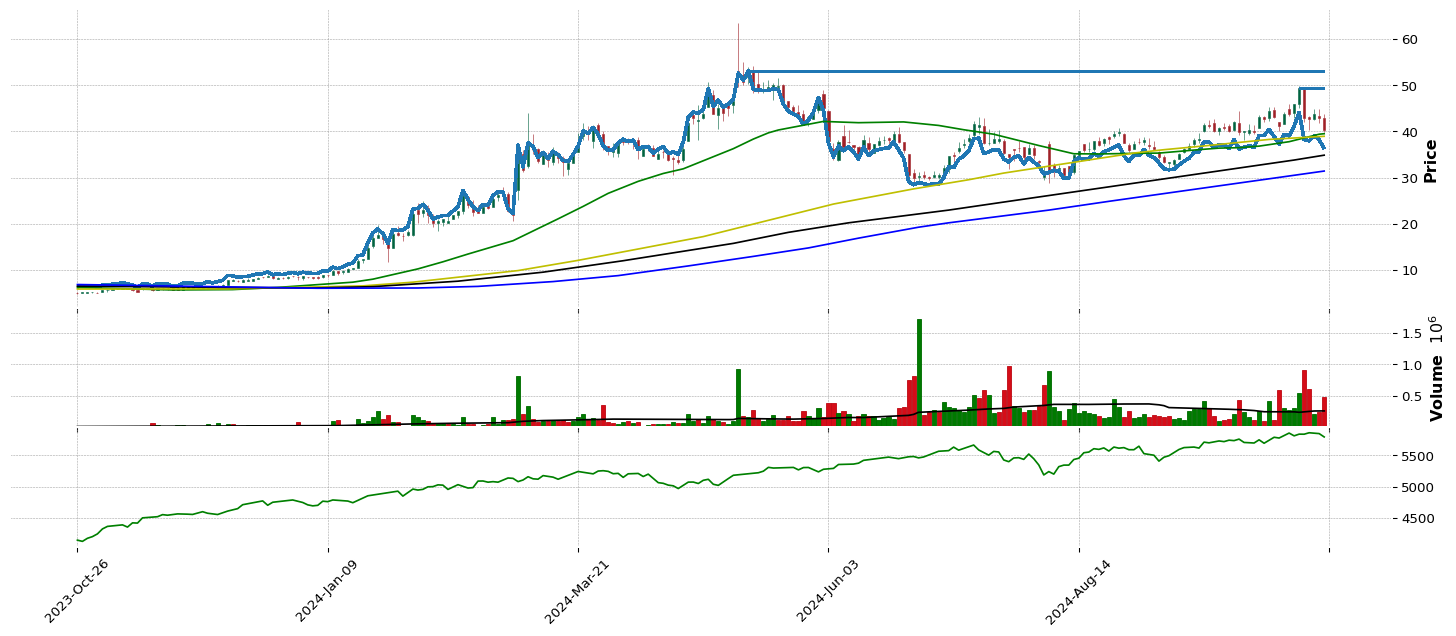
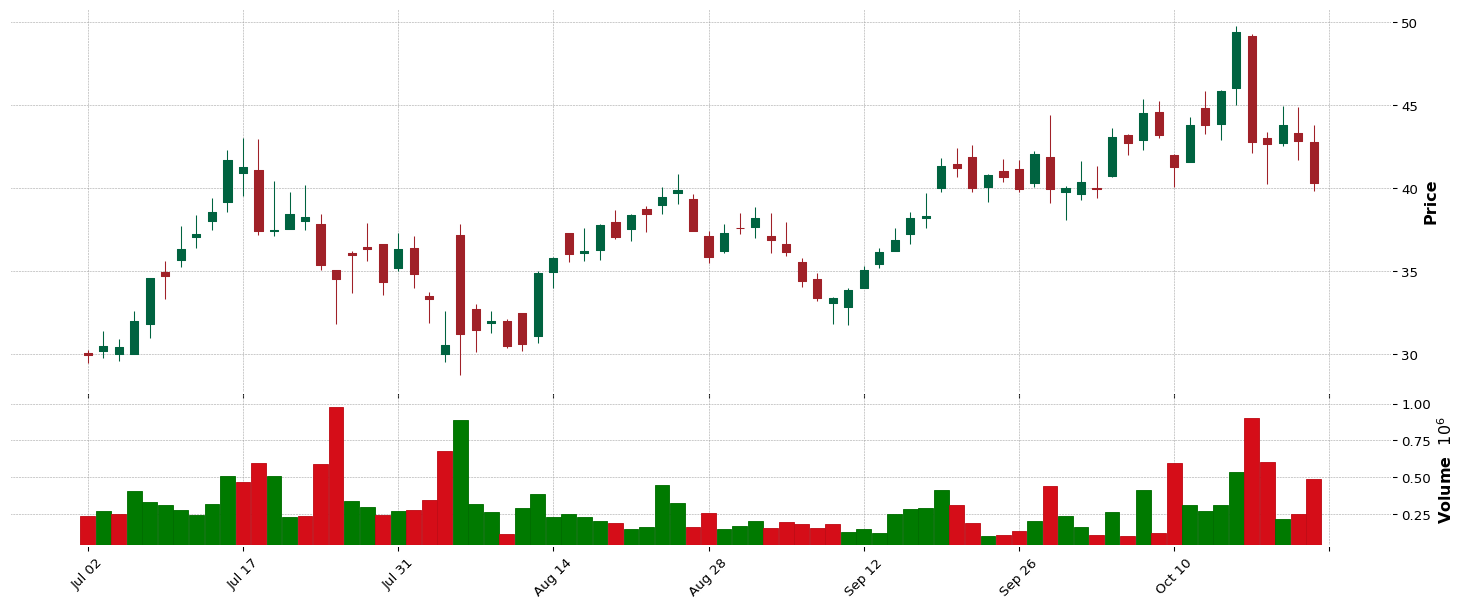
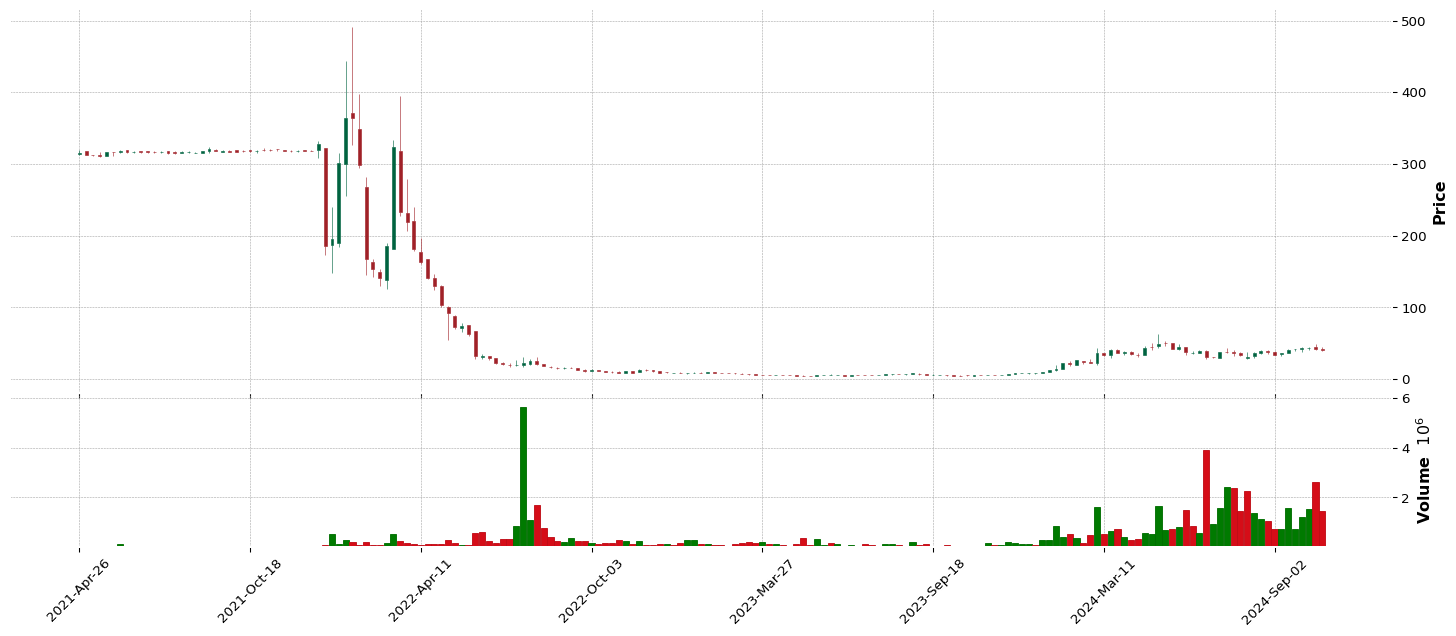
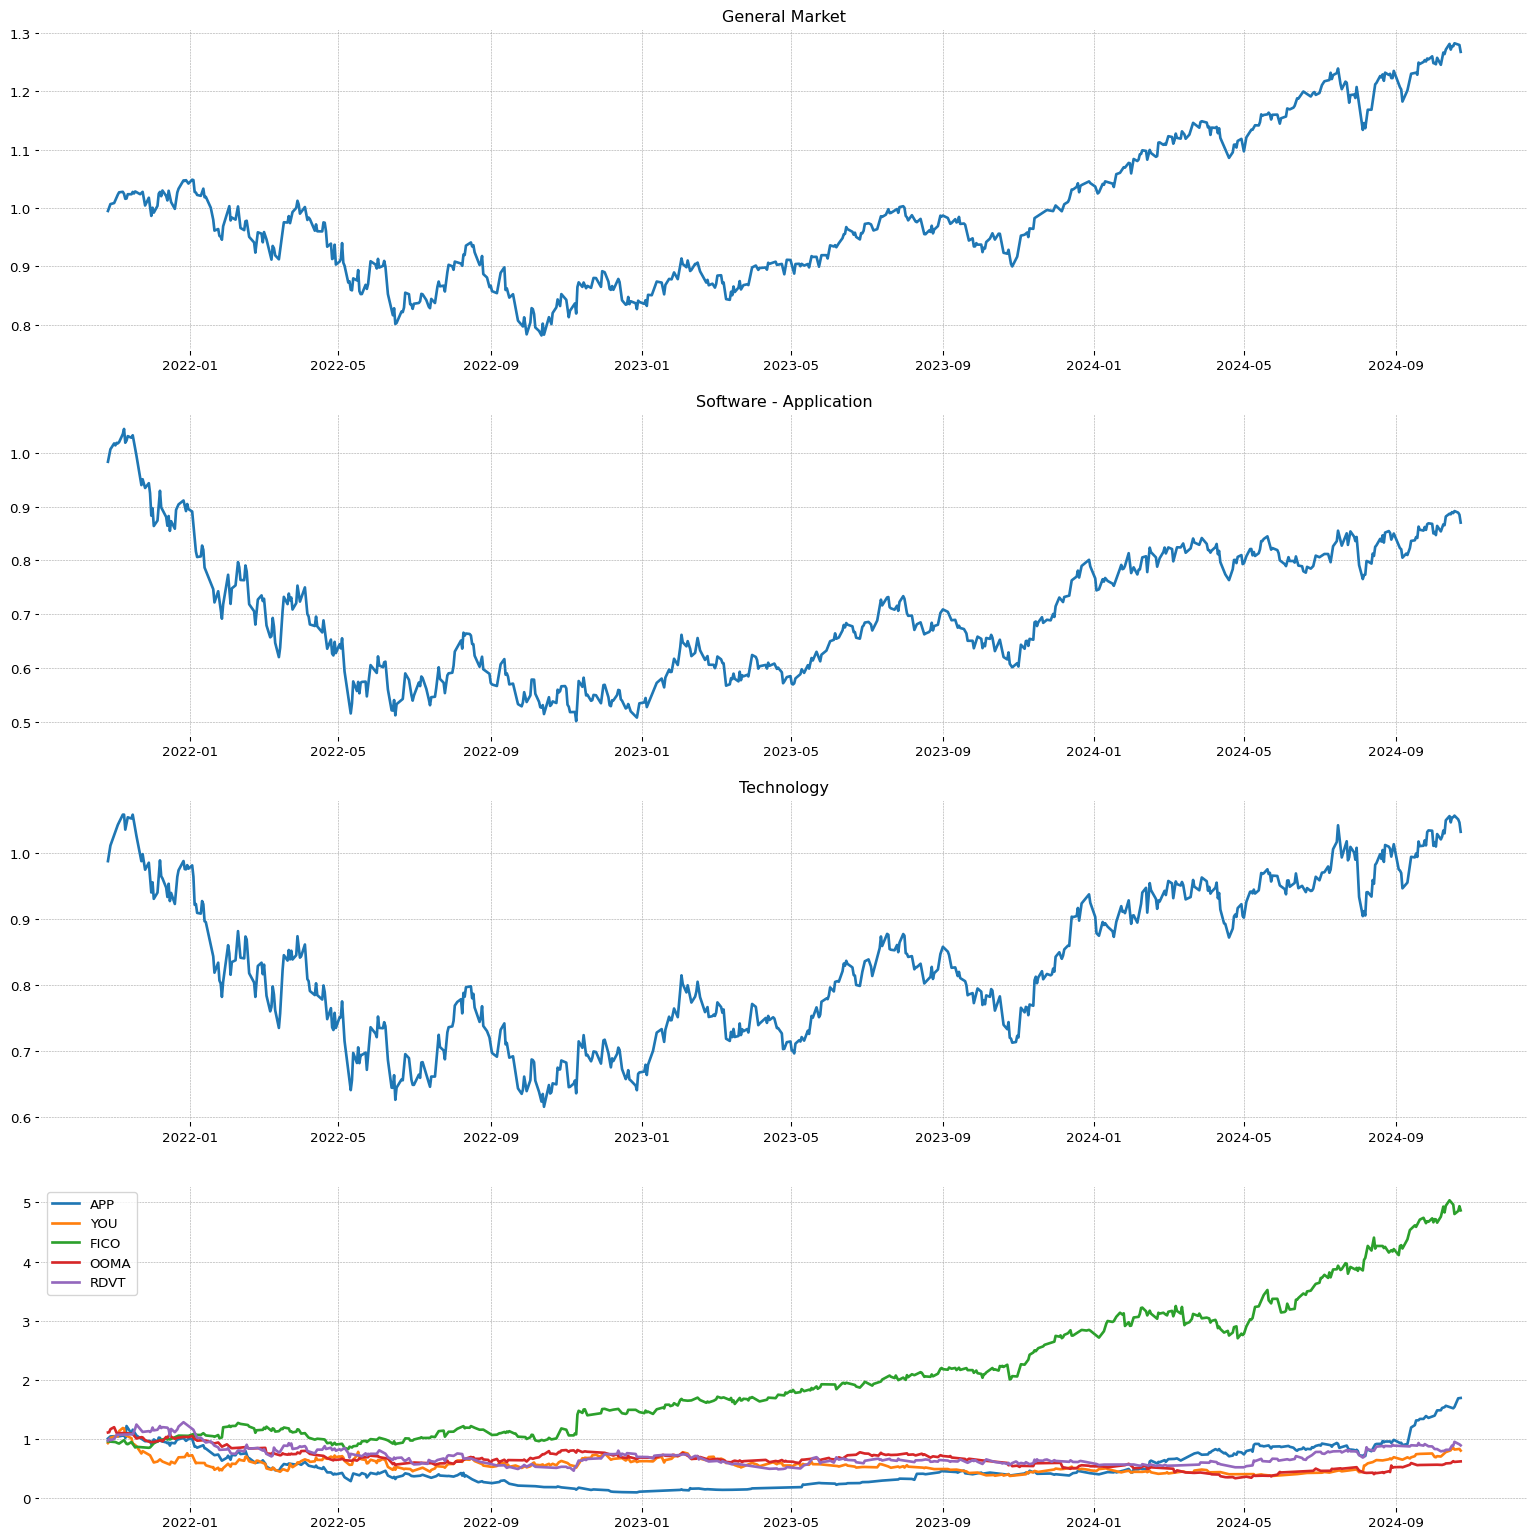
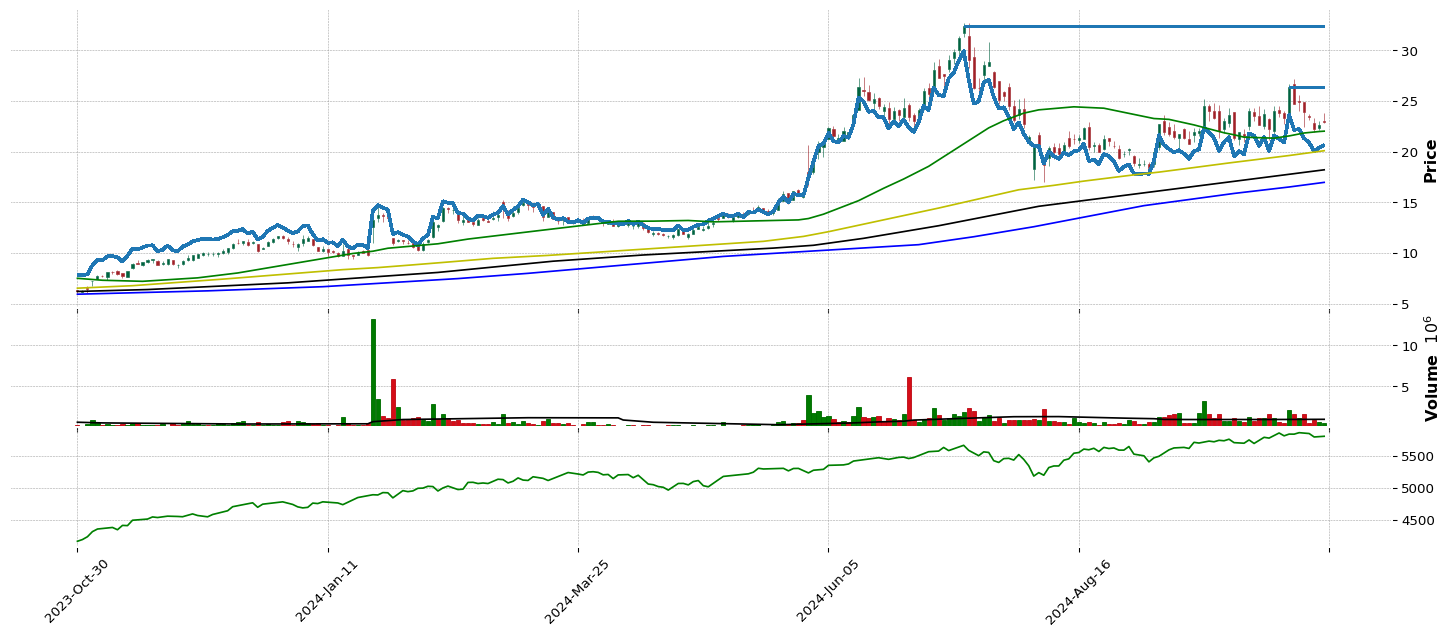
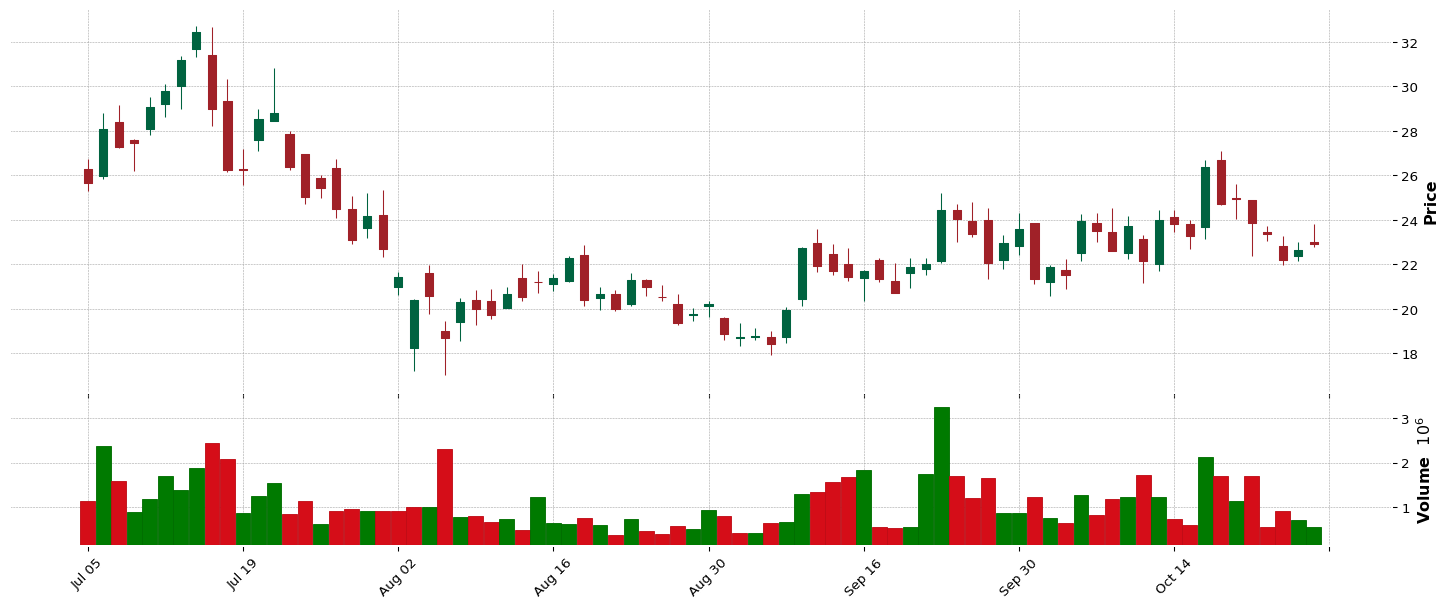
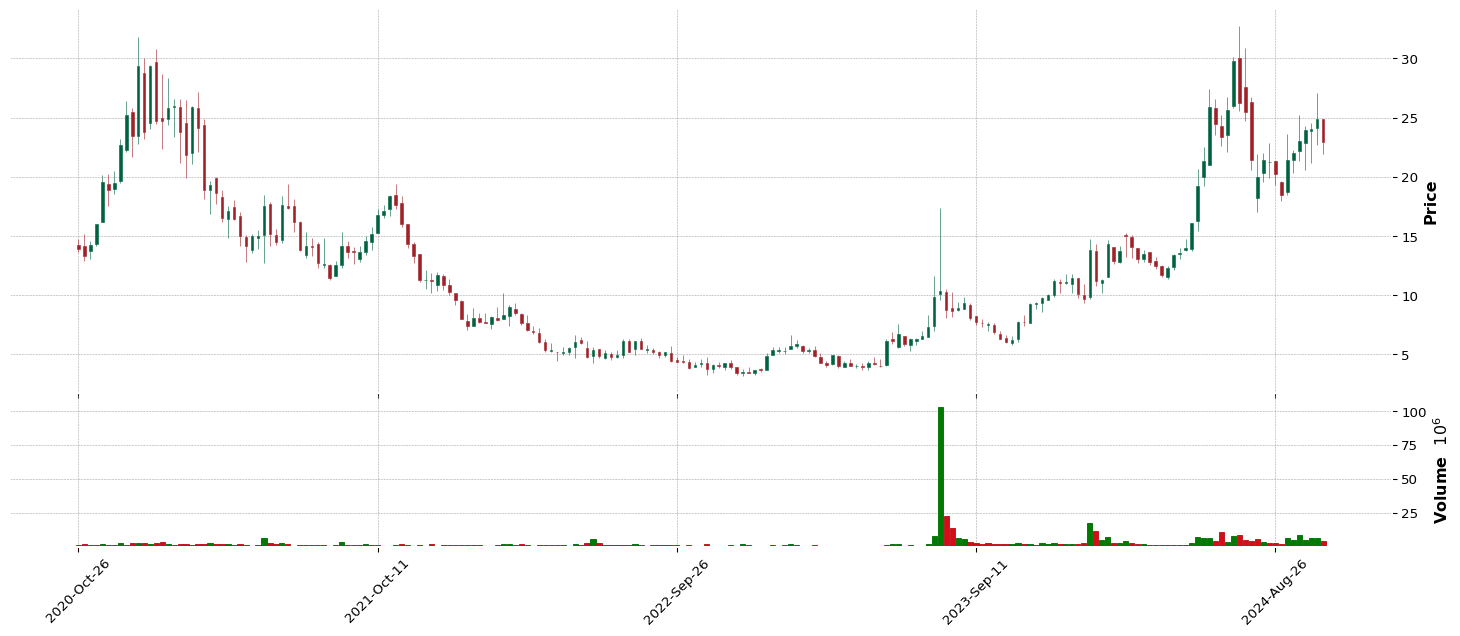
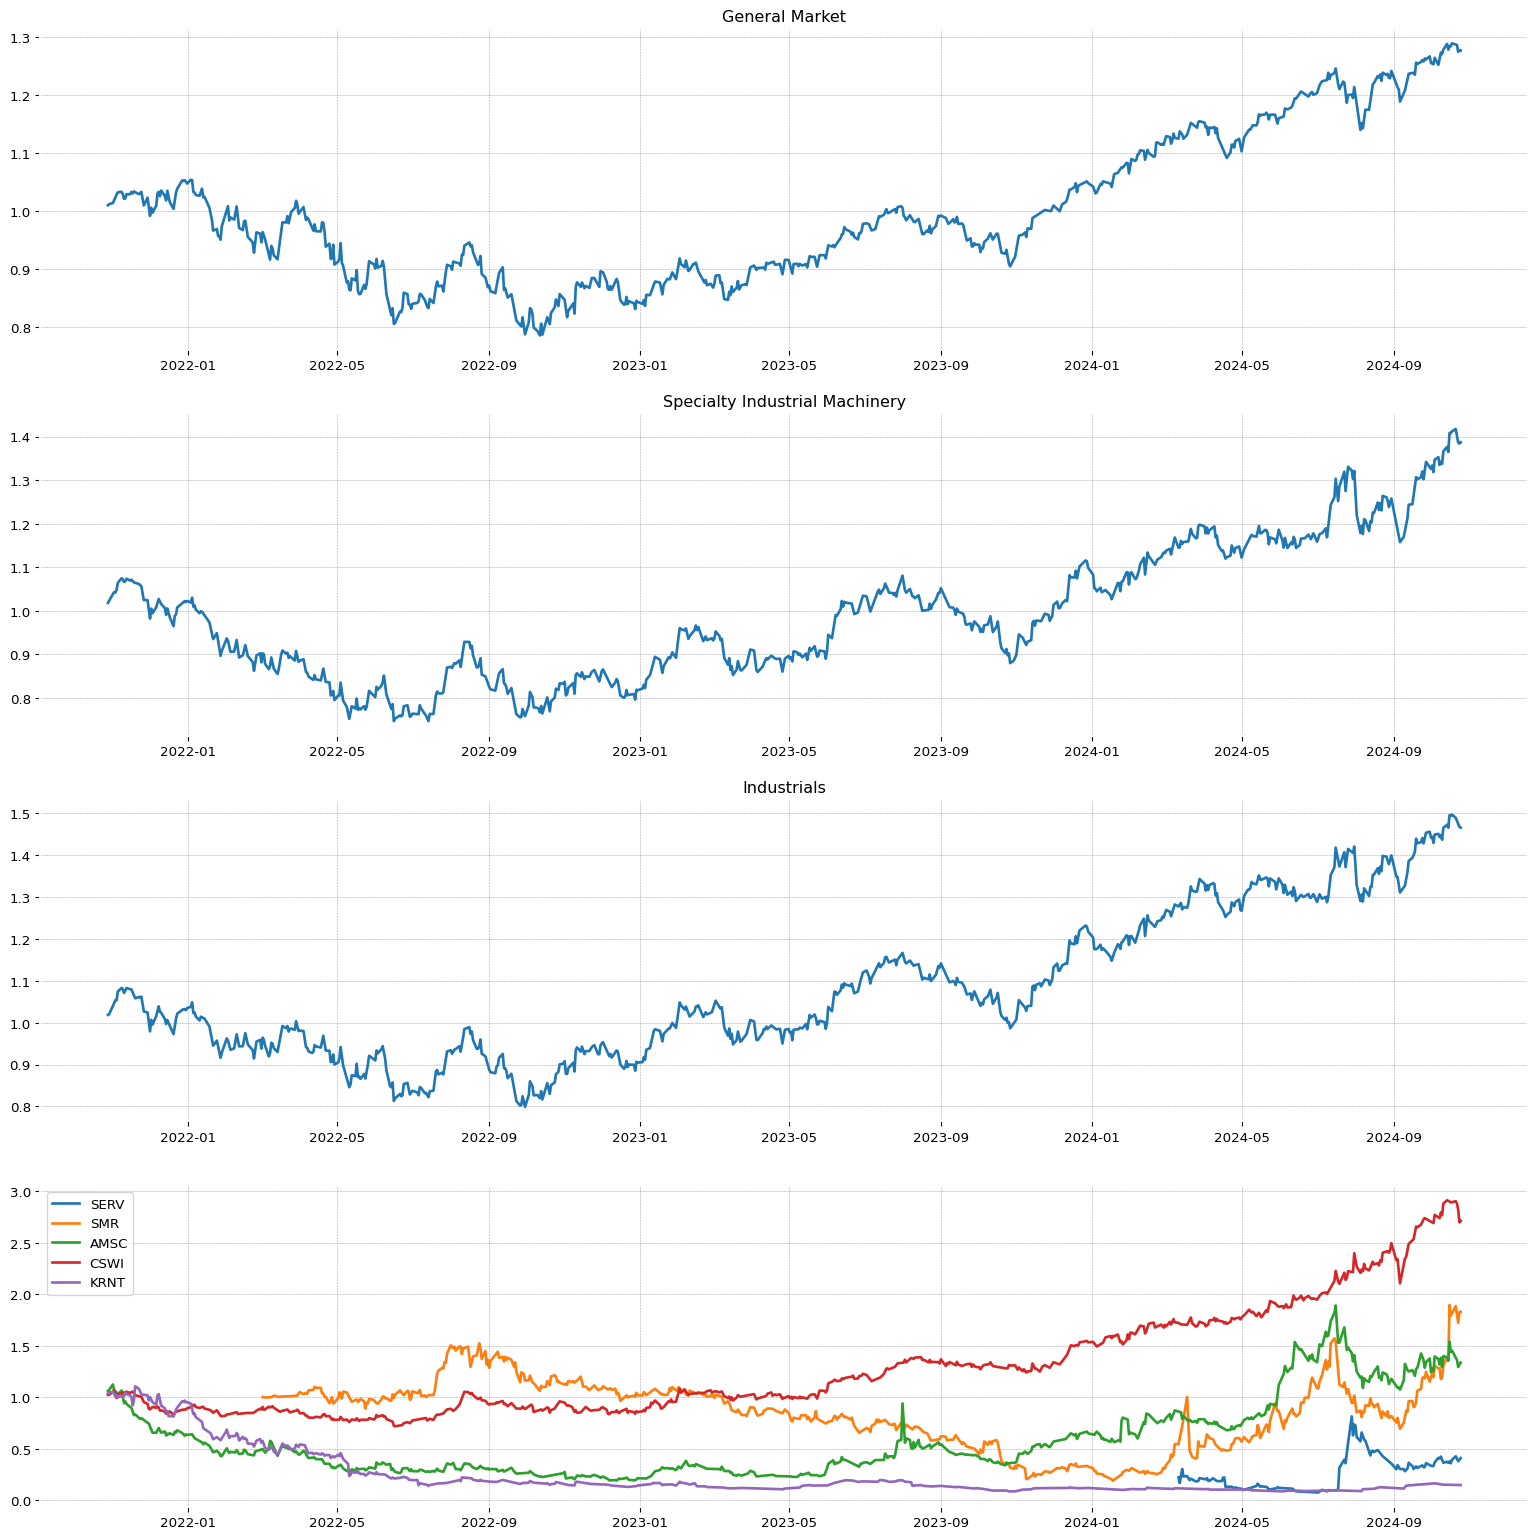
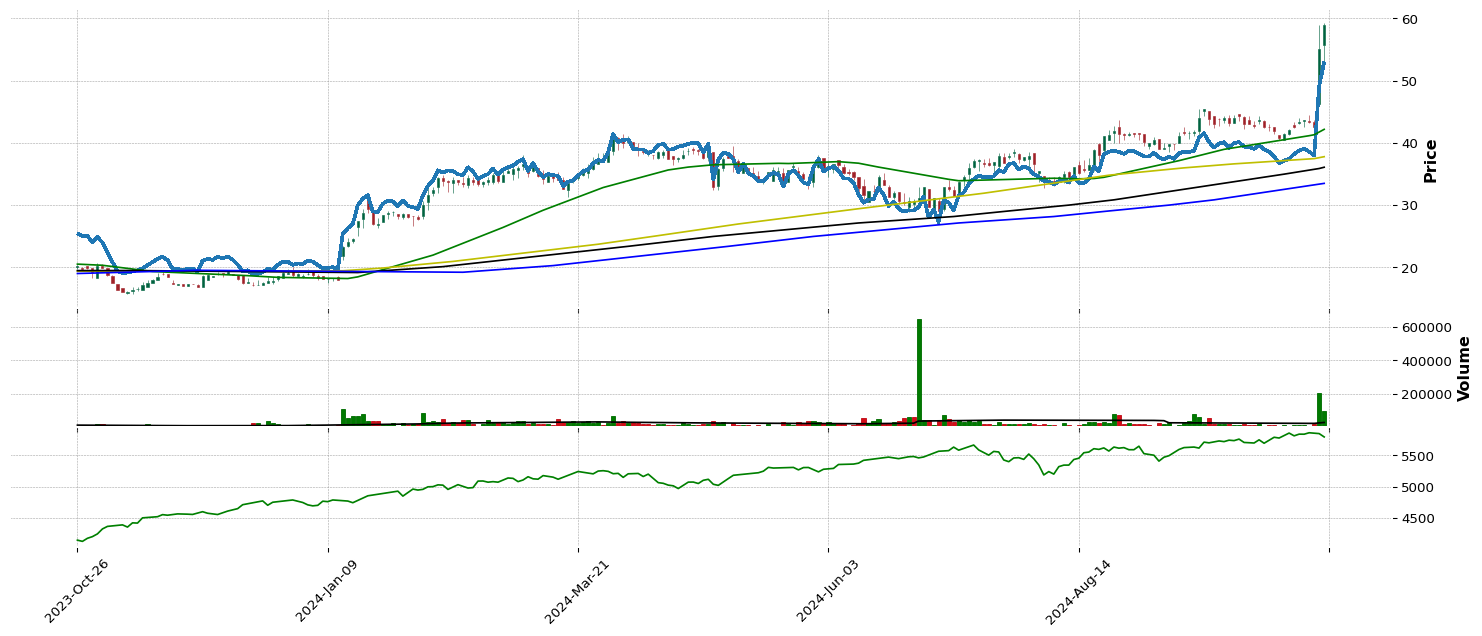
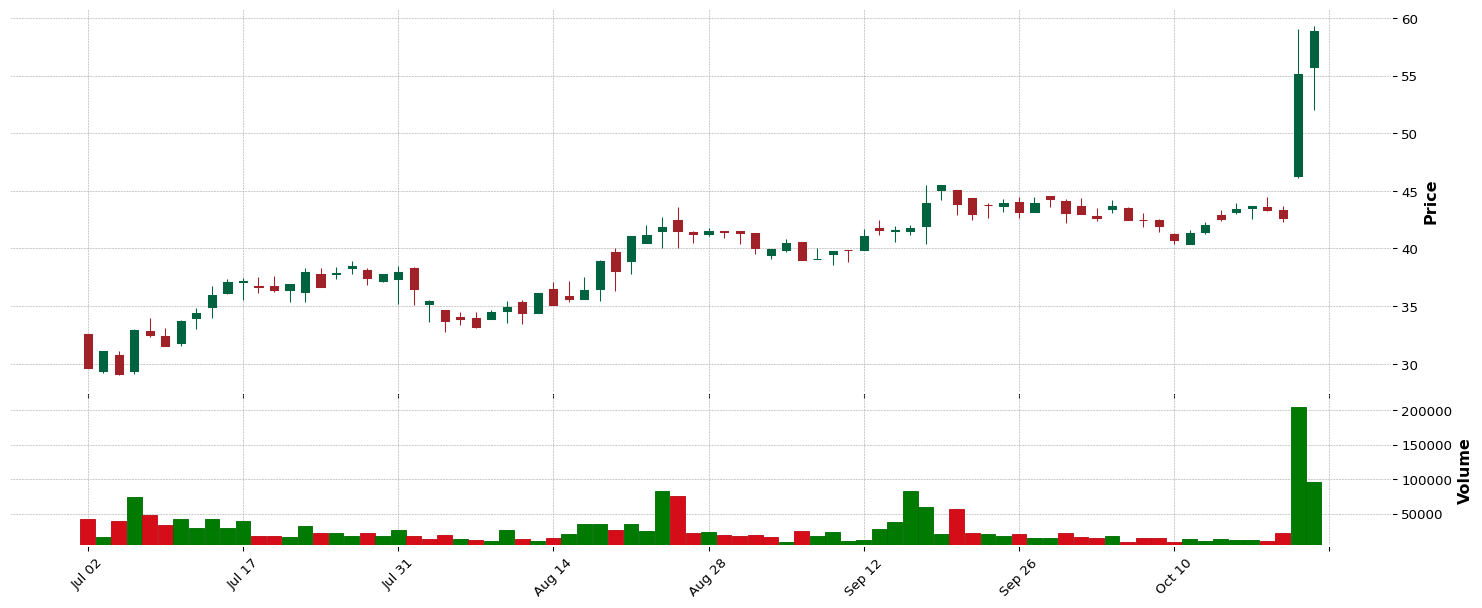
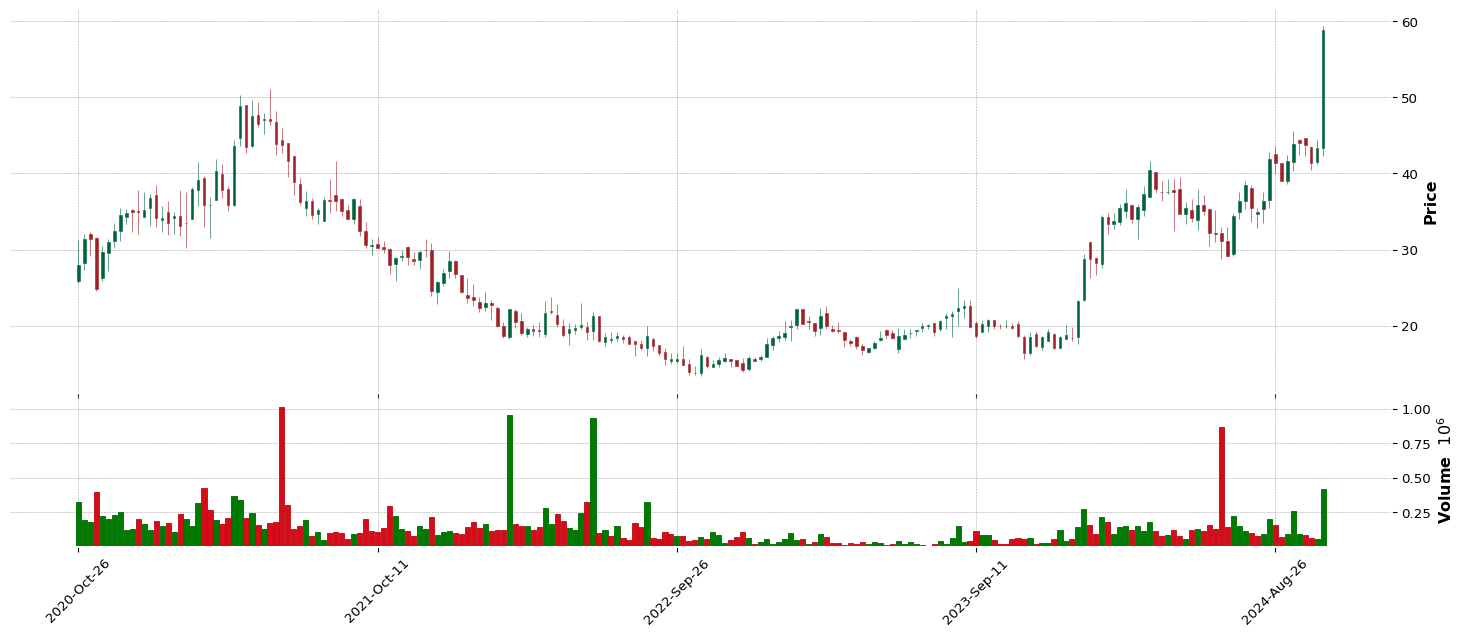
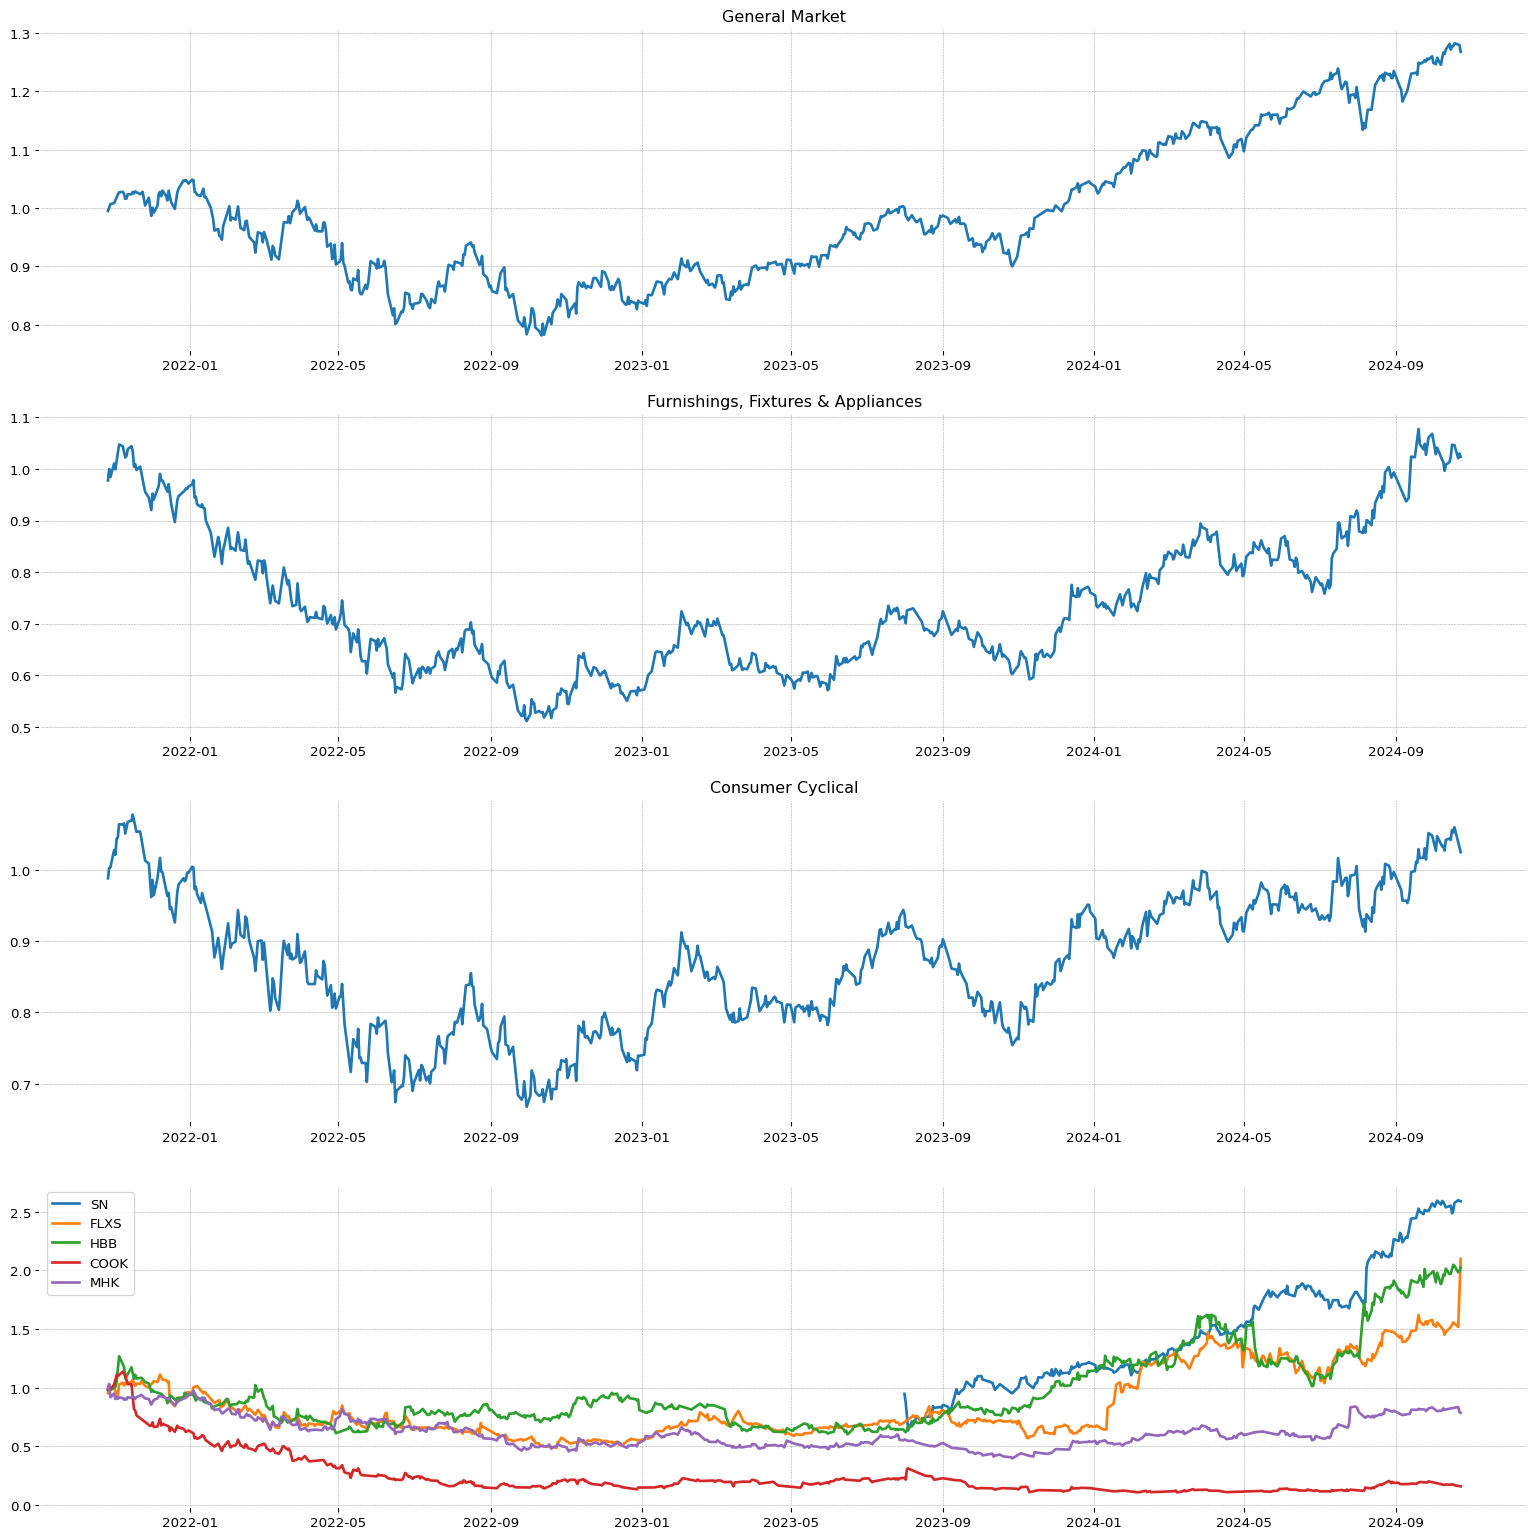
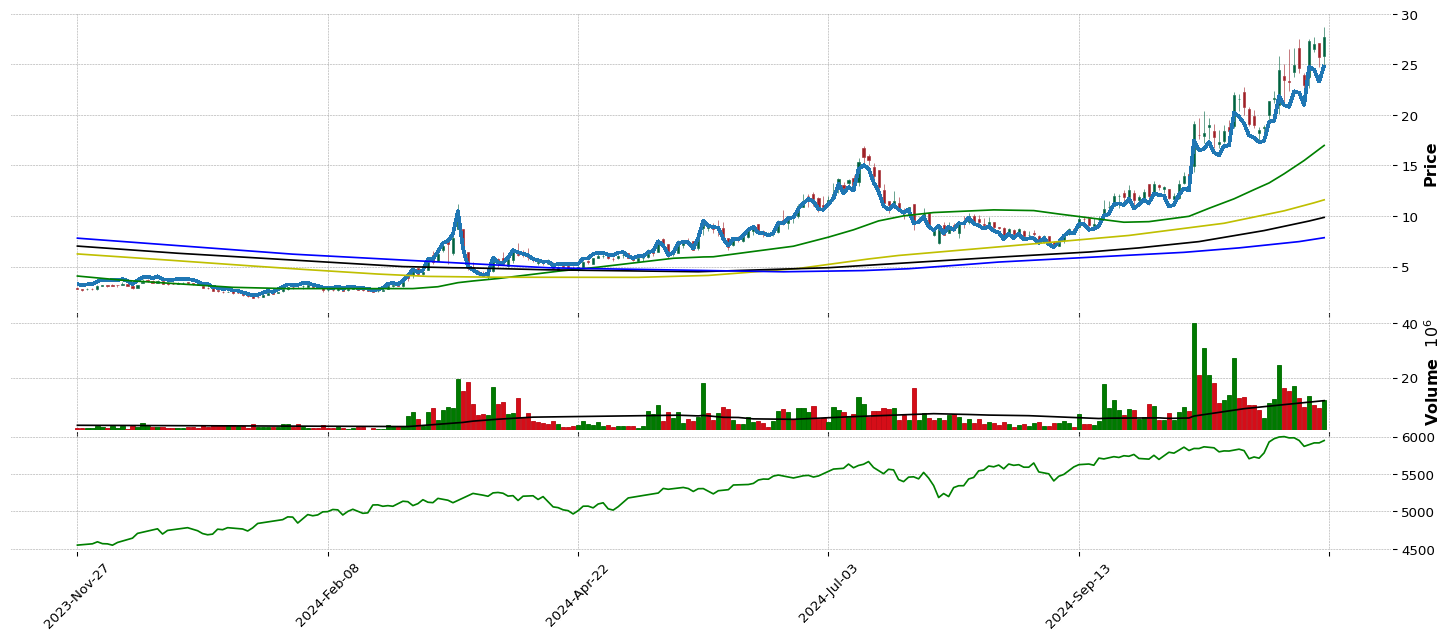
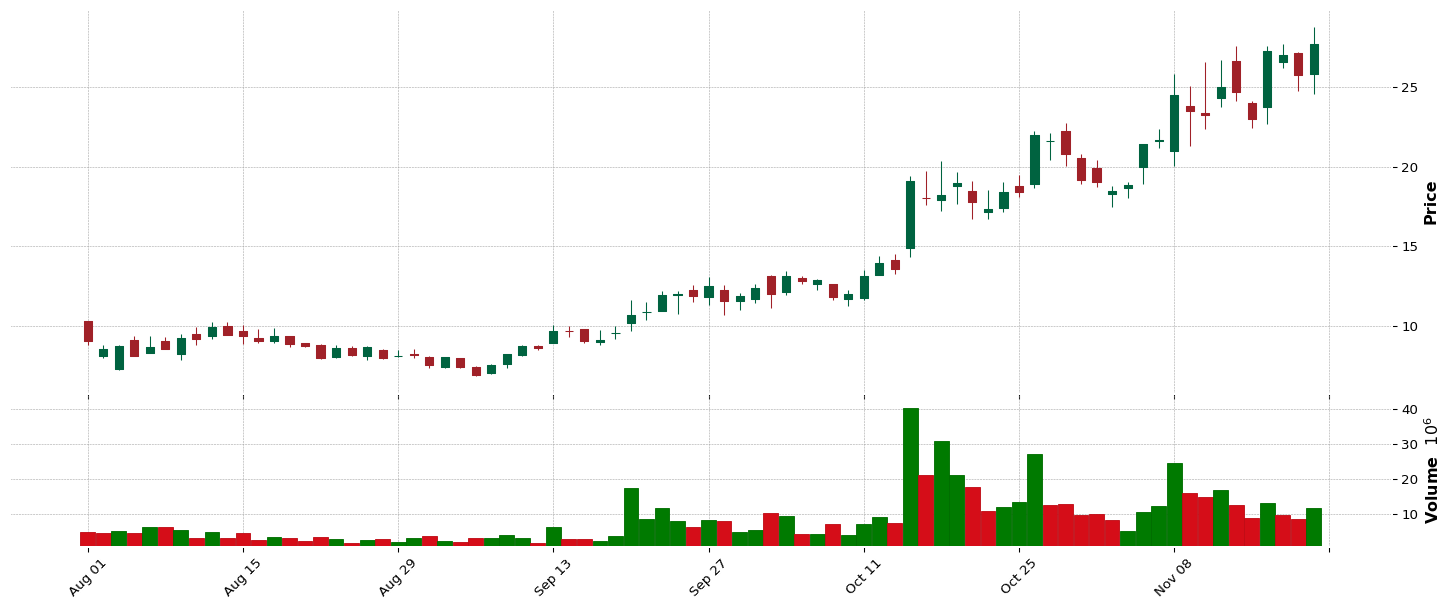
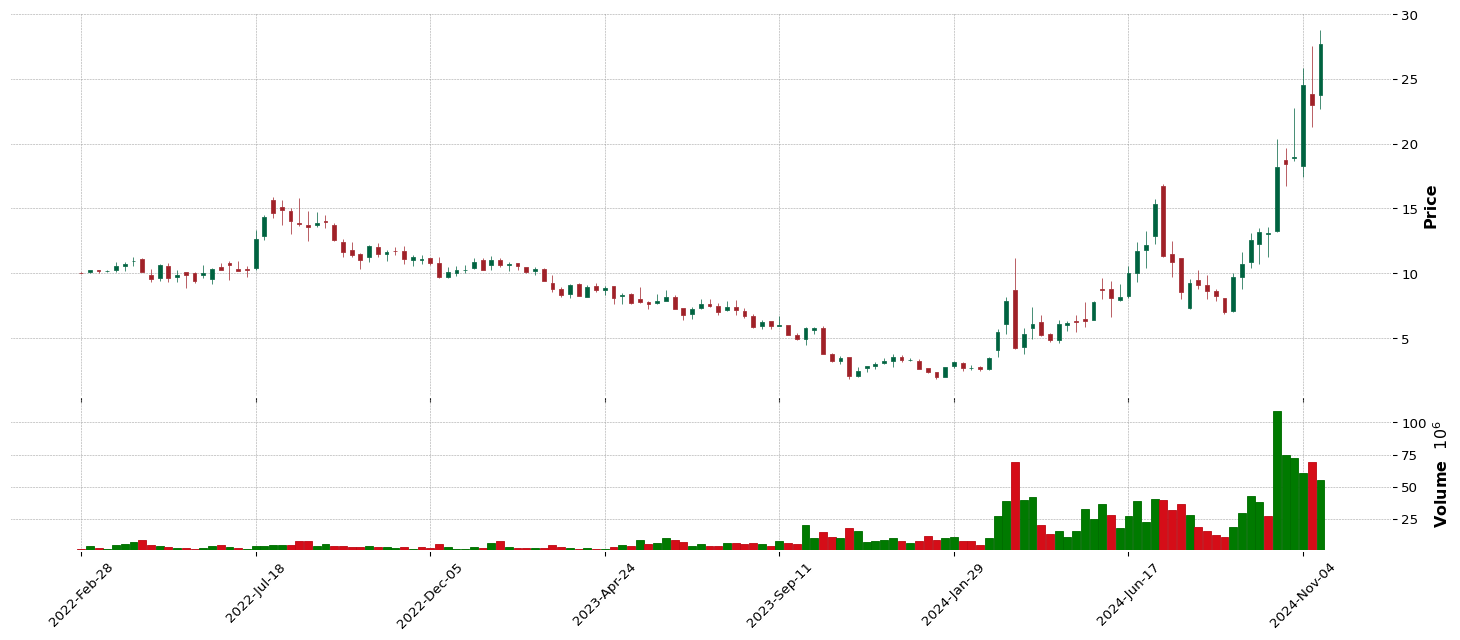
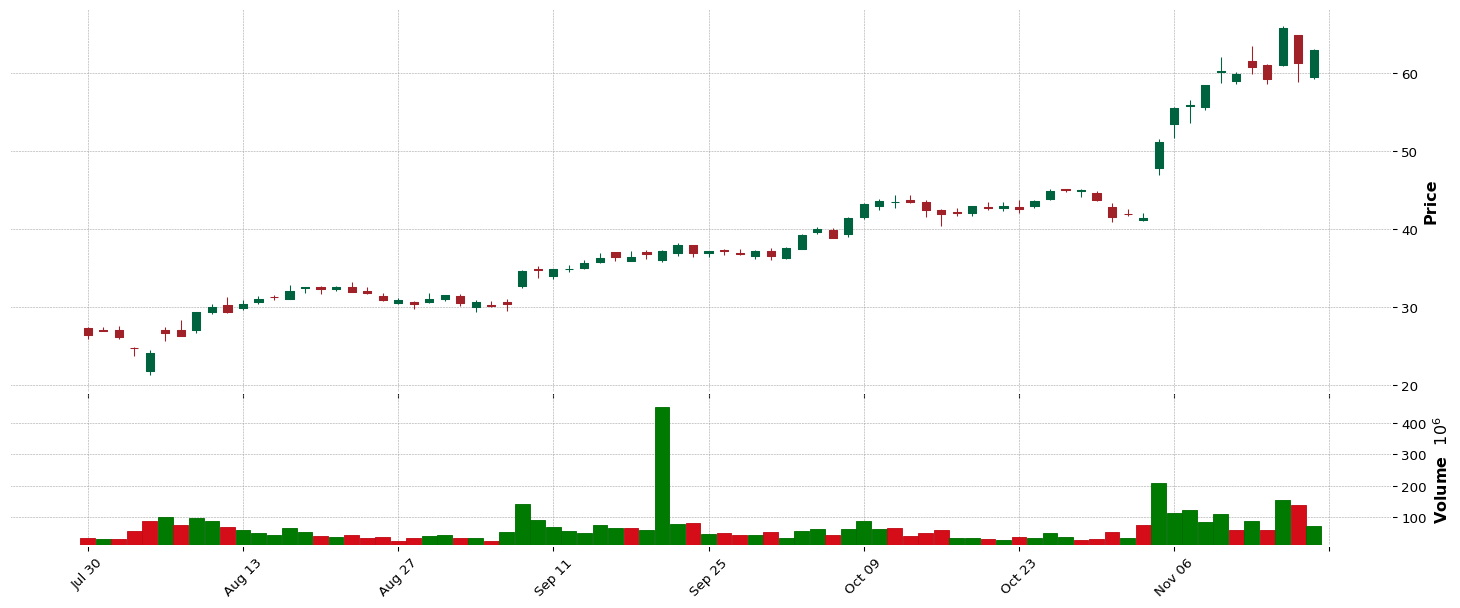
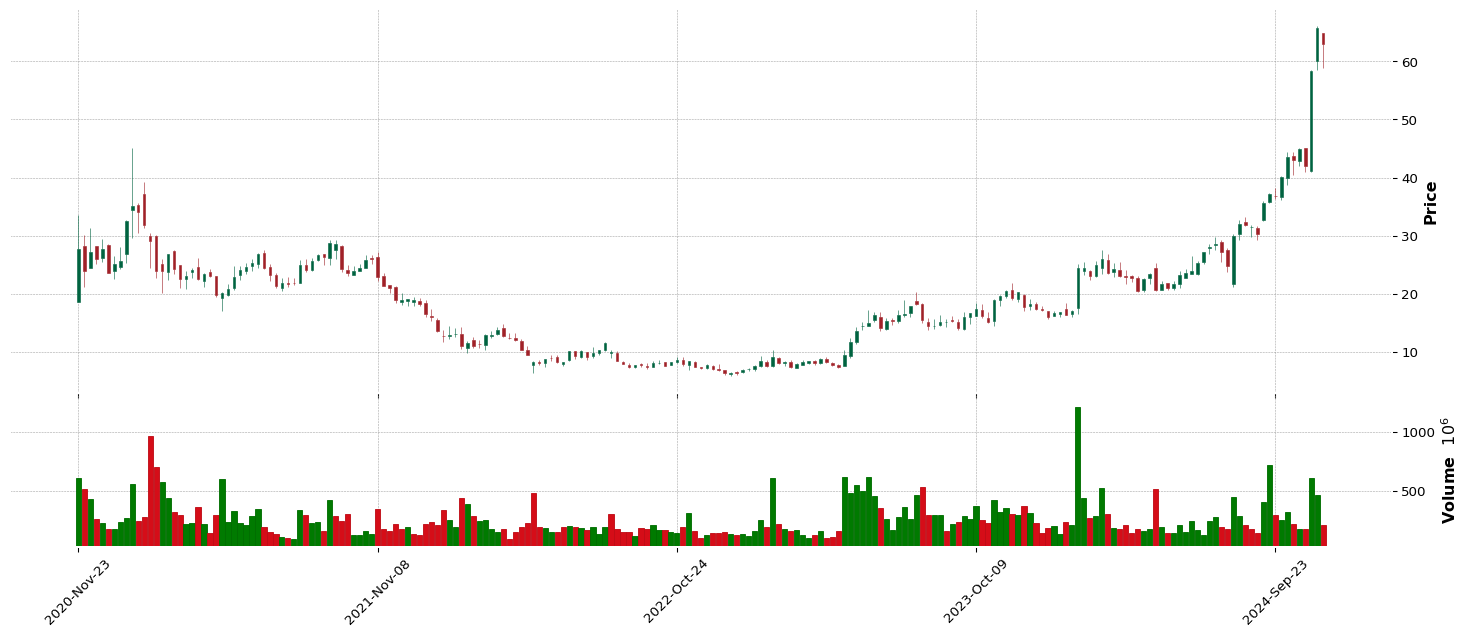
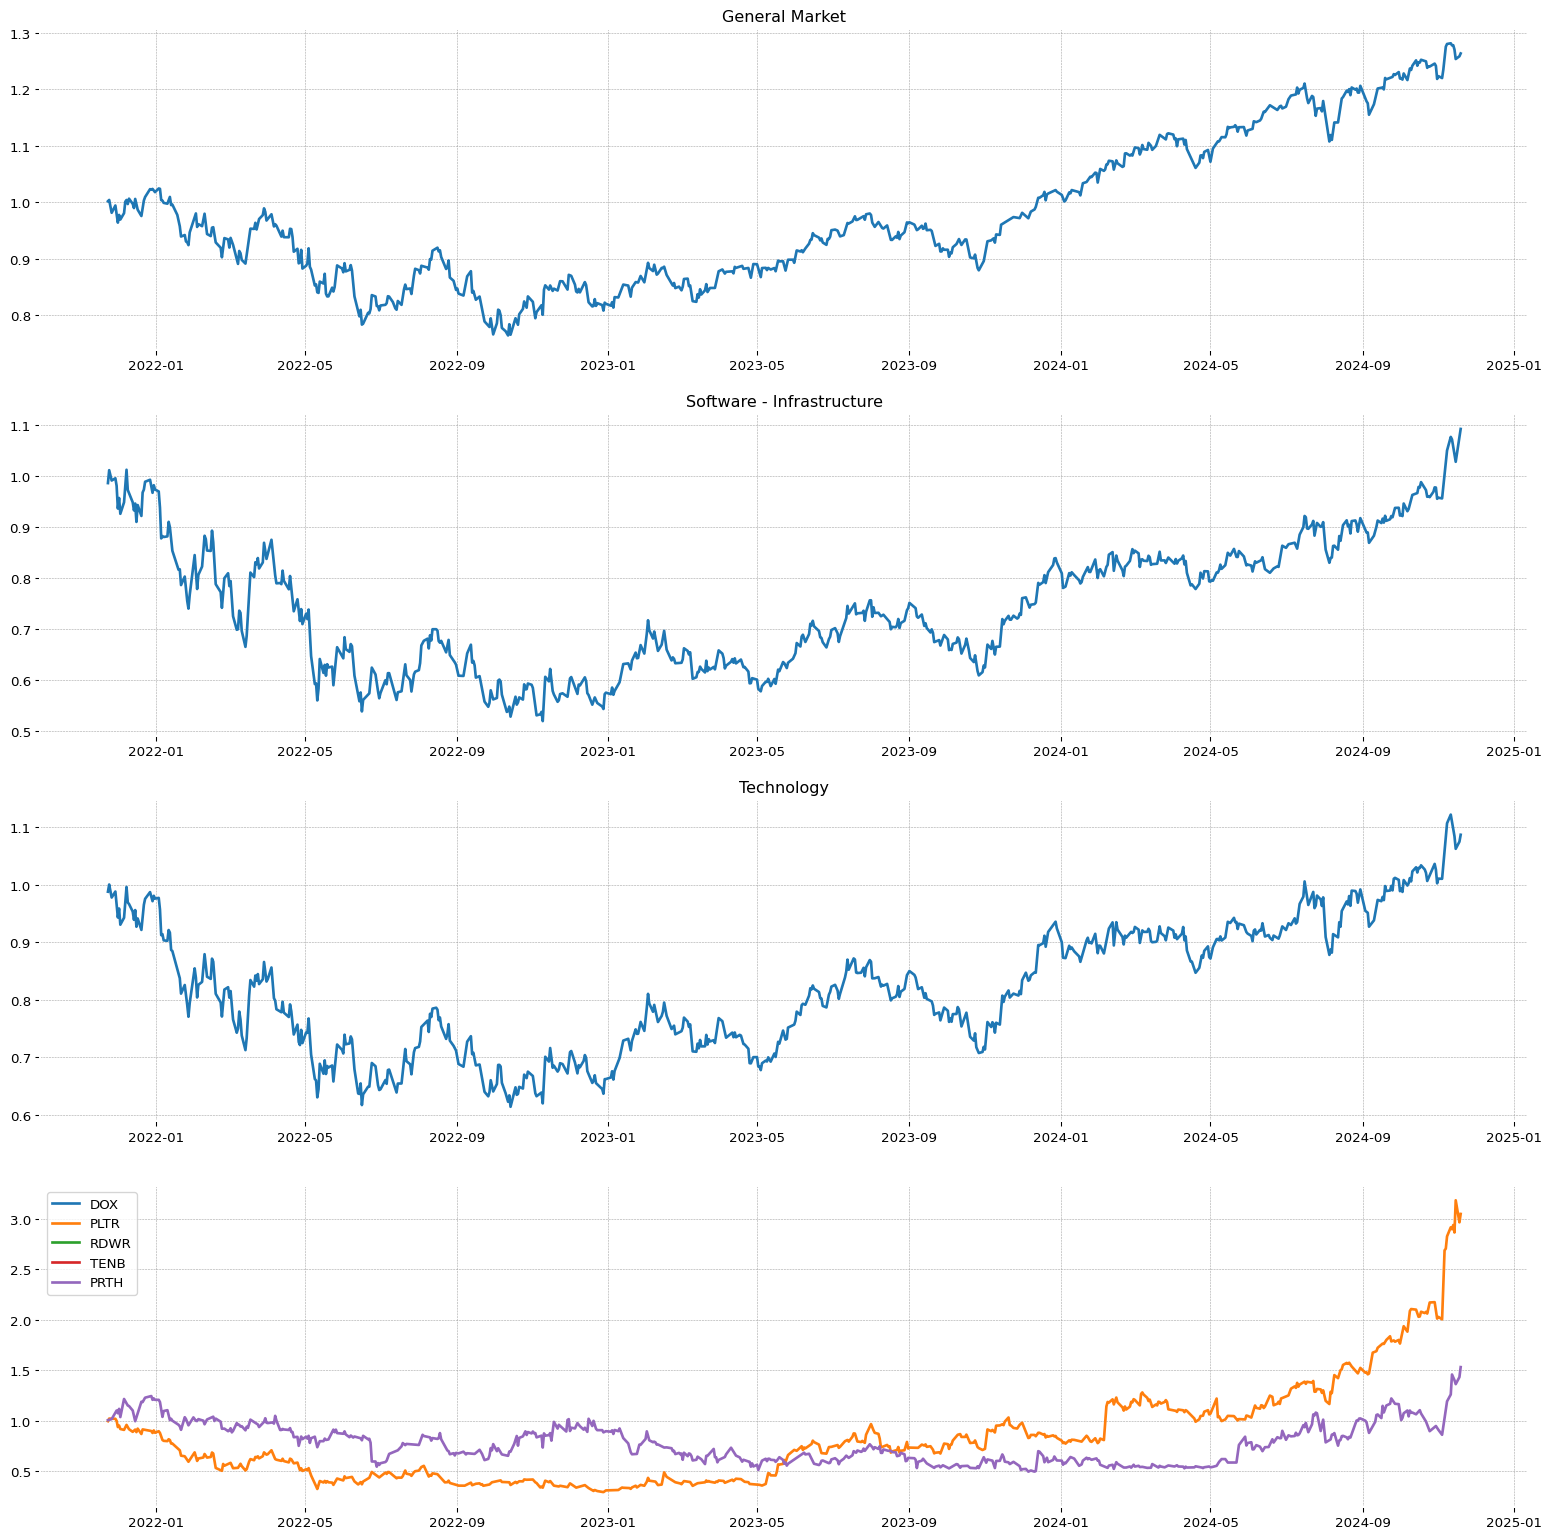
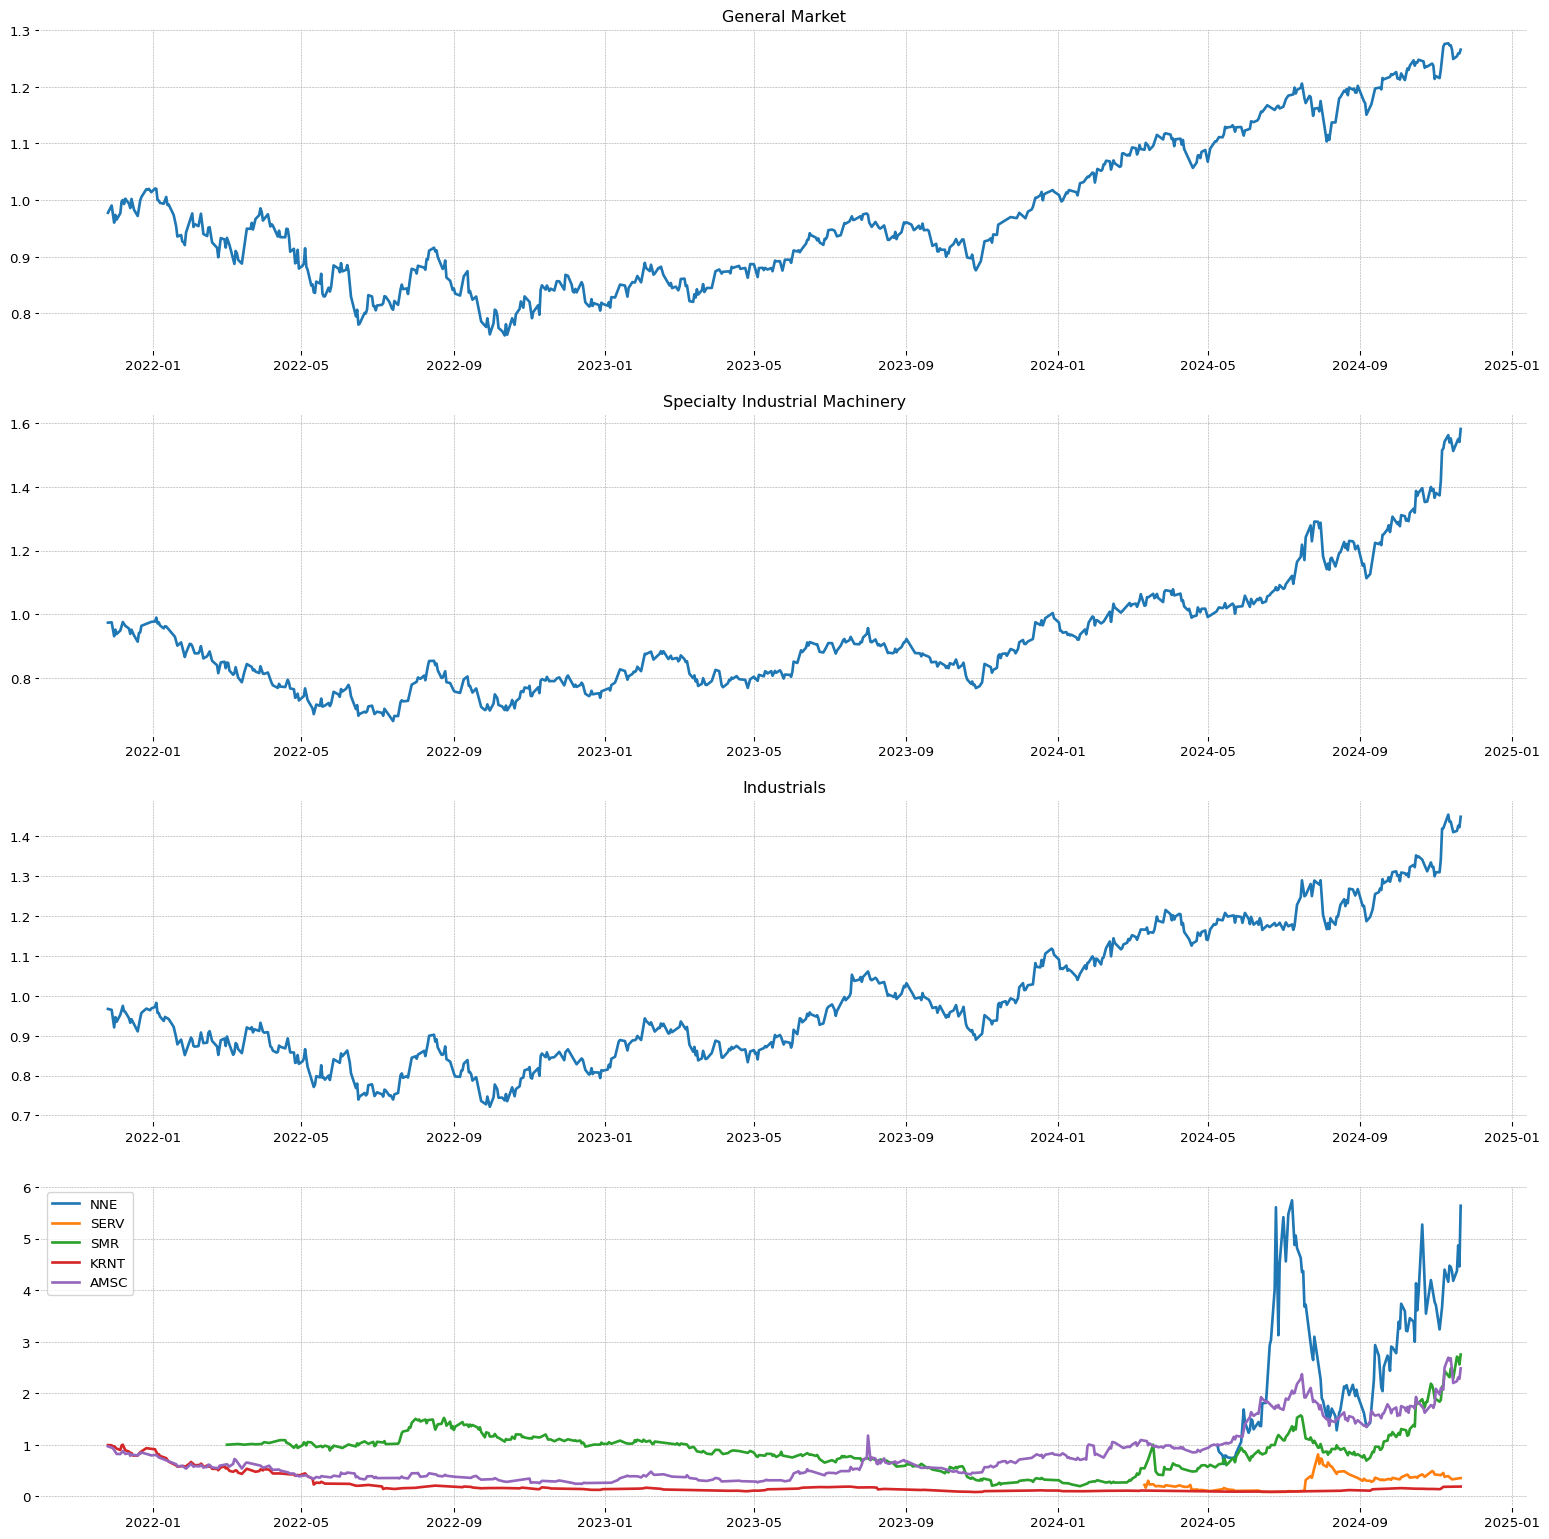 SEZL
SEZL
 CVNA
CVNA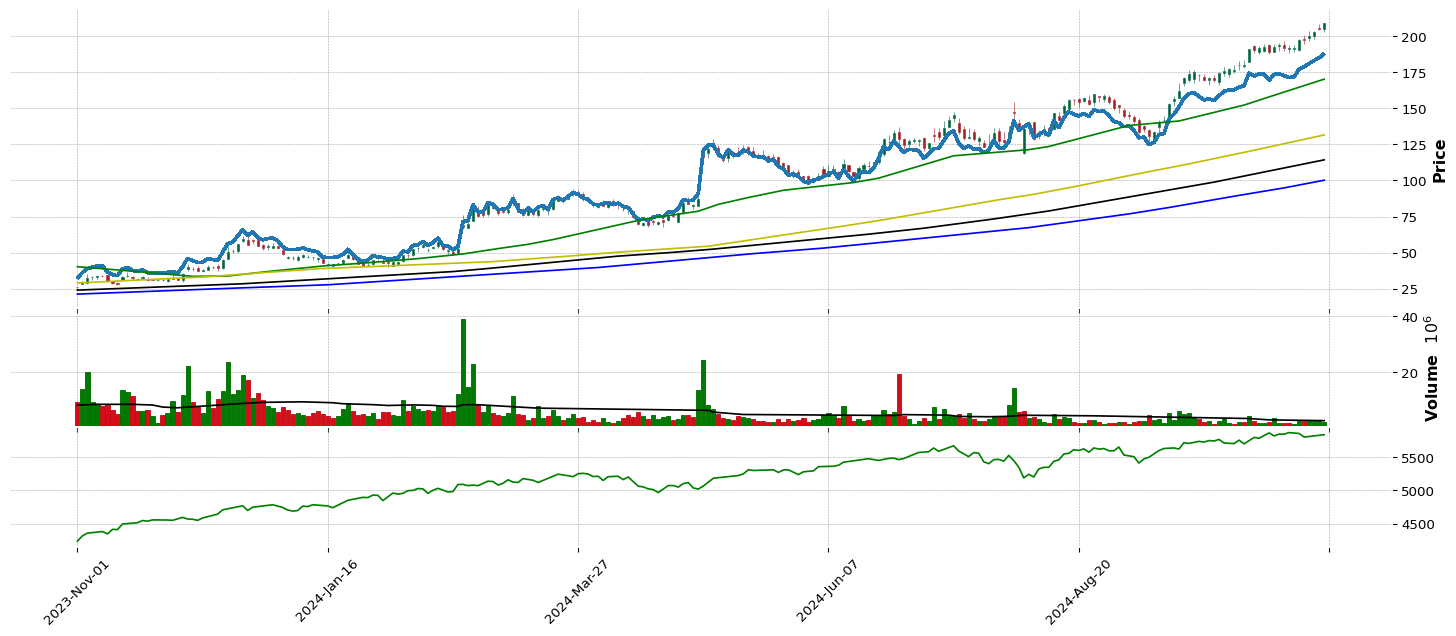
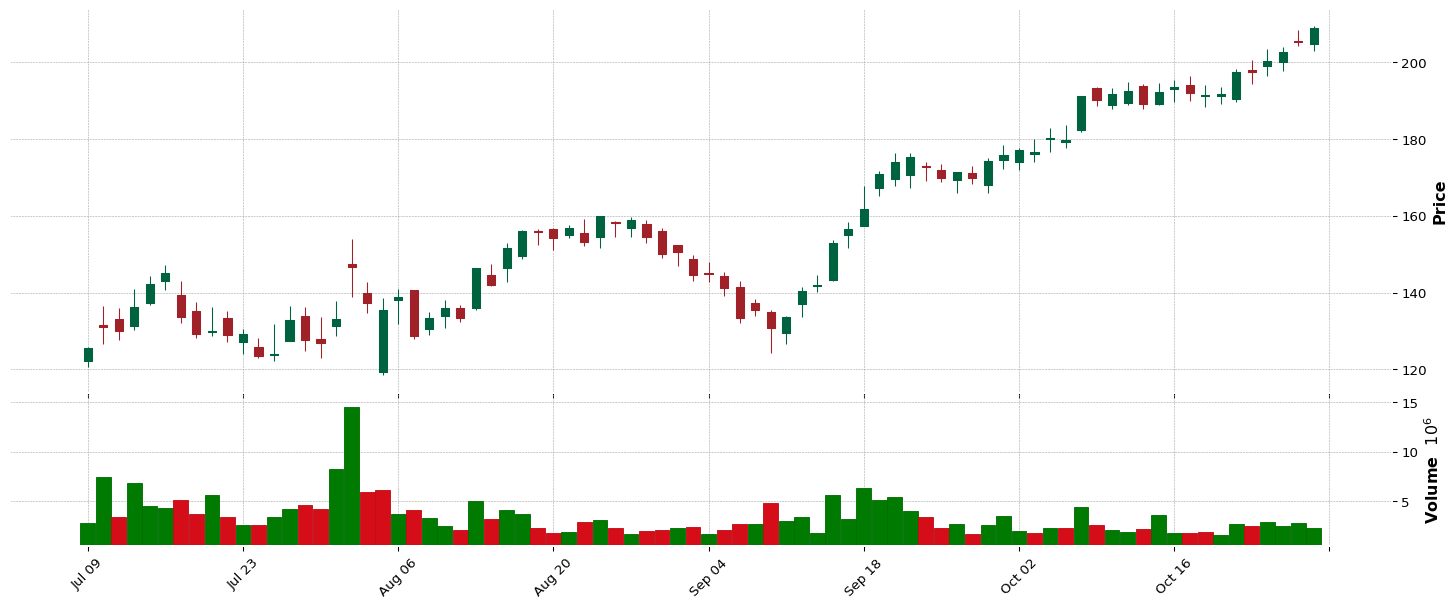
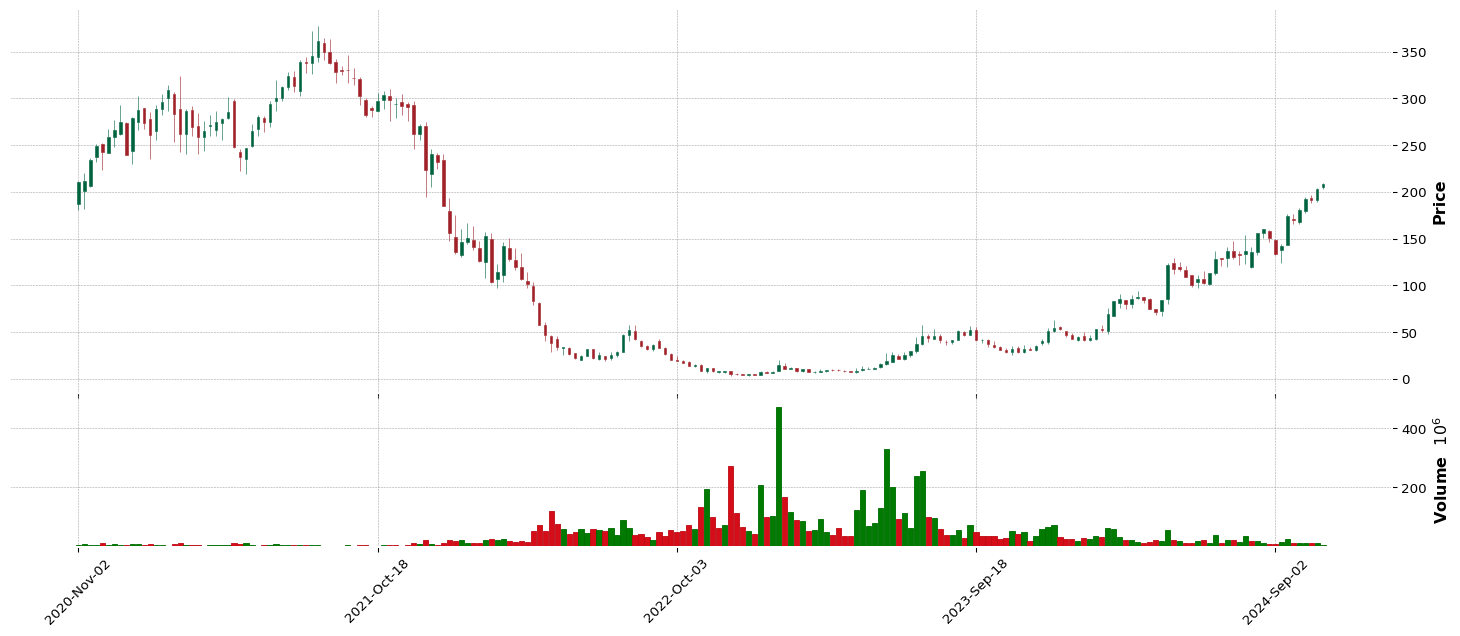
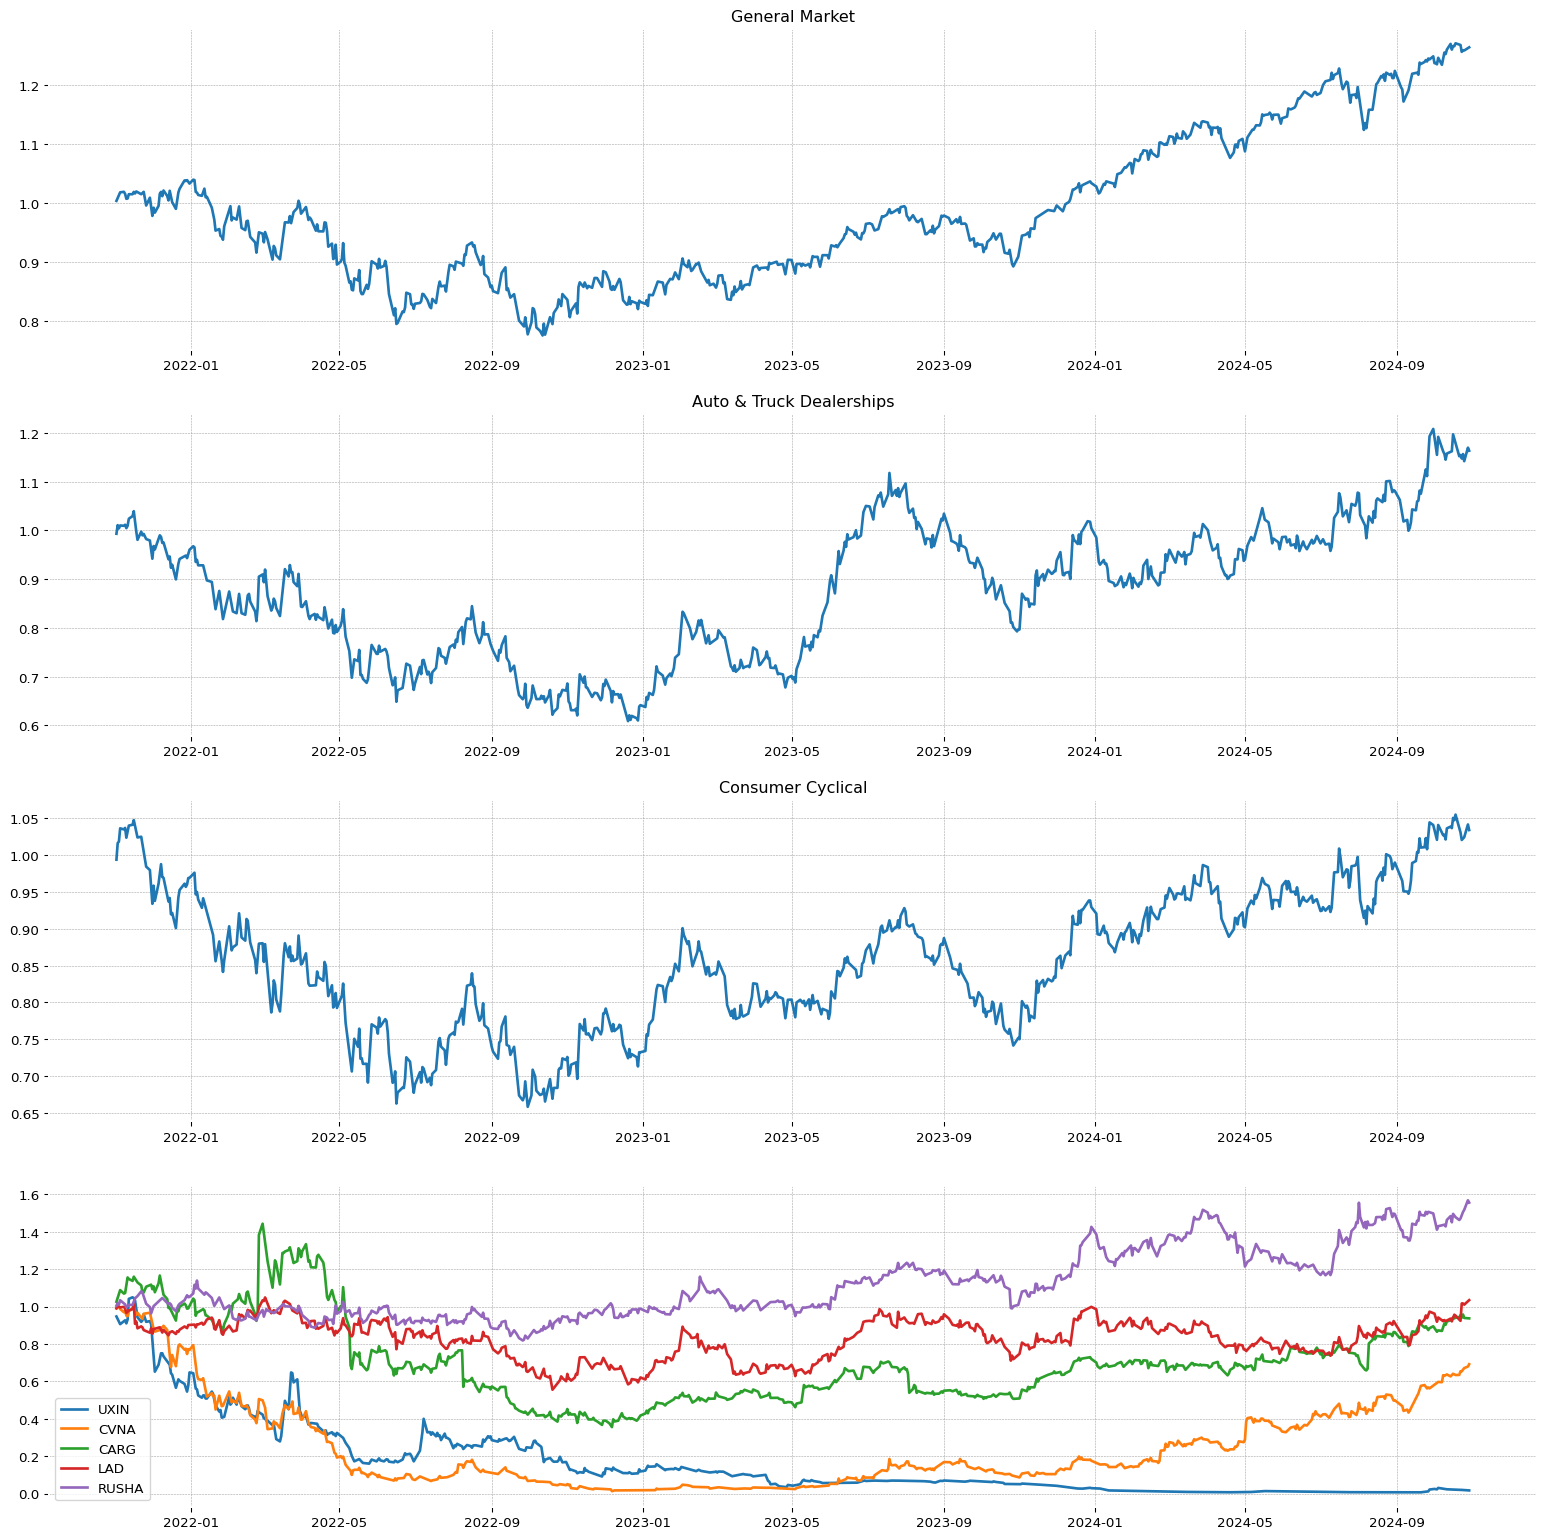 CAVA
CAVA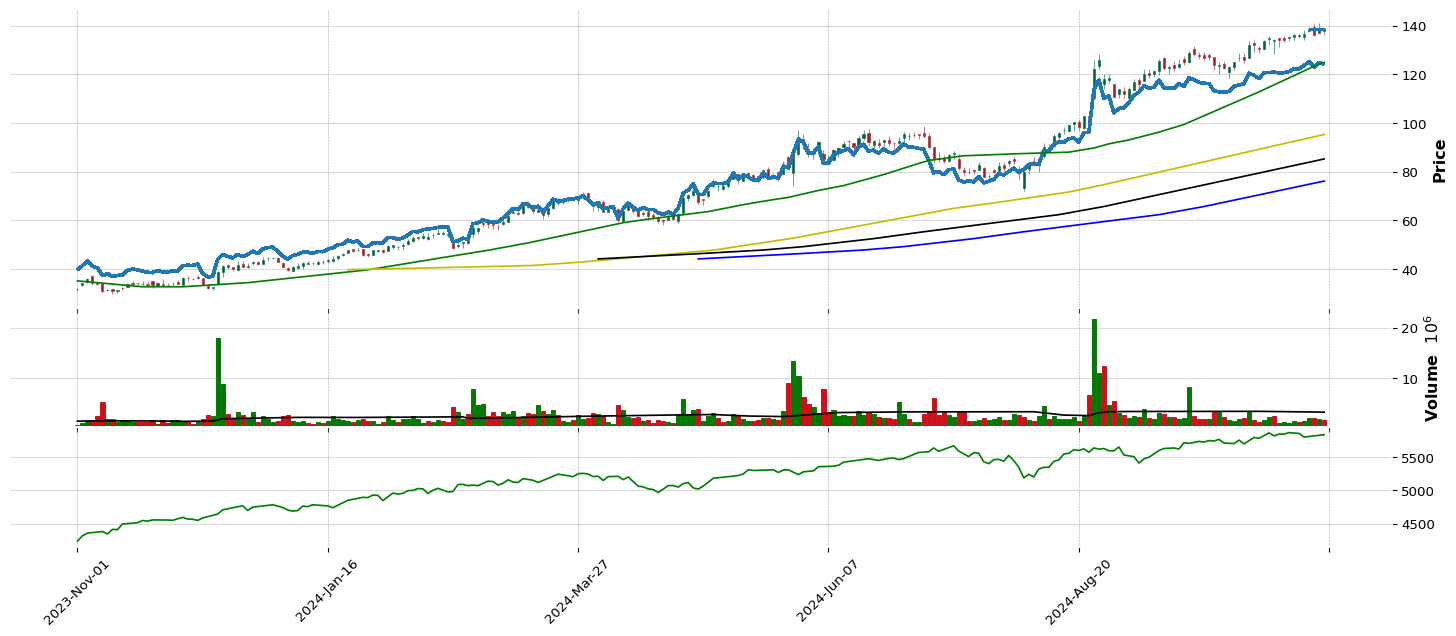
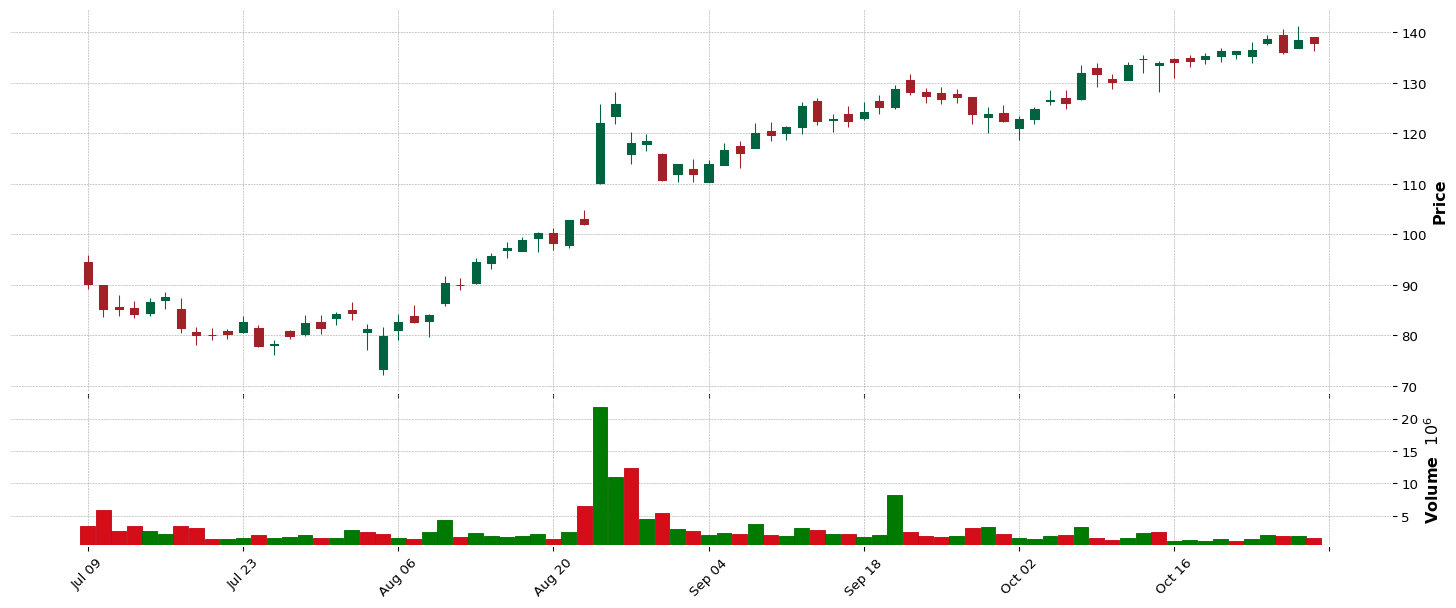
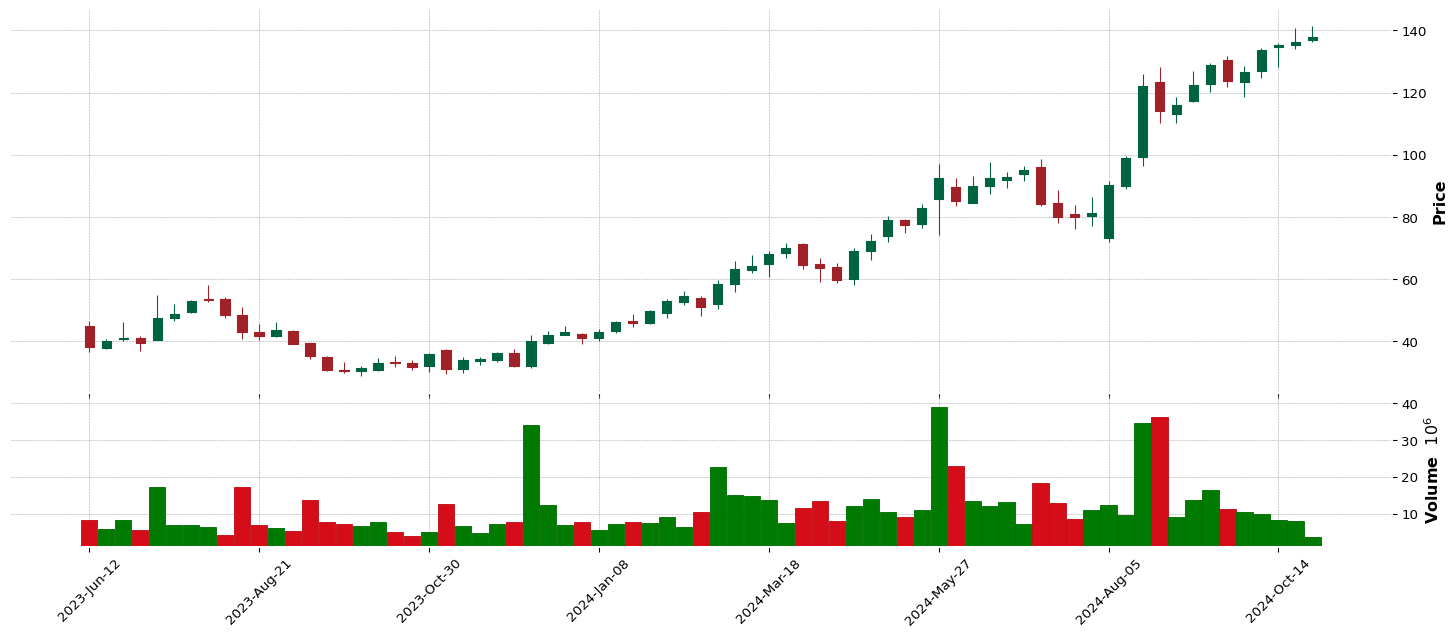
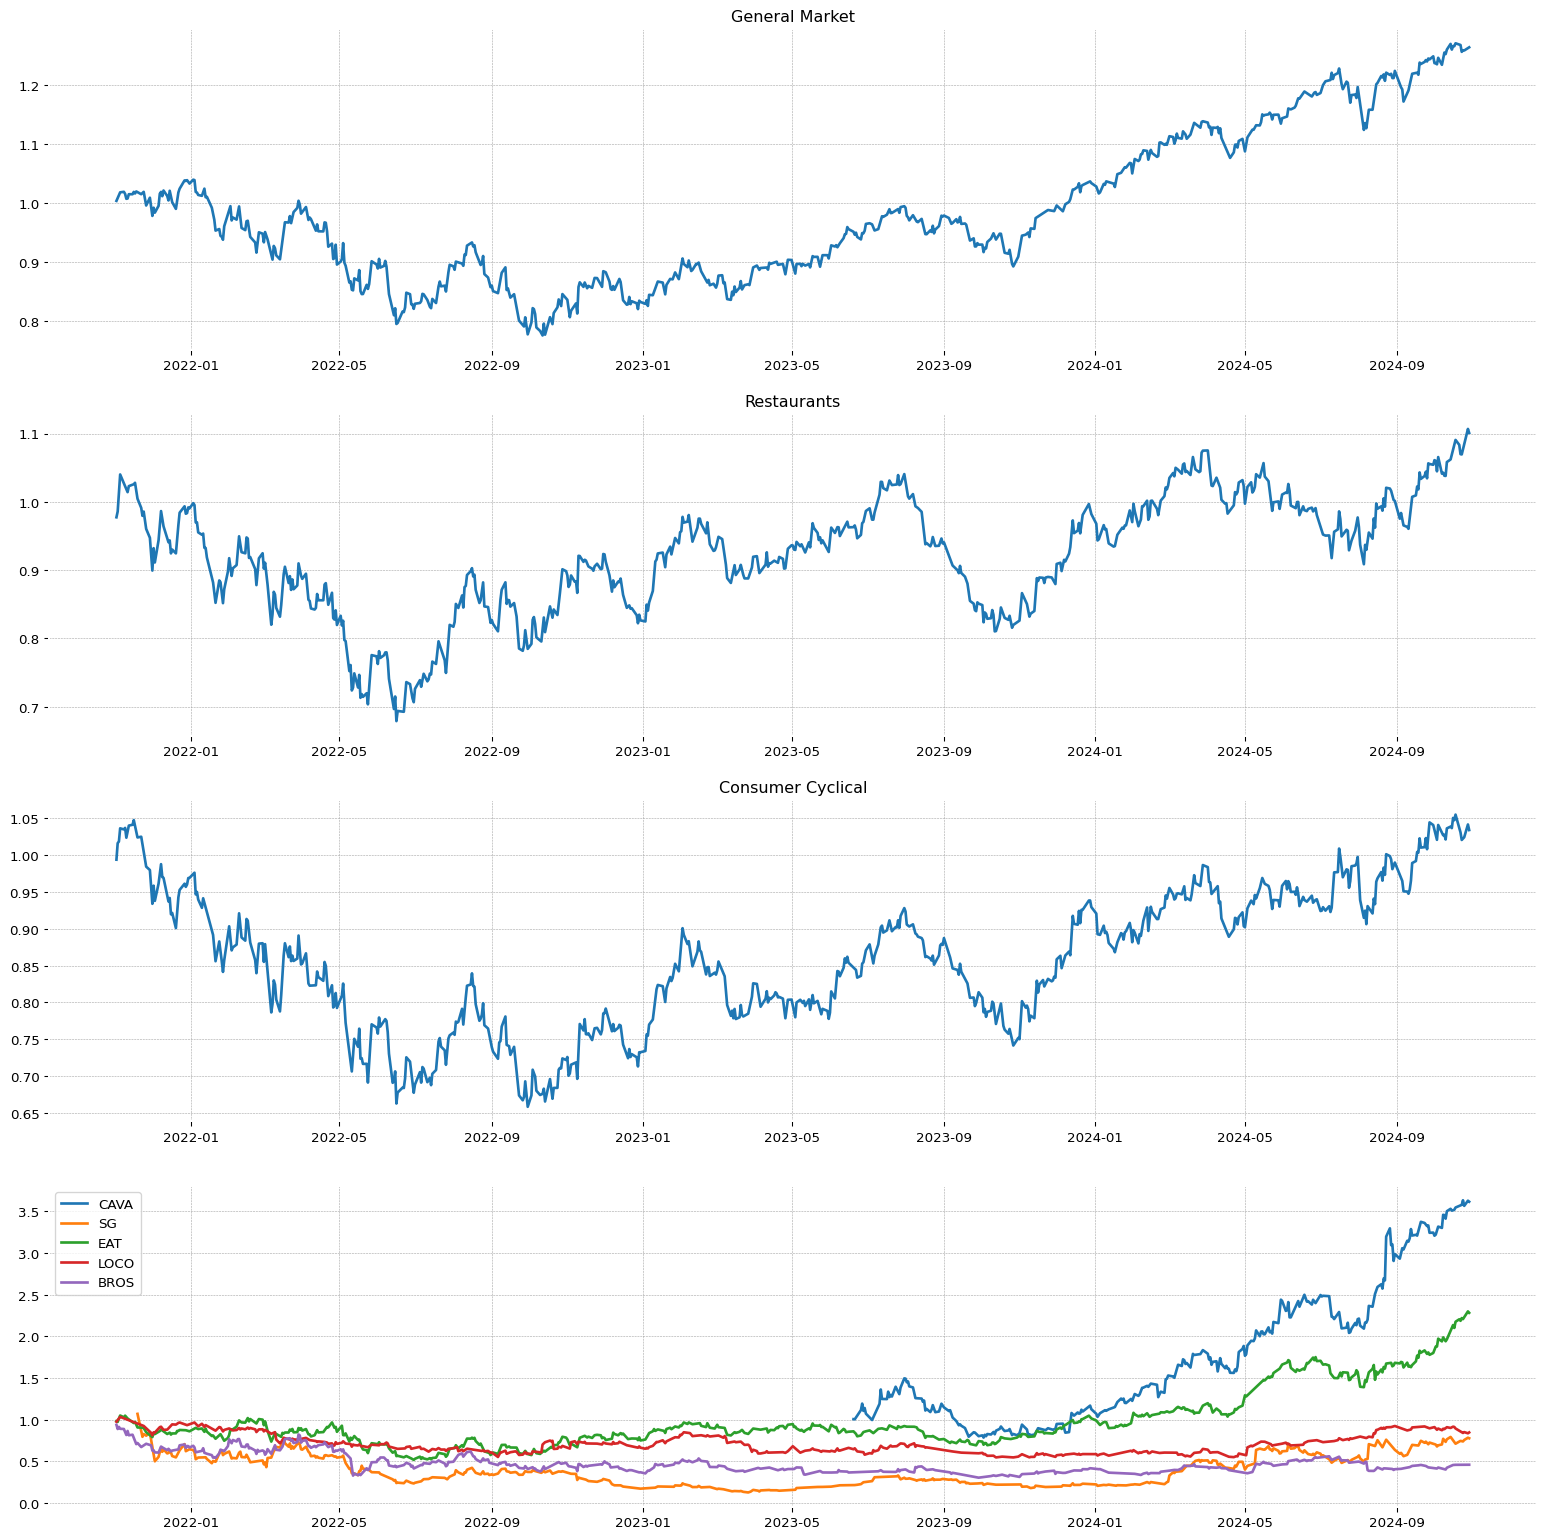 GDS
GDS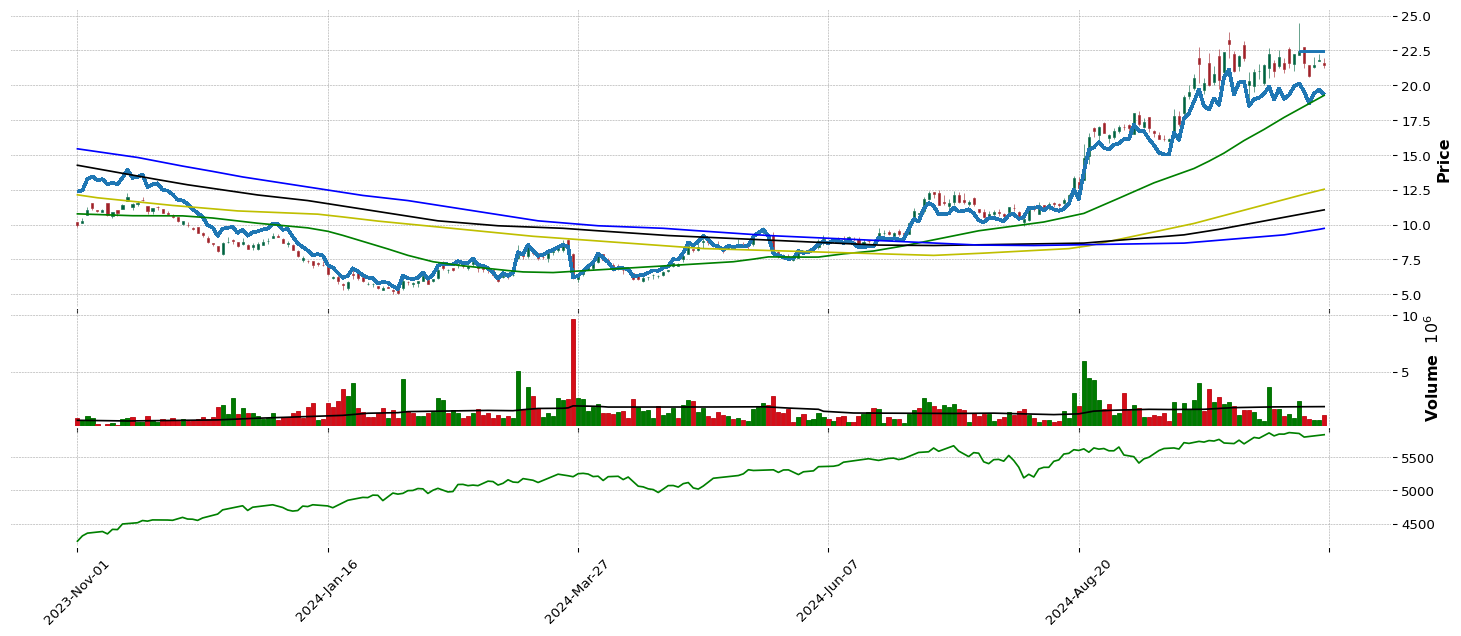
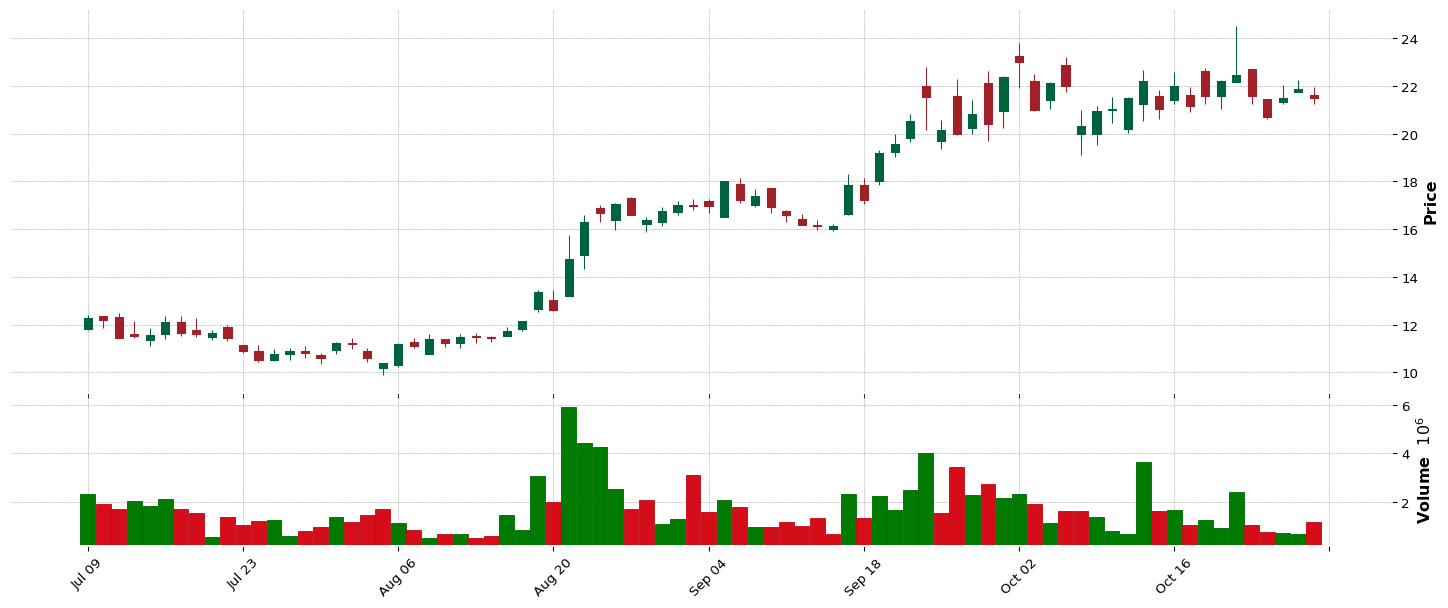
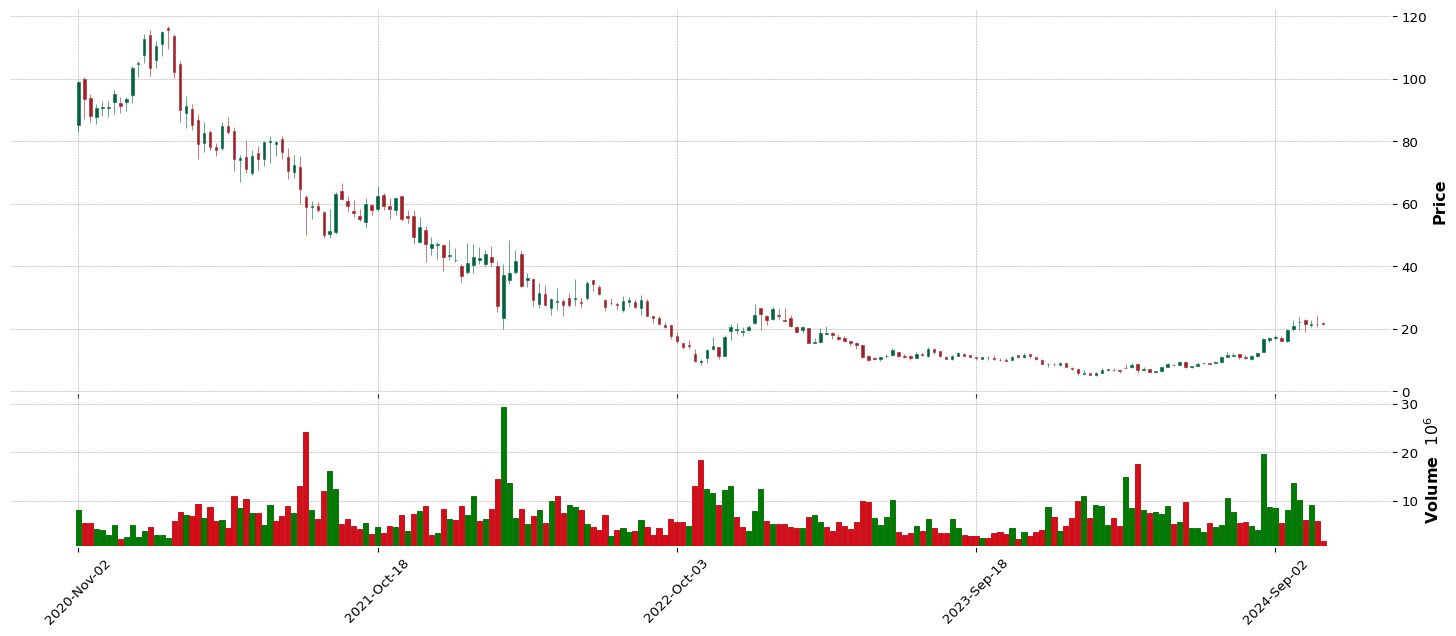
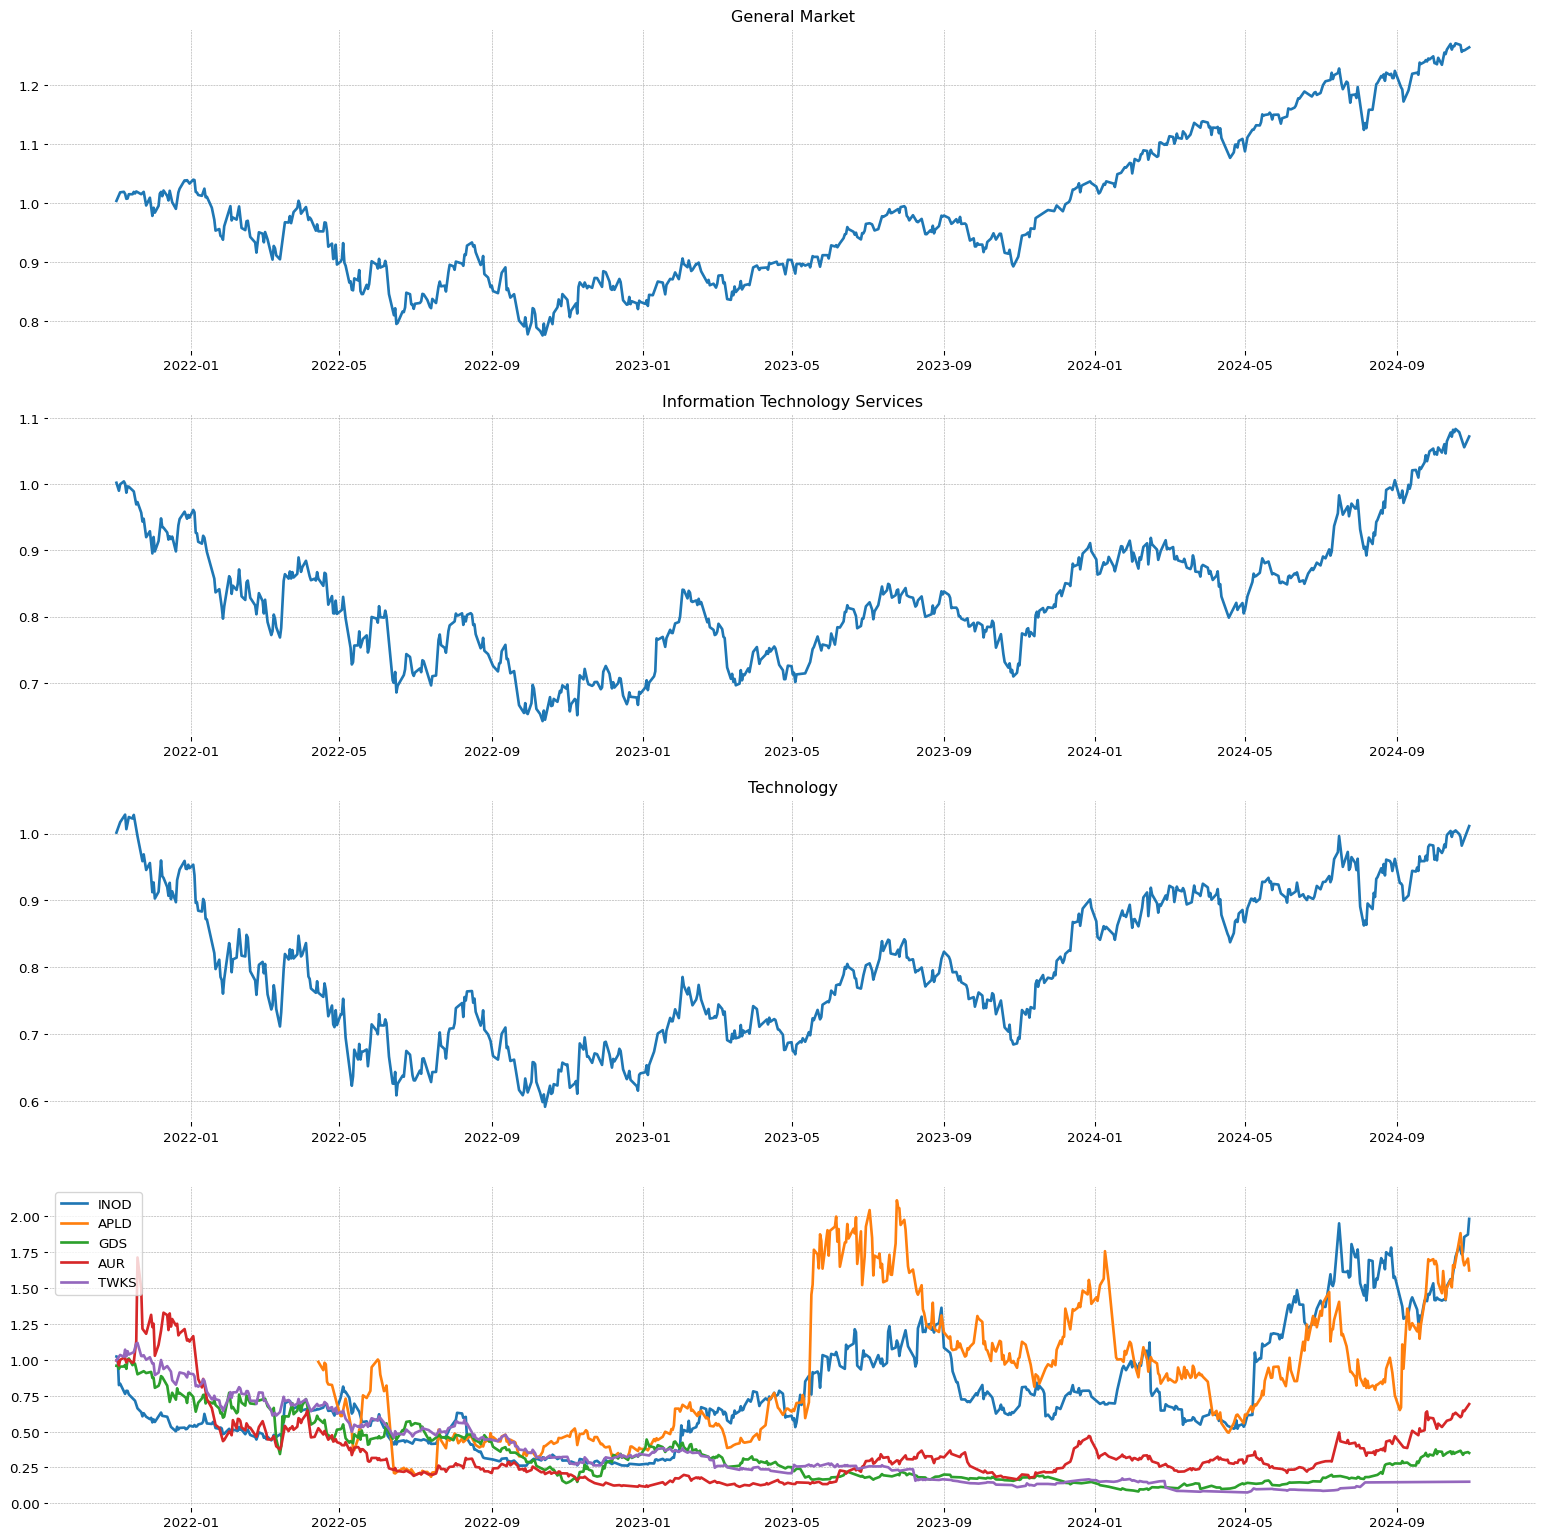 LENZ
LENZ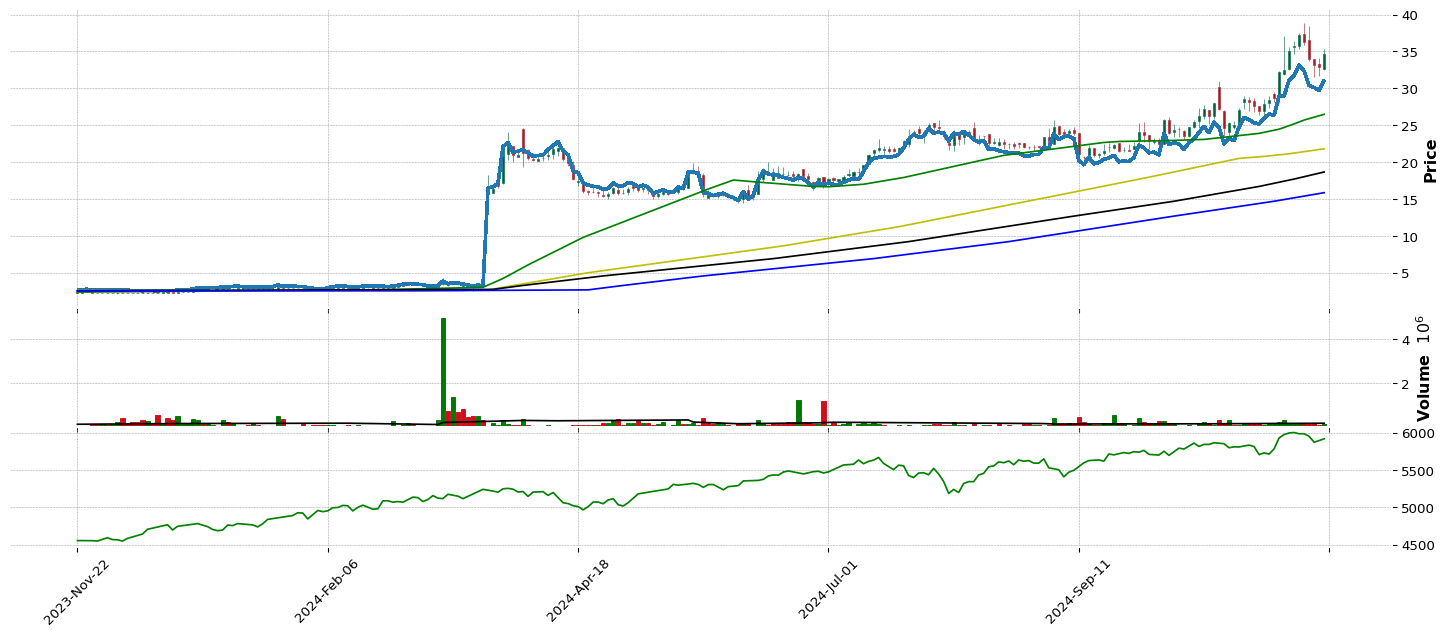
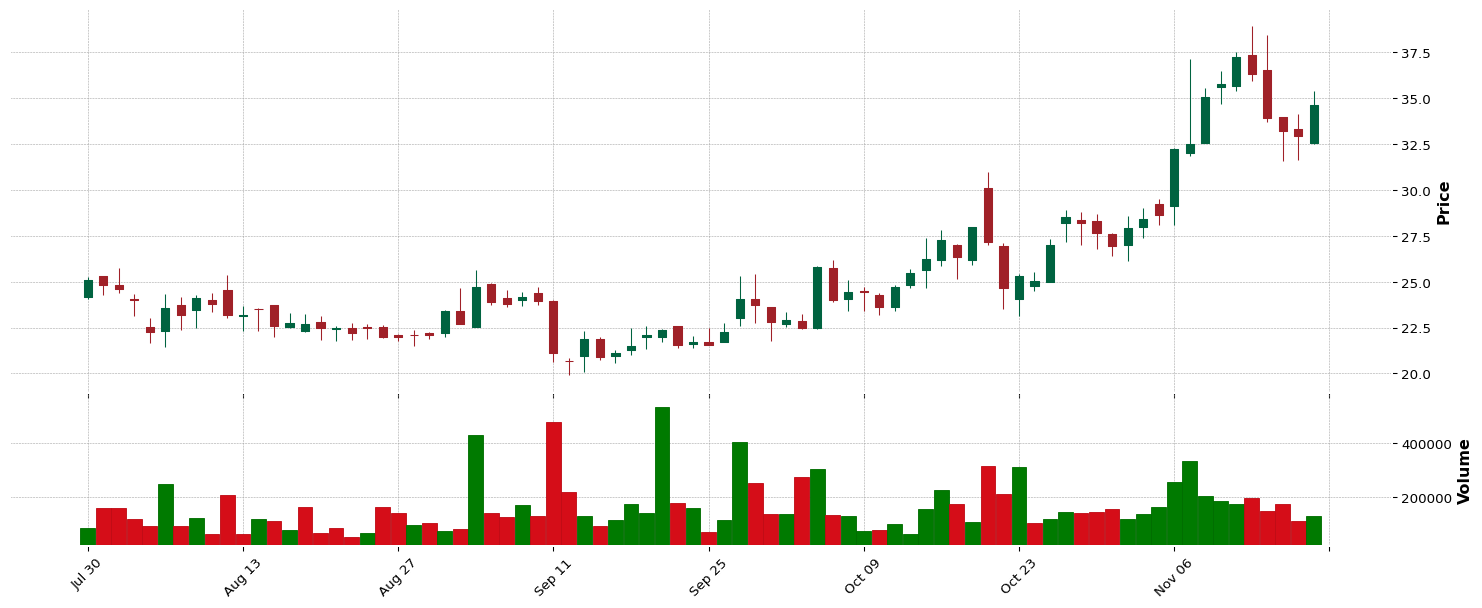
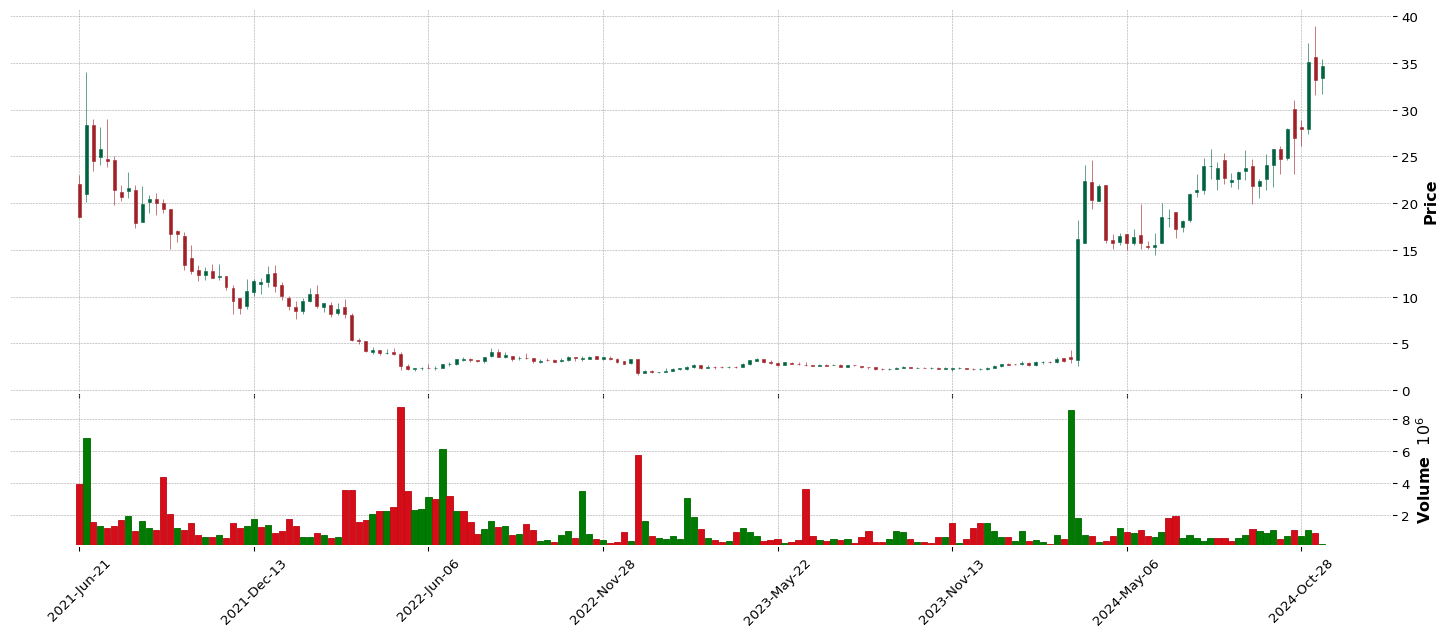
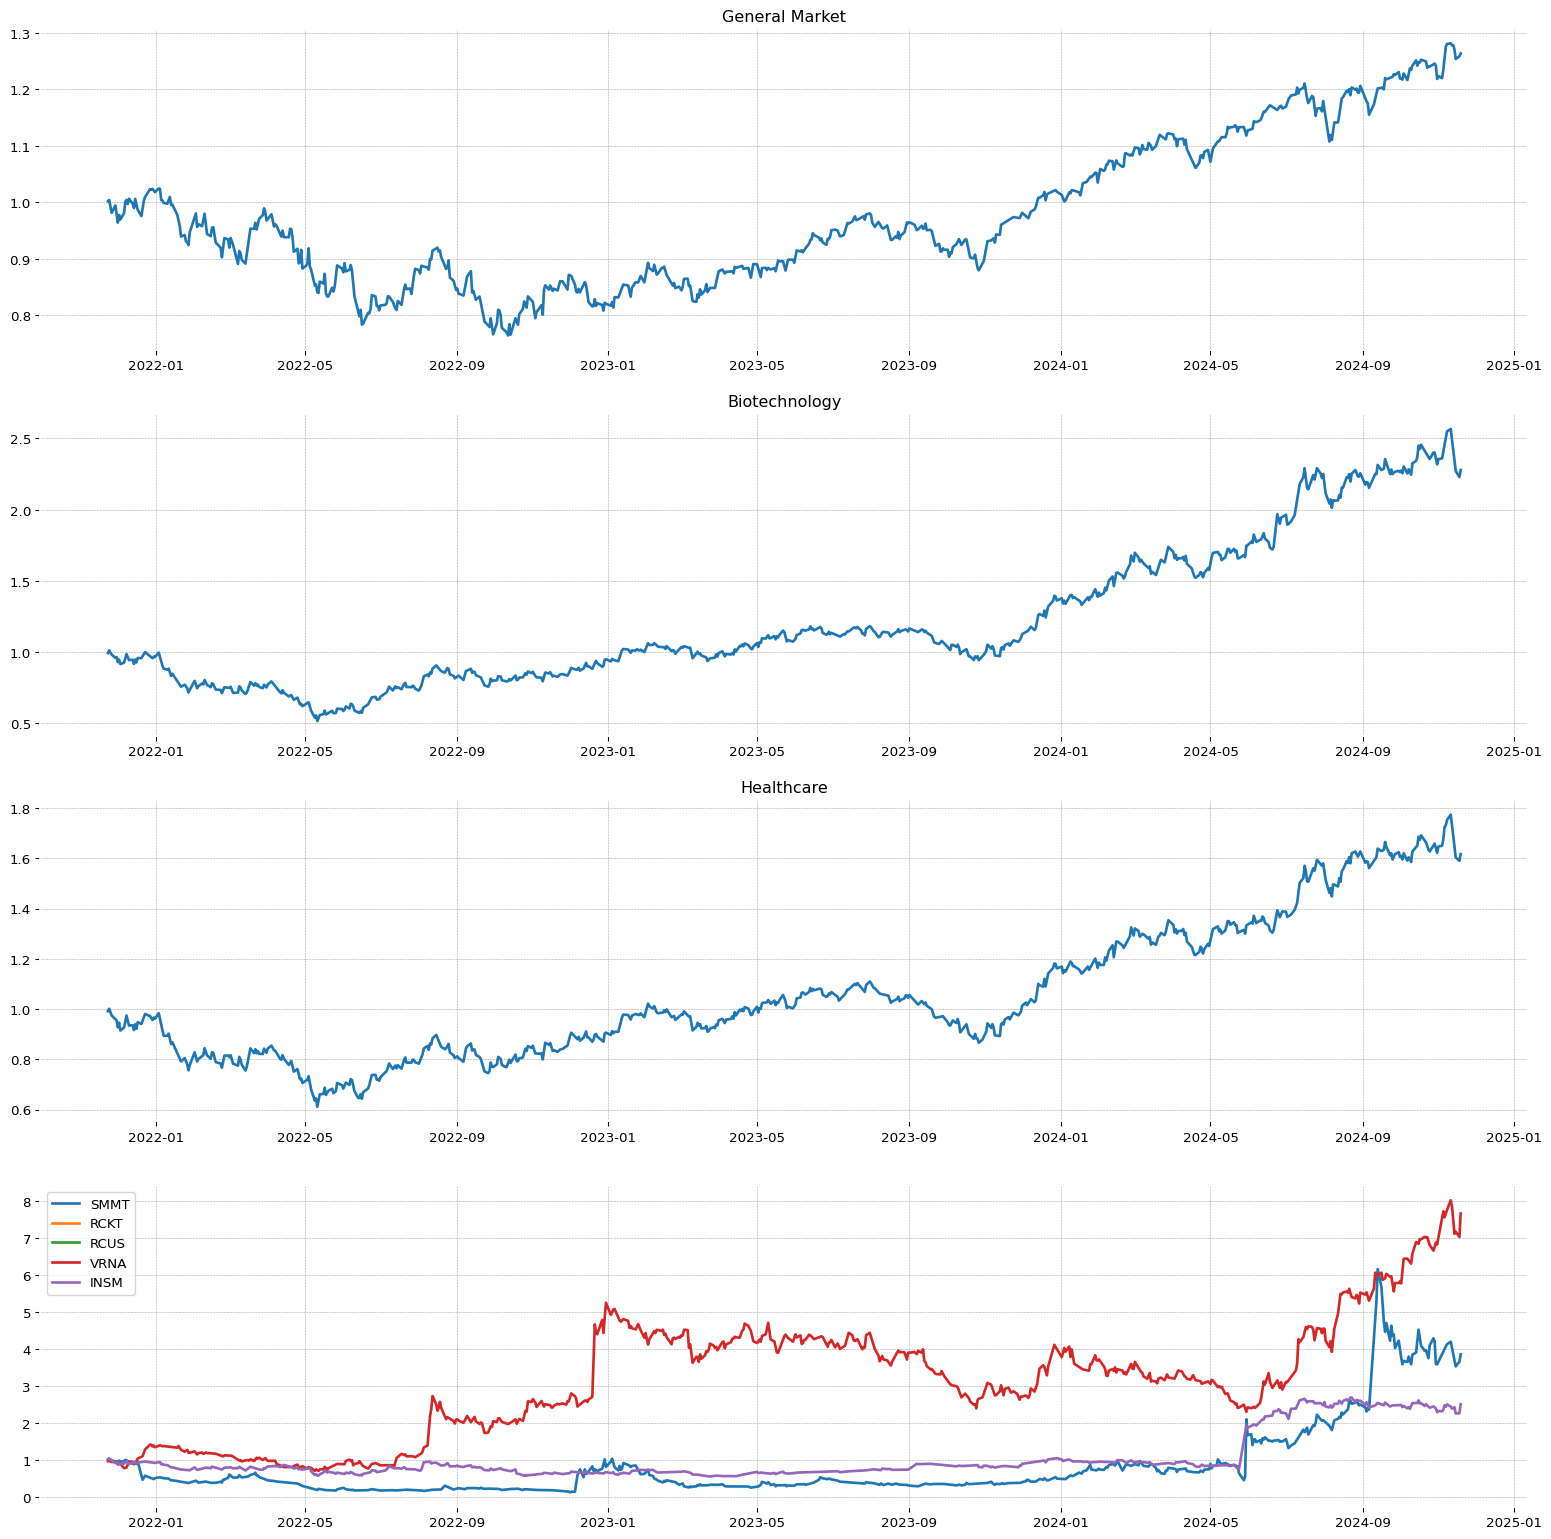 WGS
WGS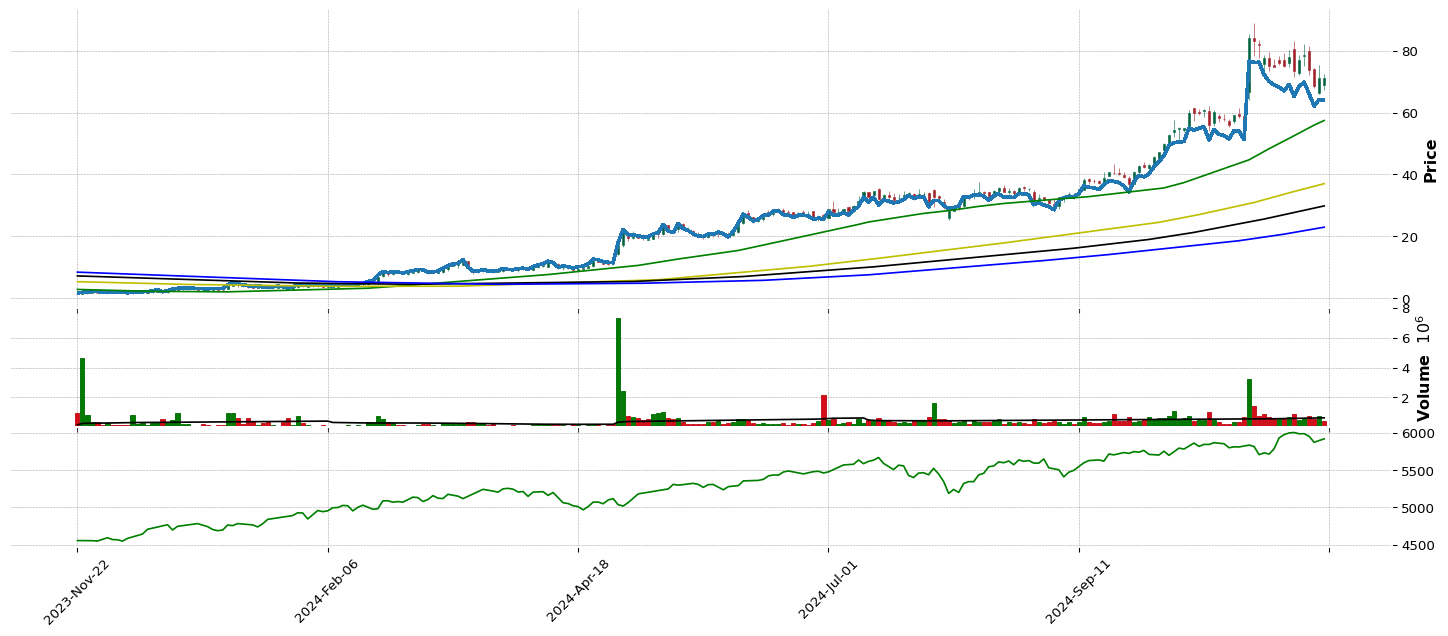
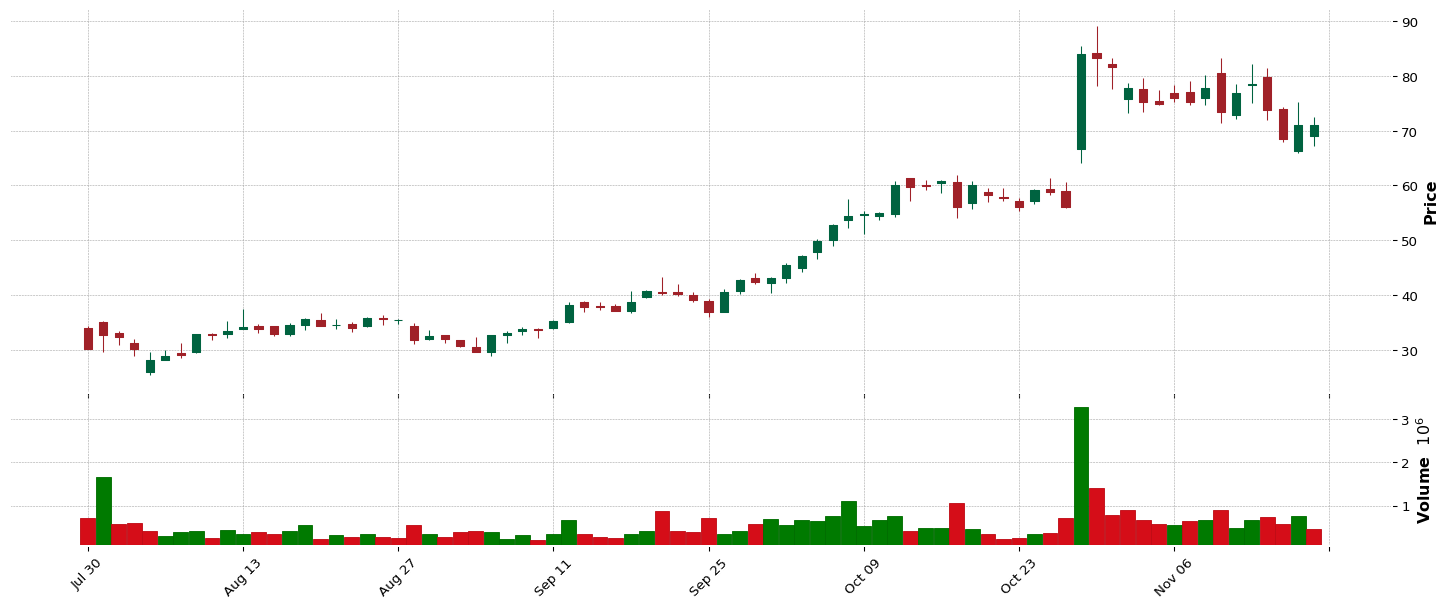
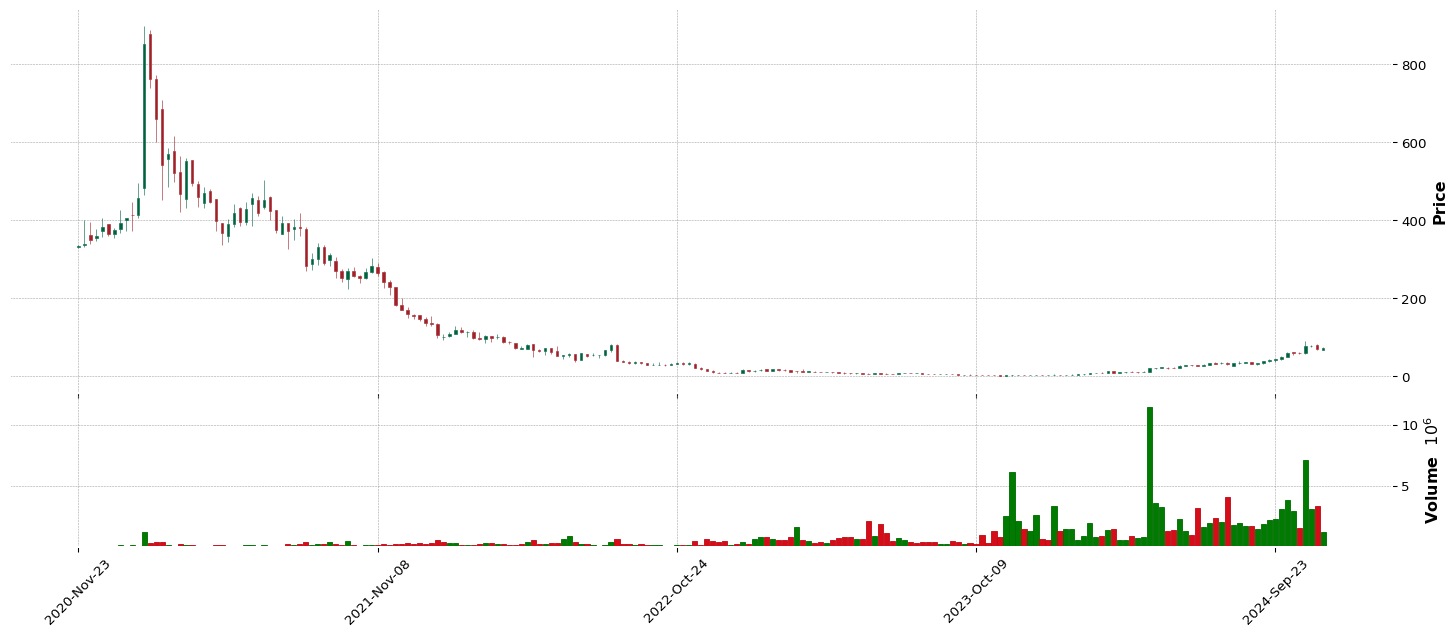
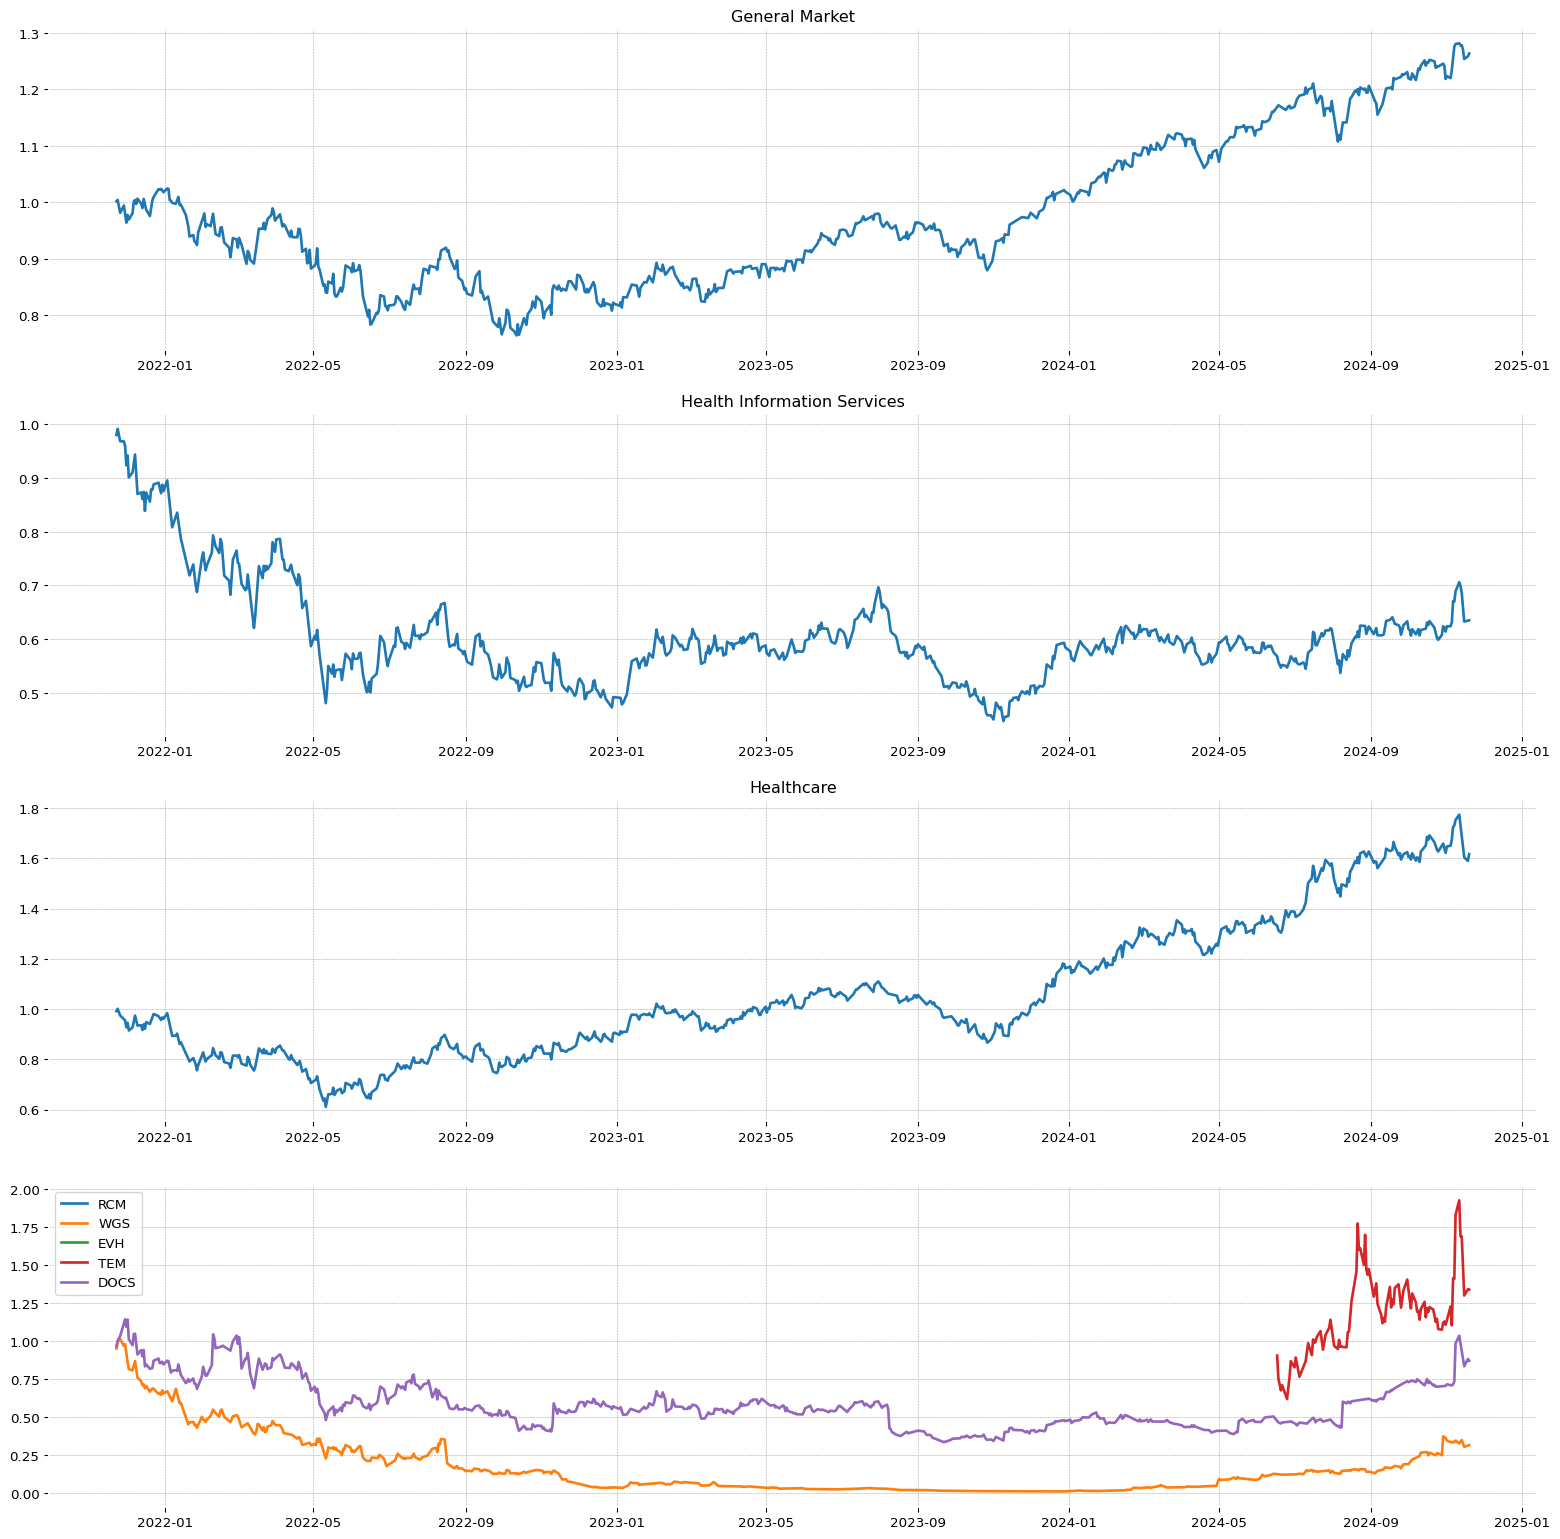 HBB
HBB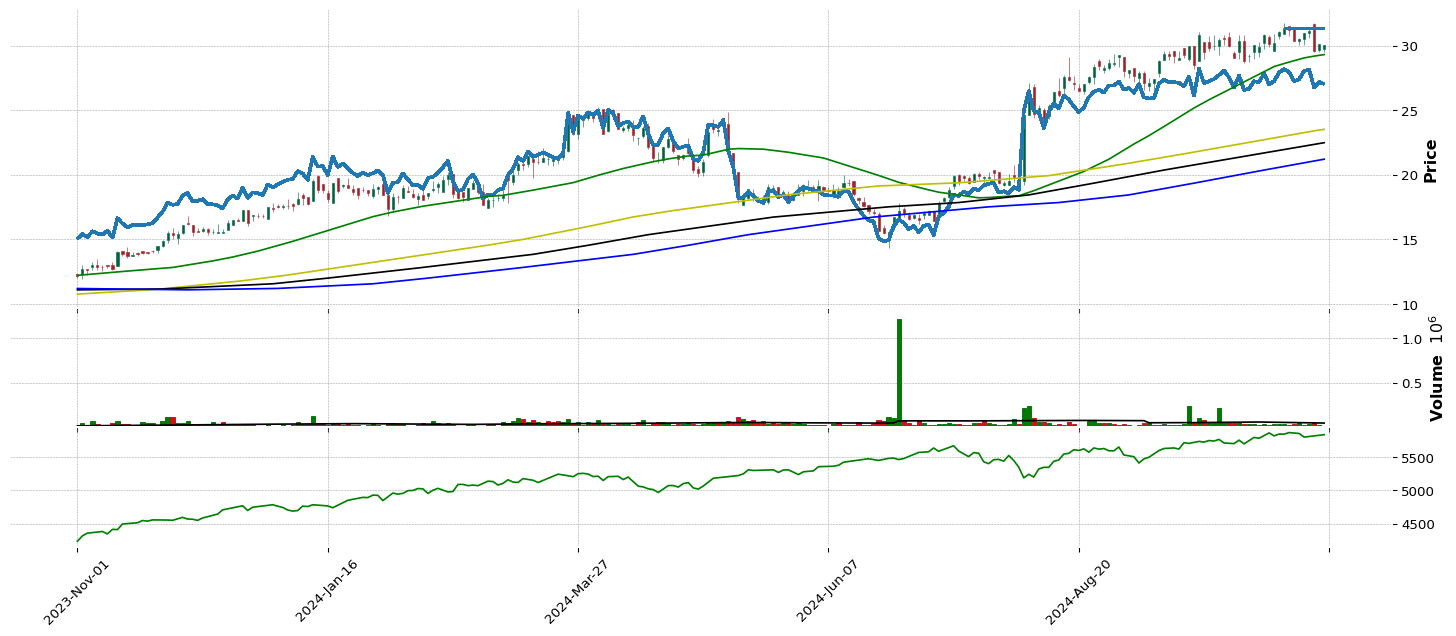
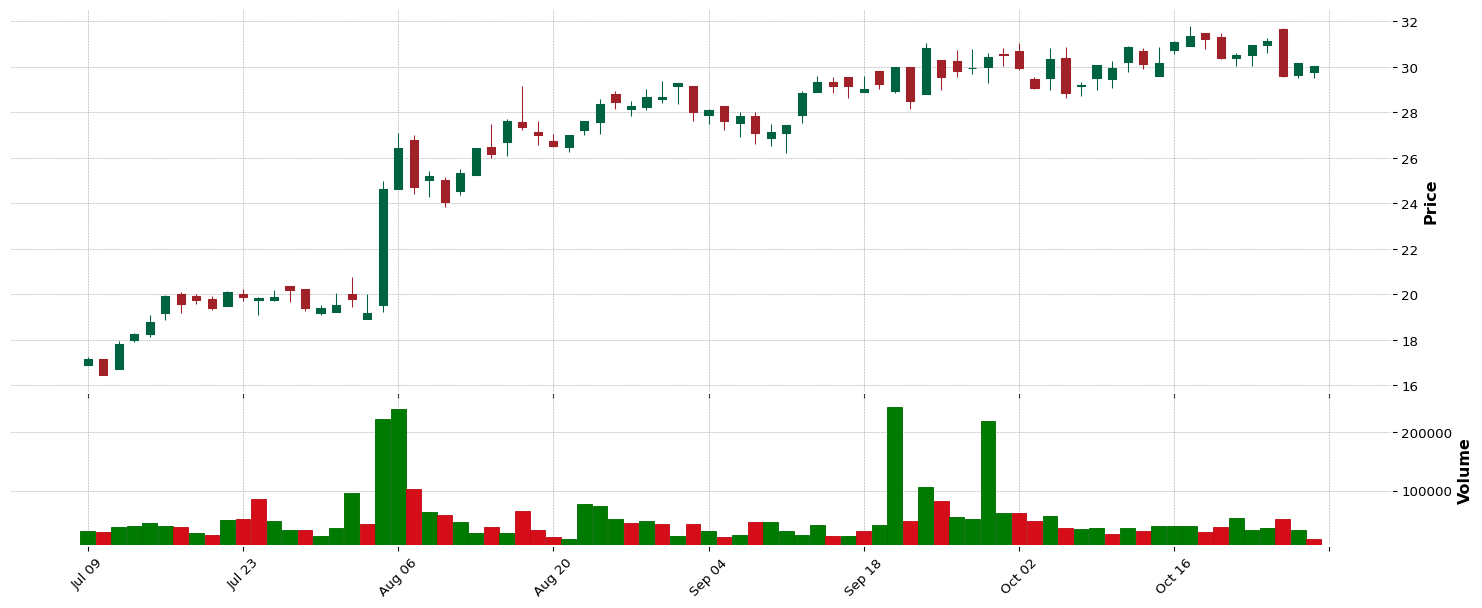
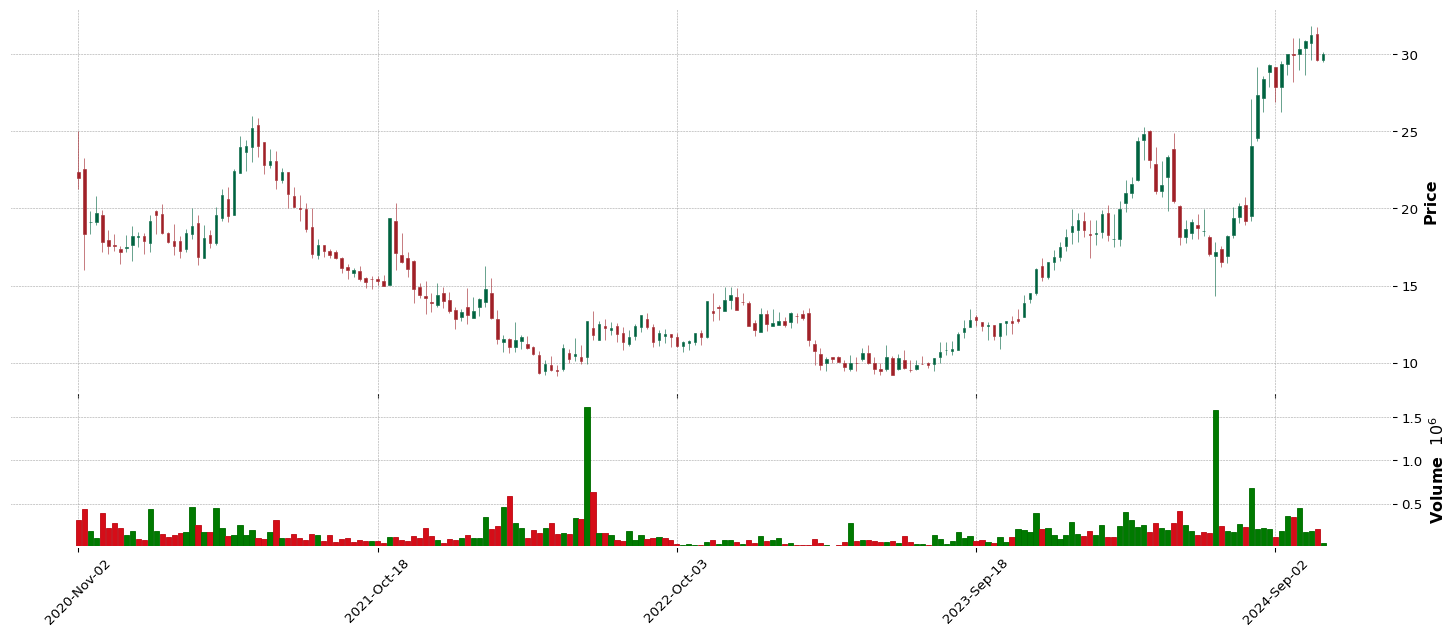
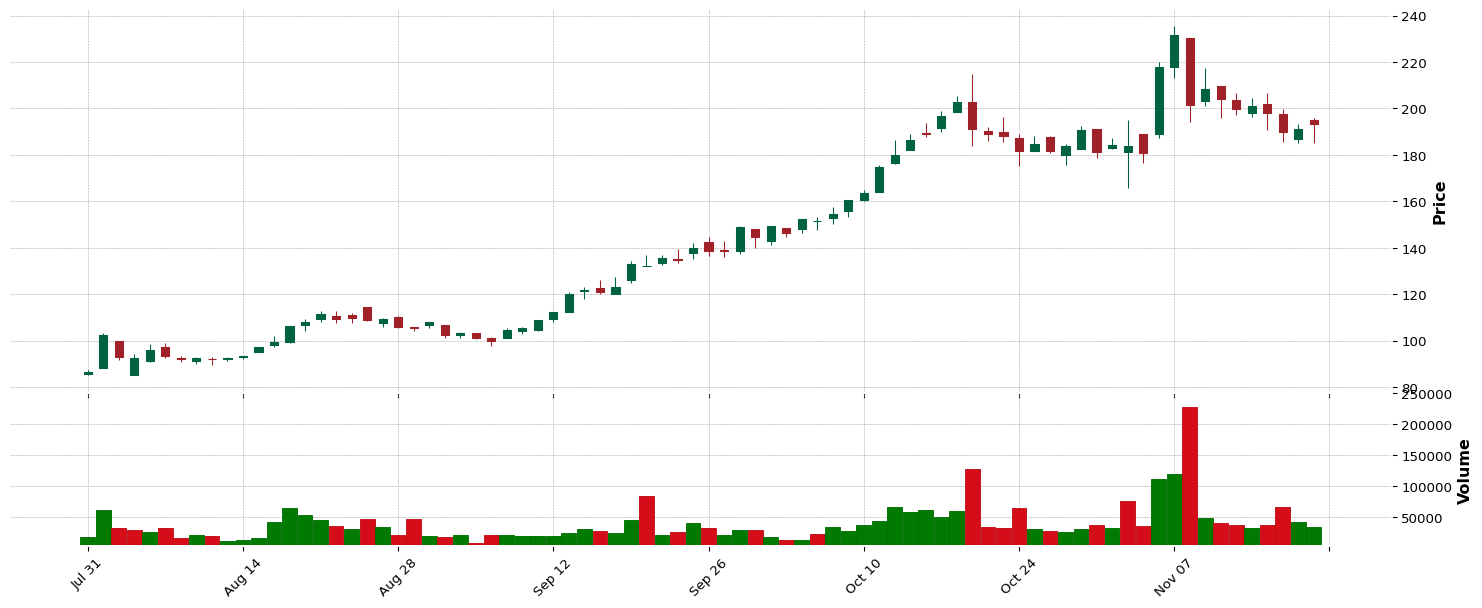
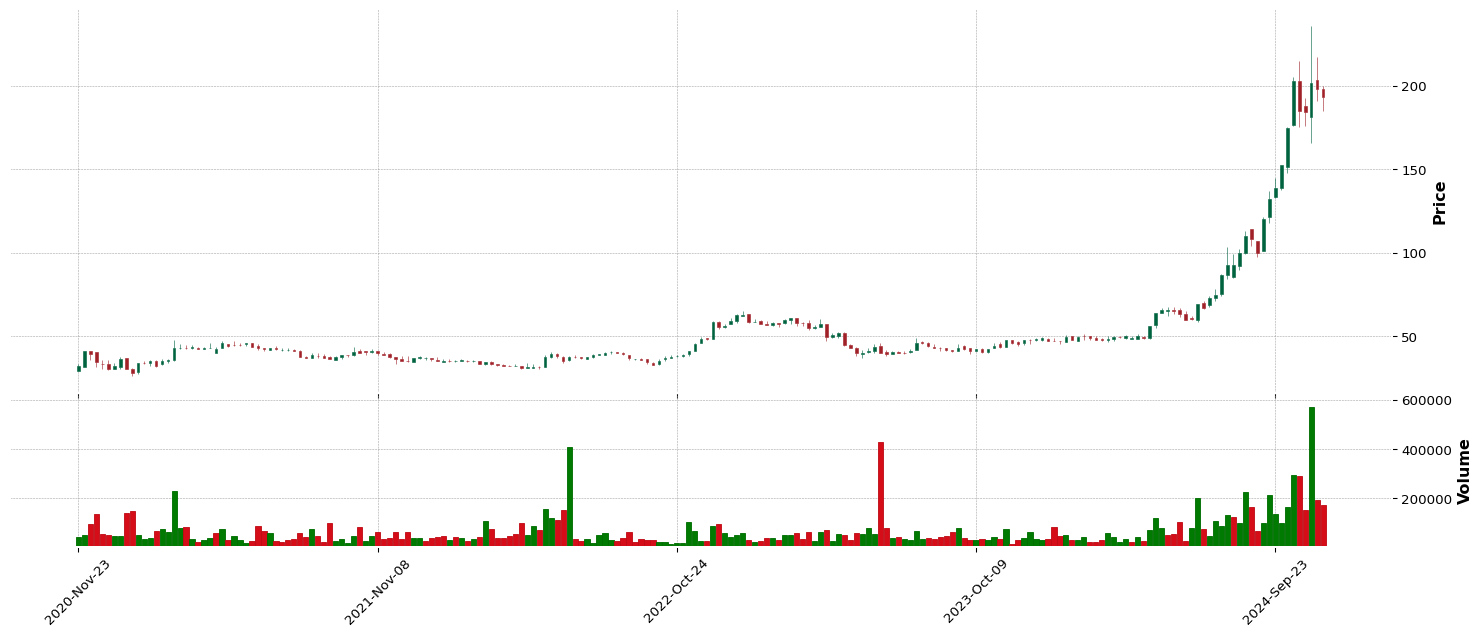
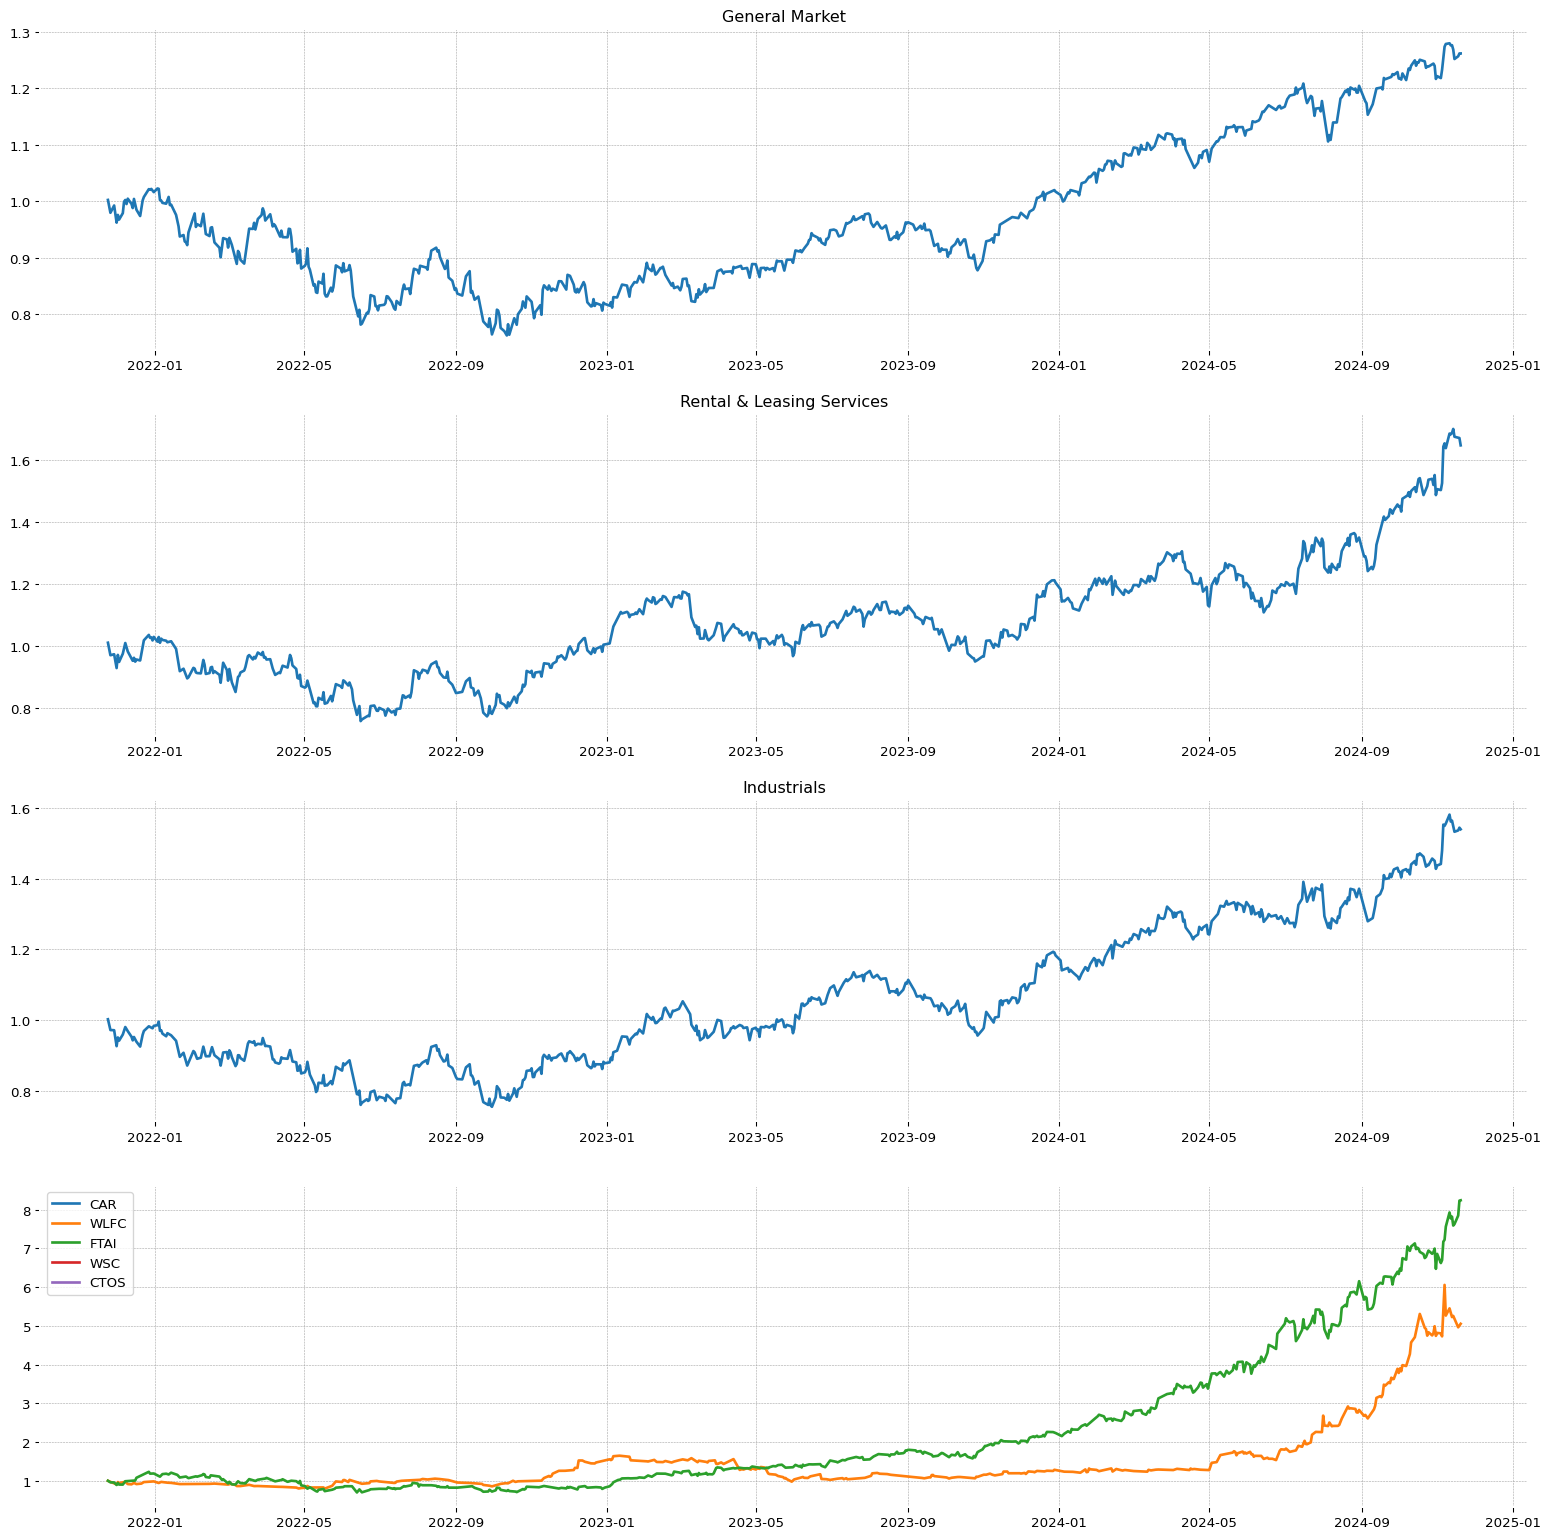
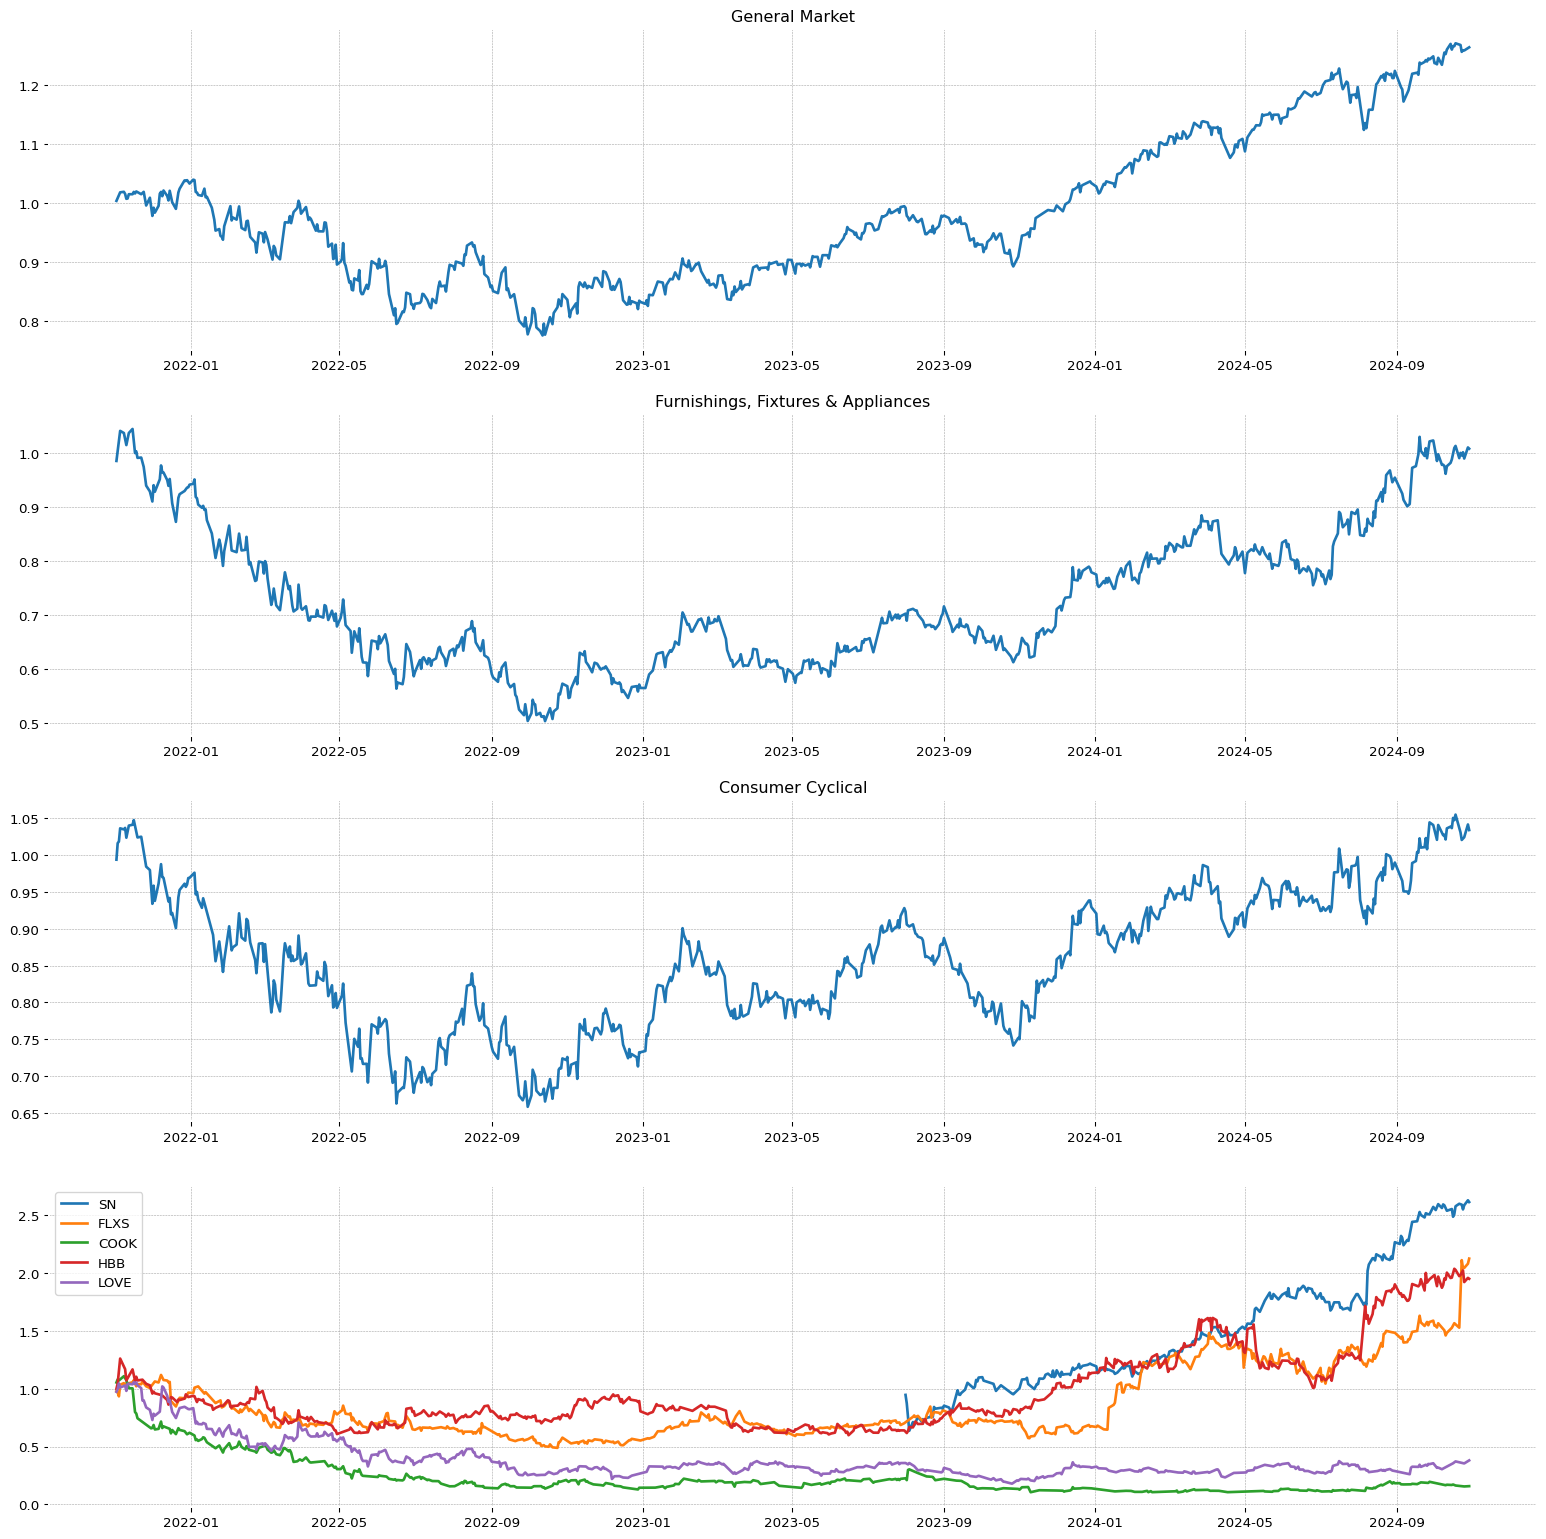 WLFC
WLFC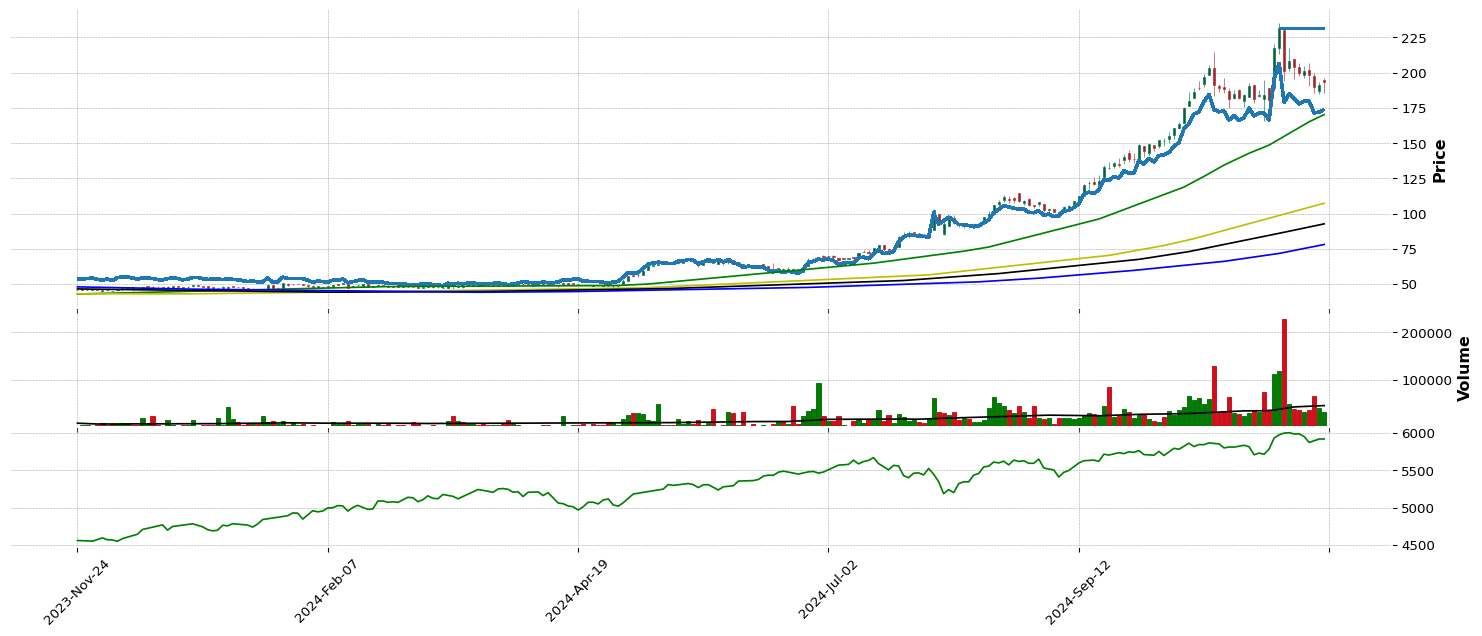
 VHI
VHI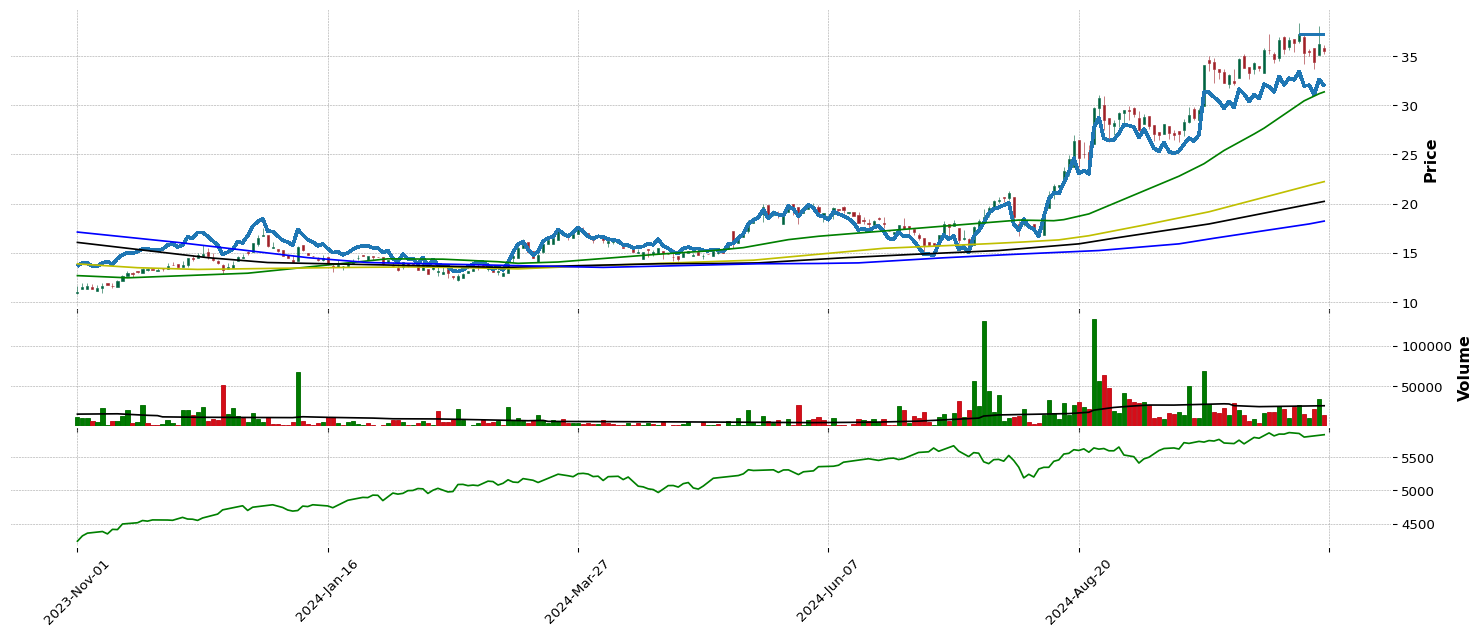
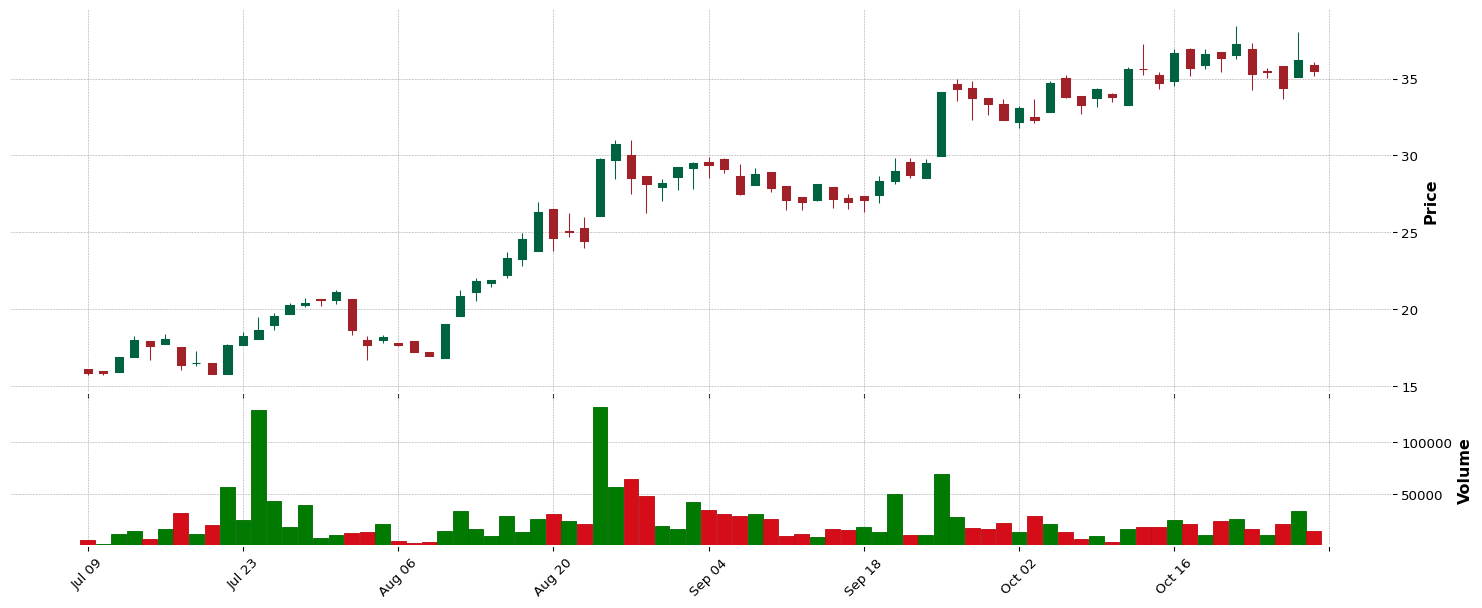
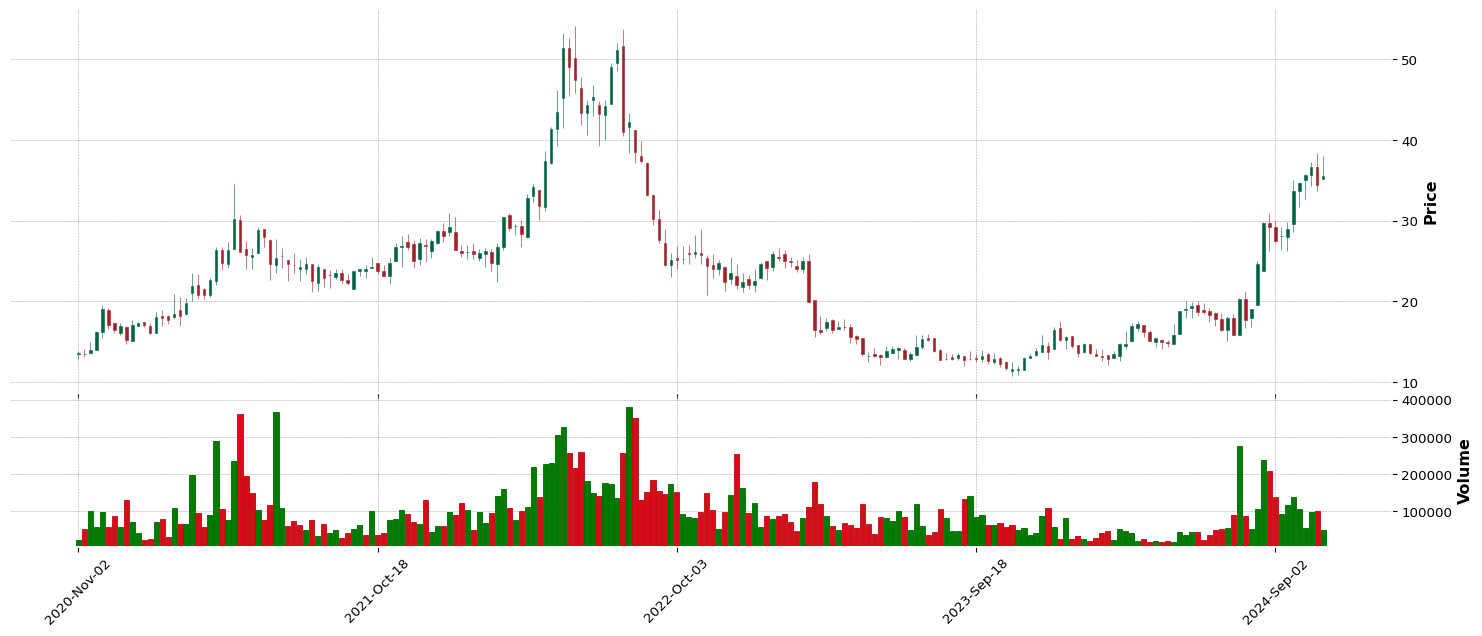
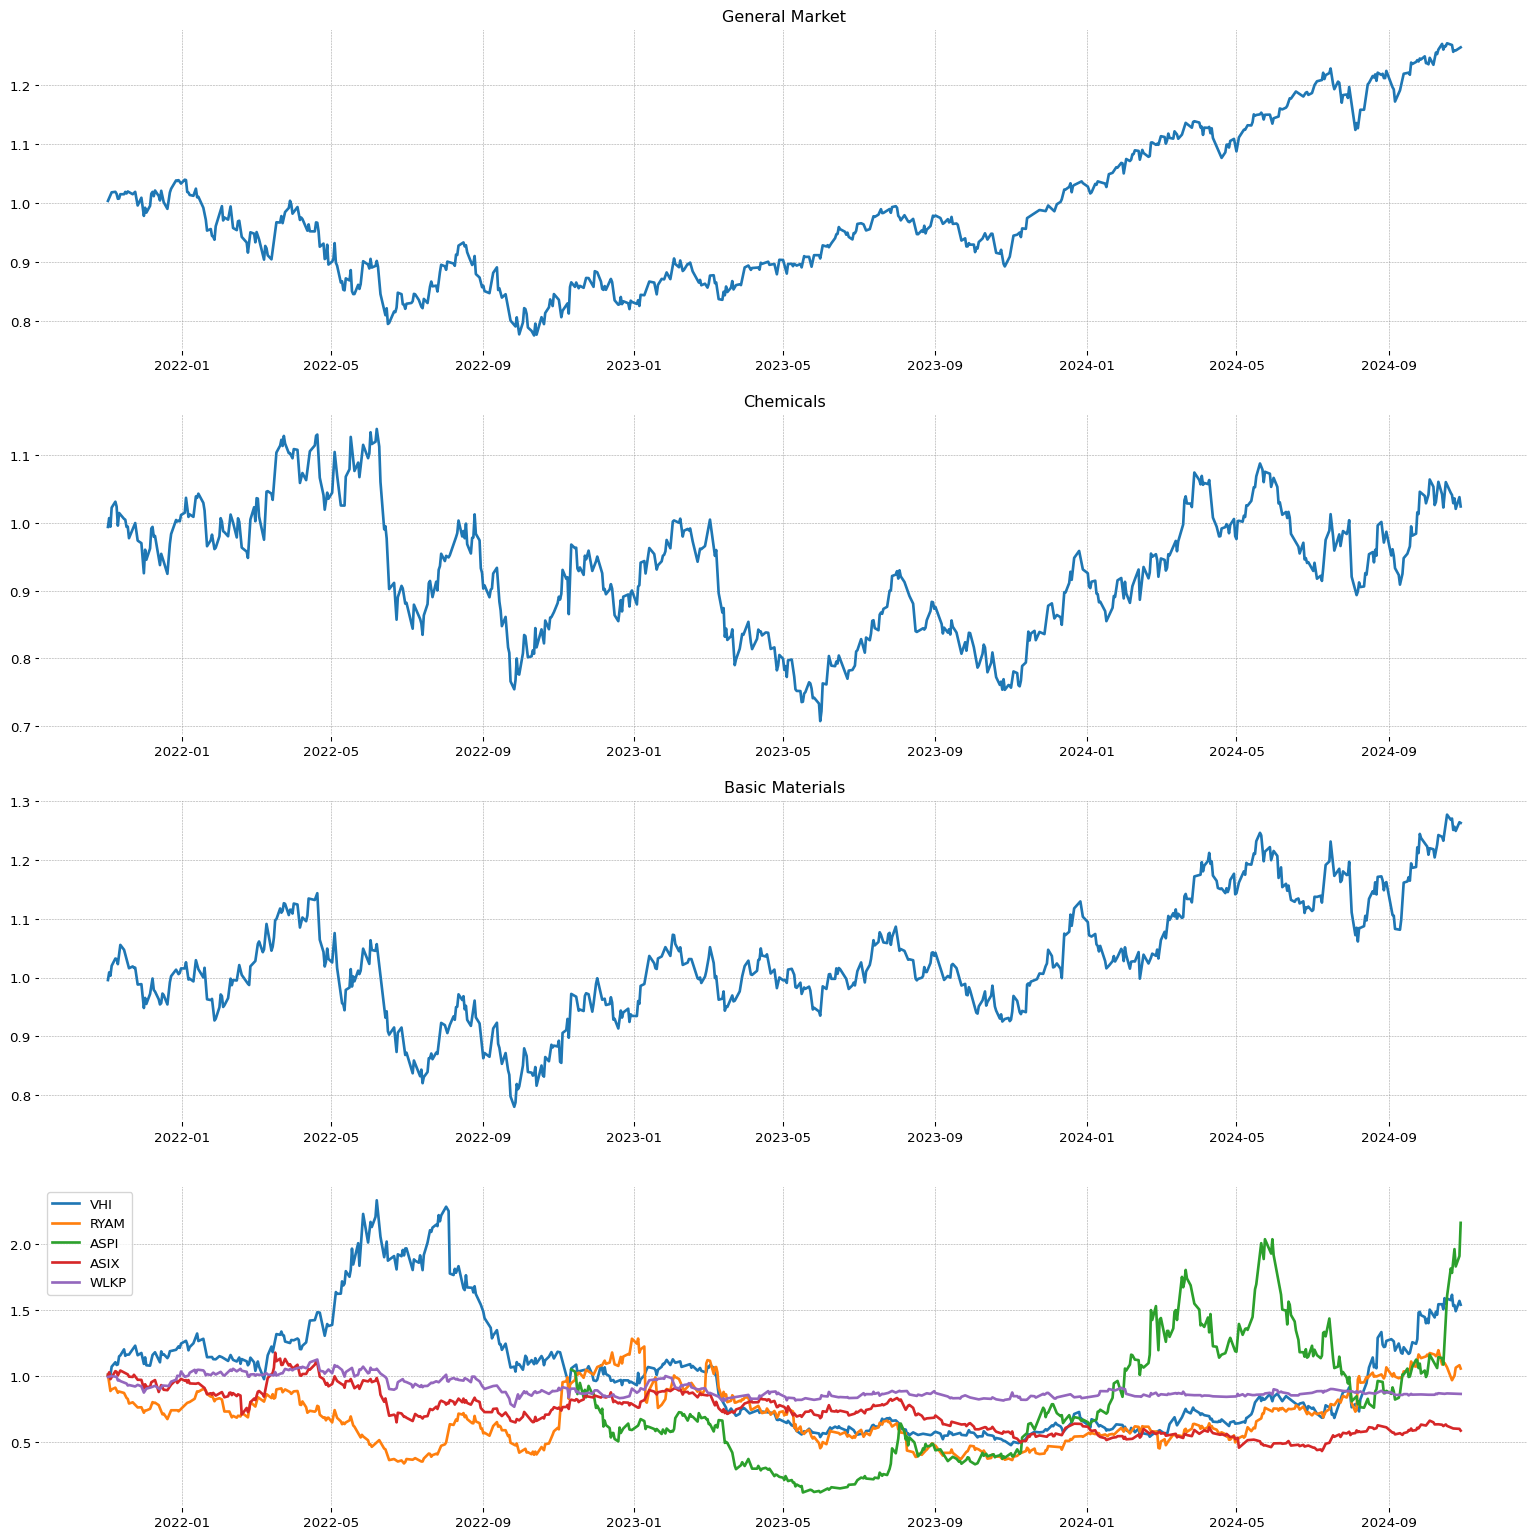 LTH
LTH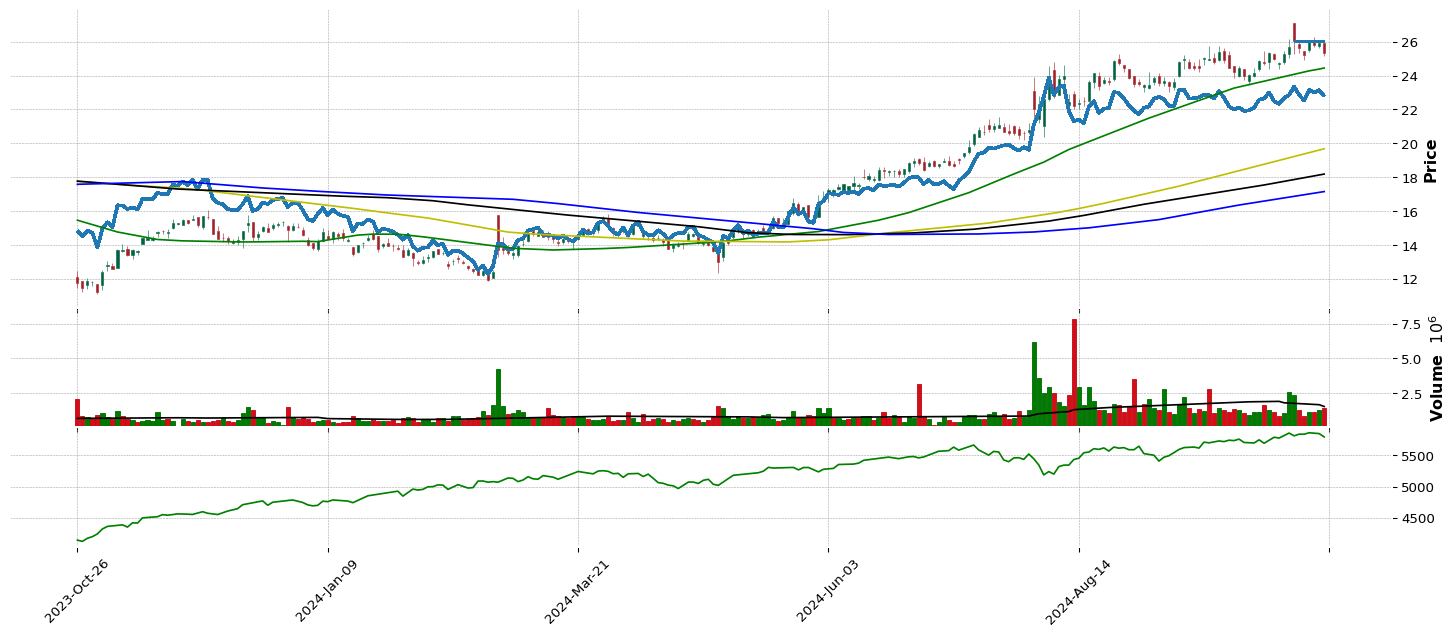
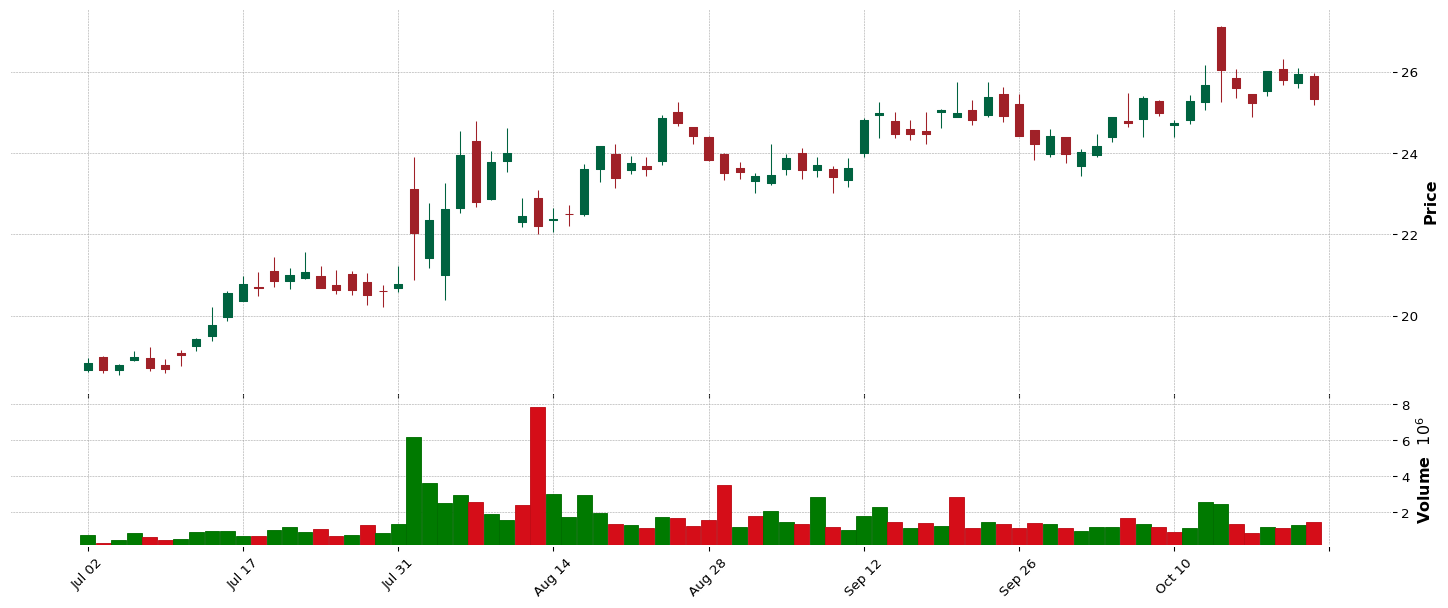
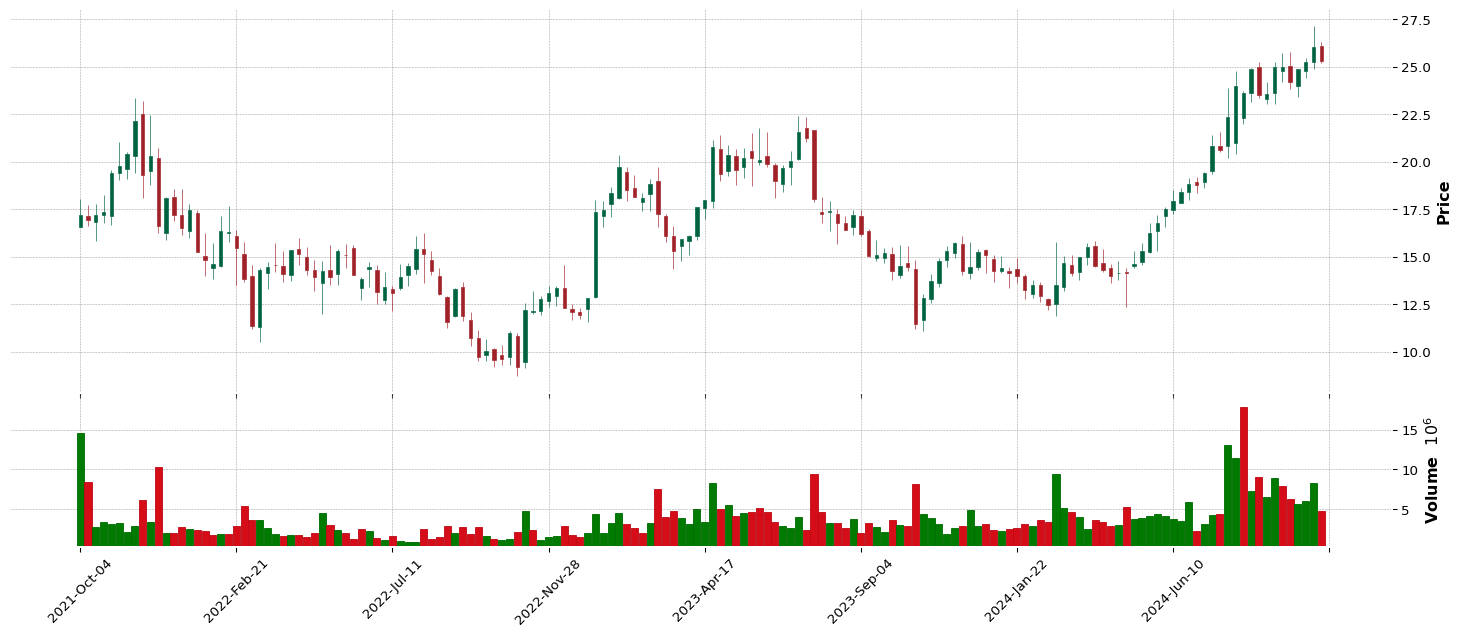
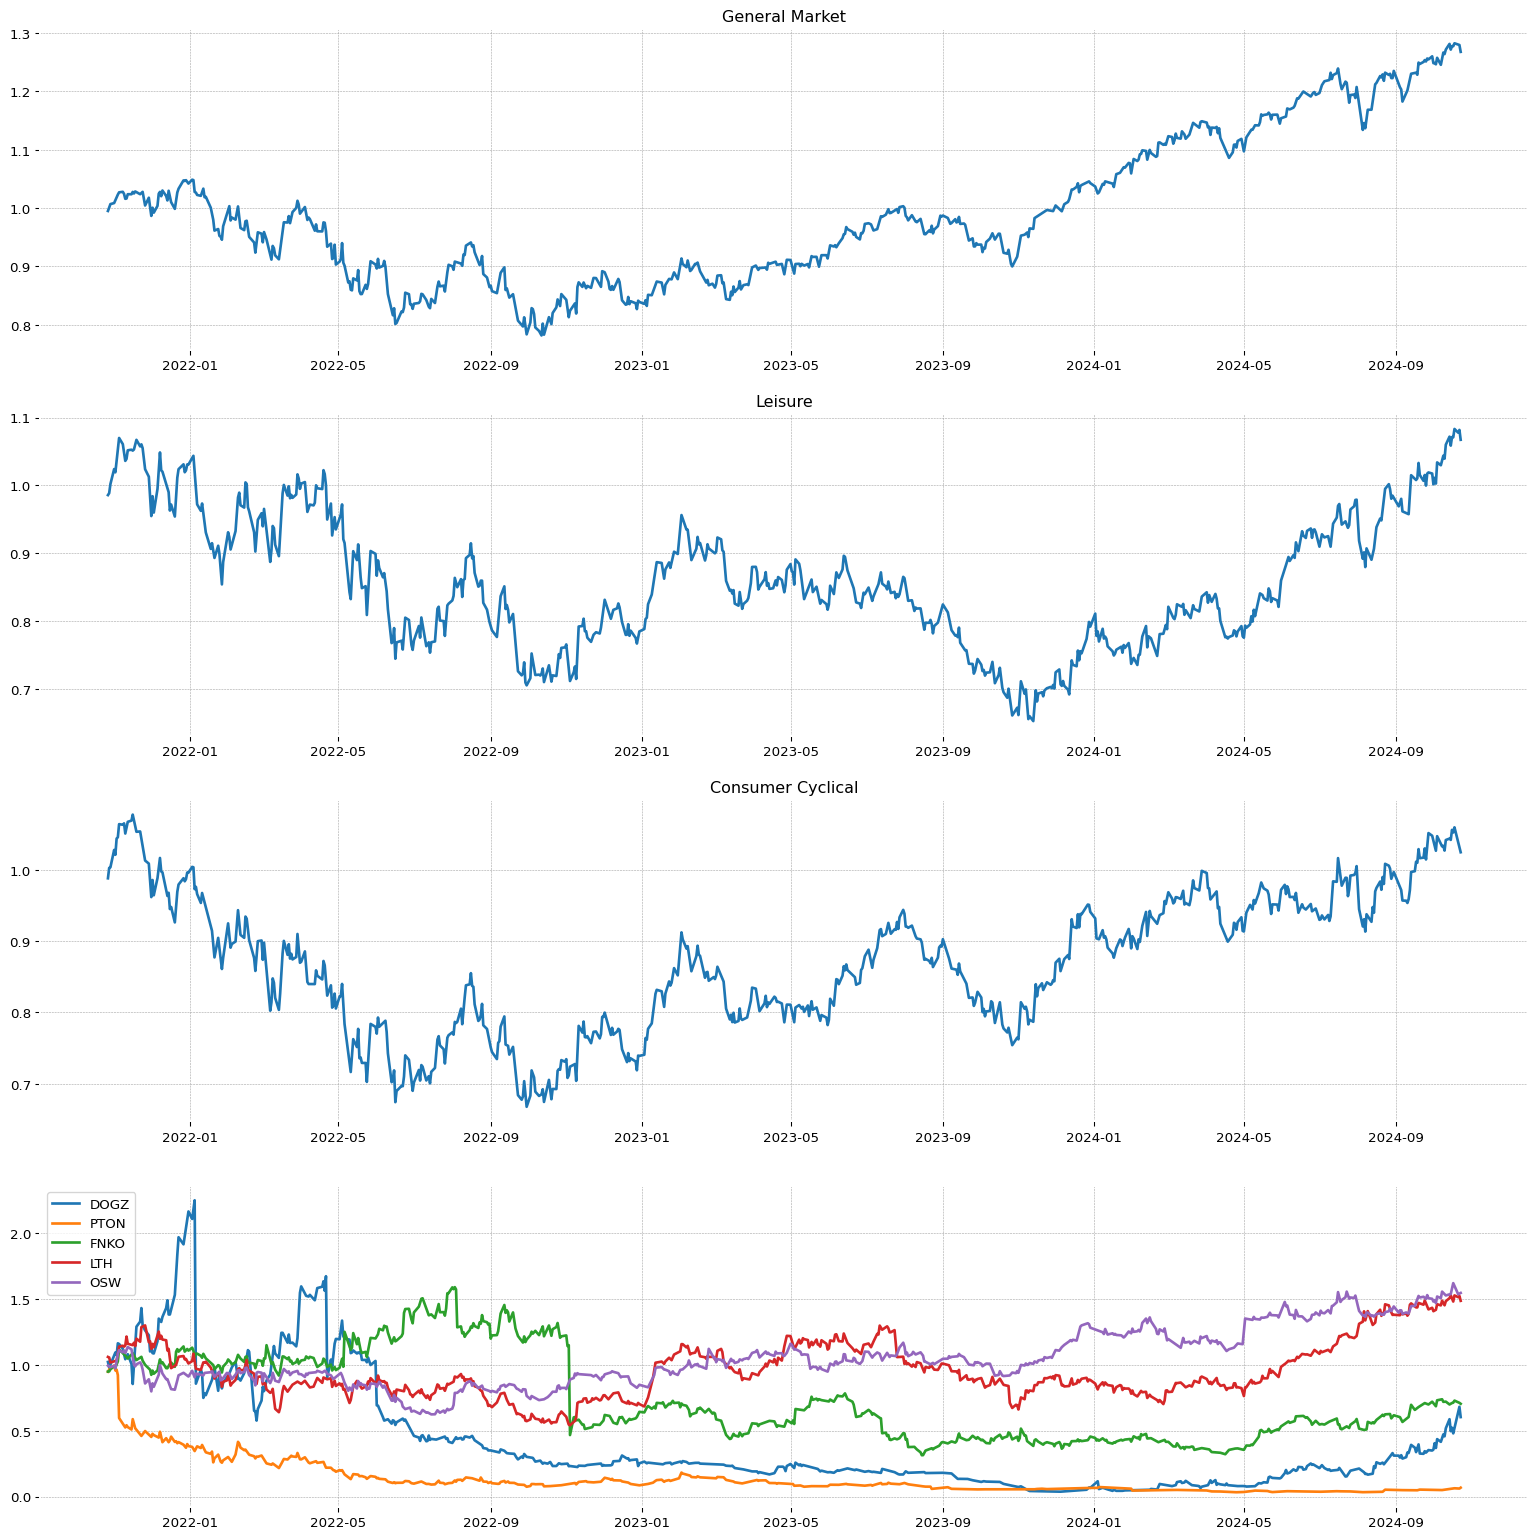 BWIN
BWIN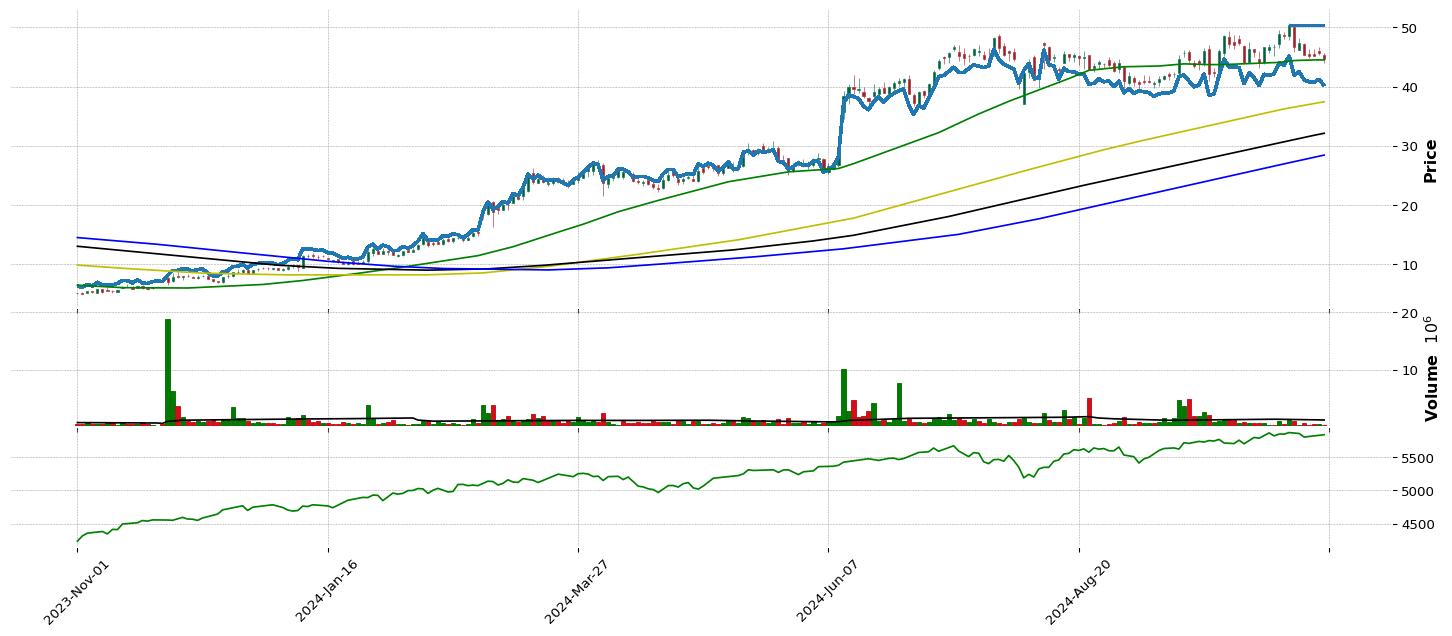
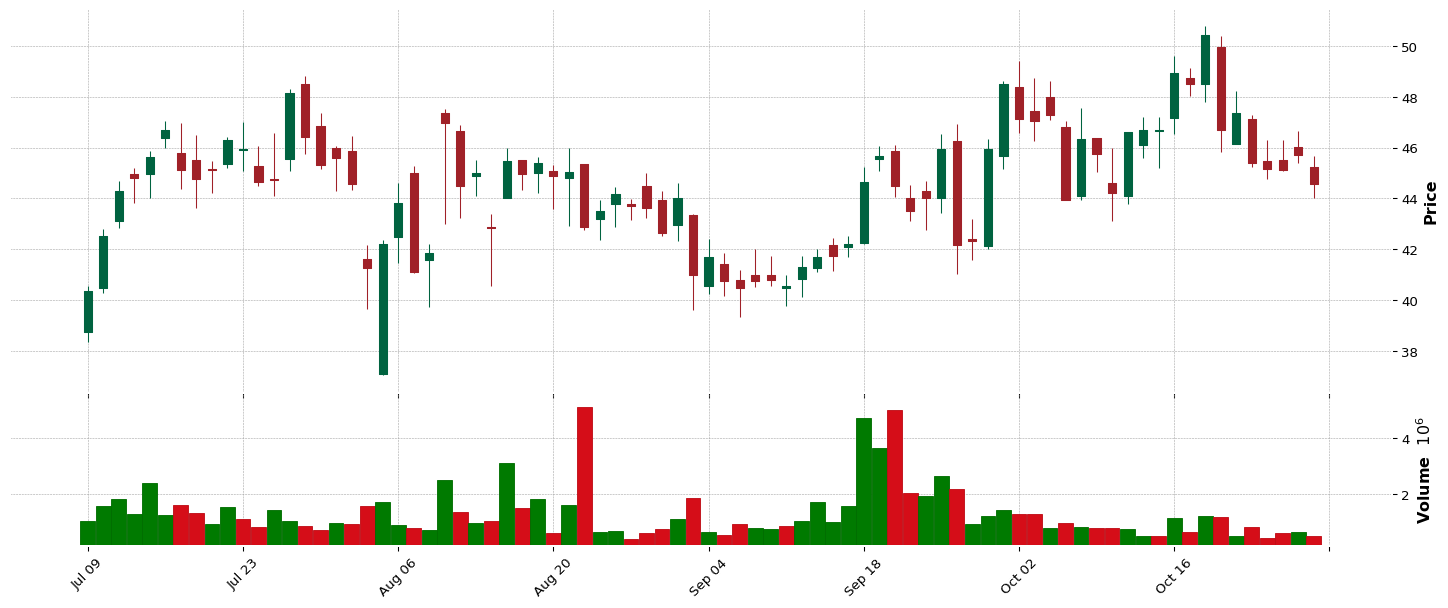
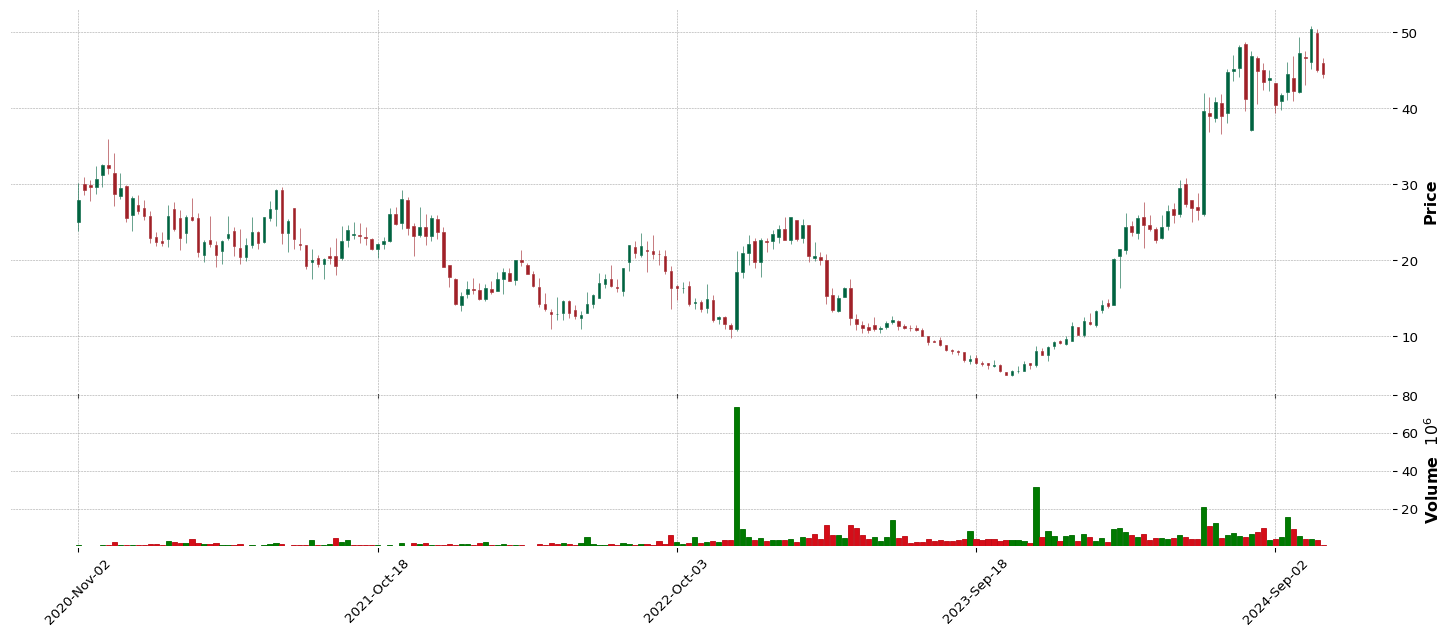
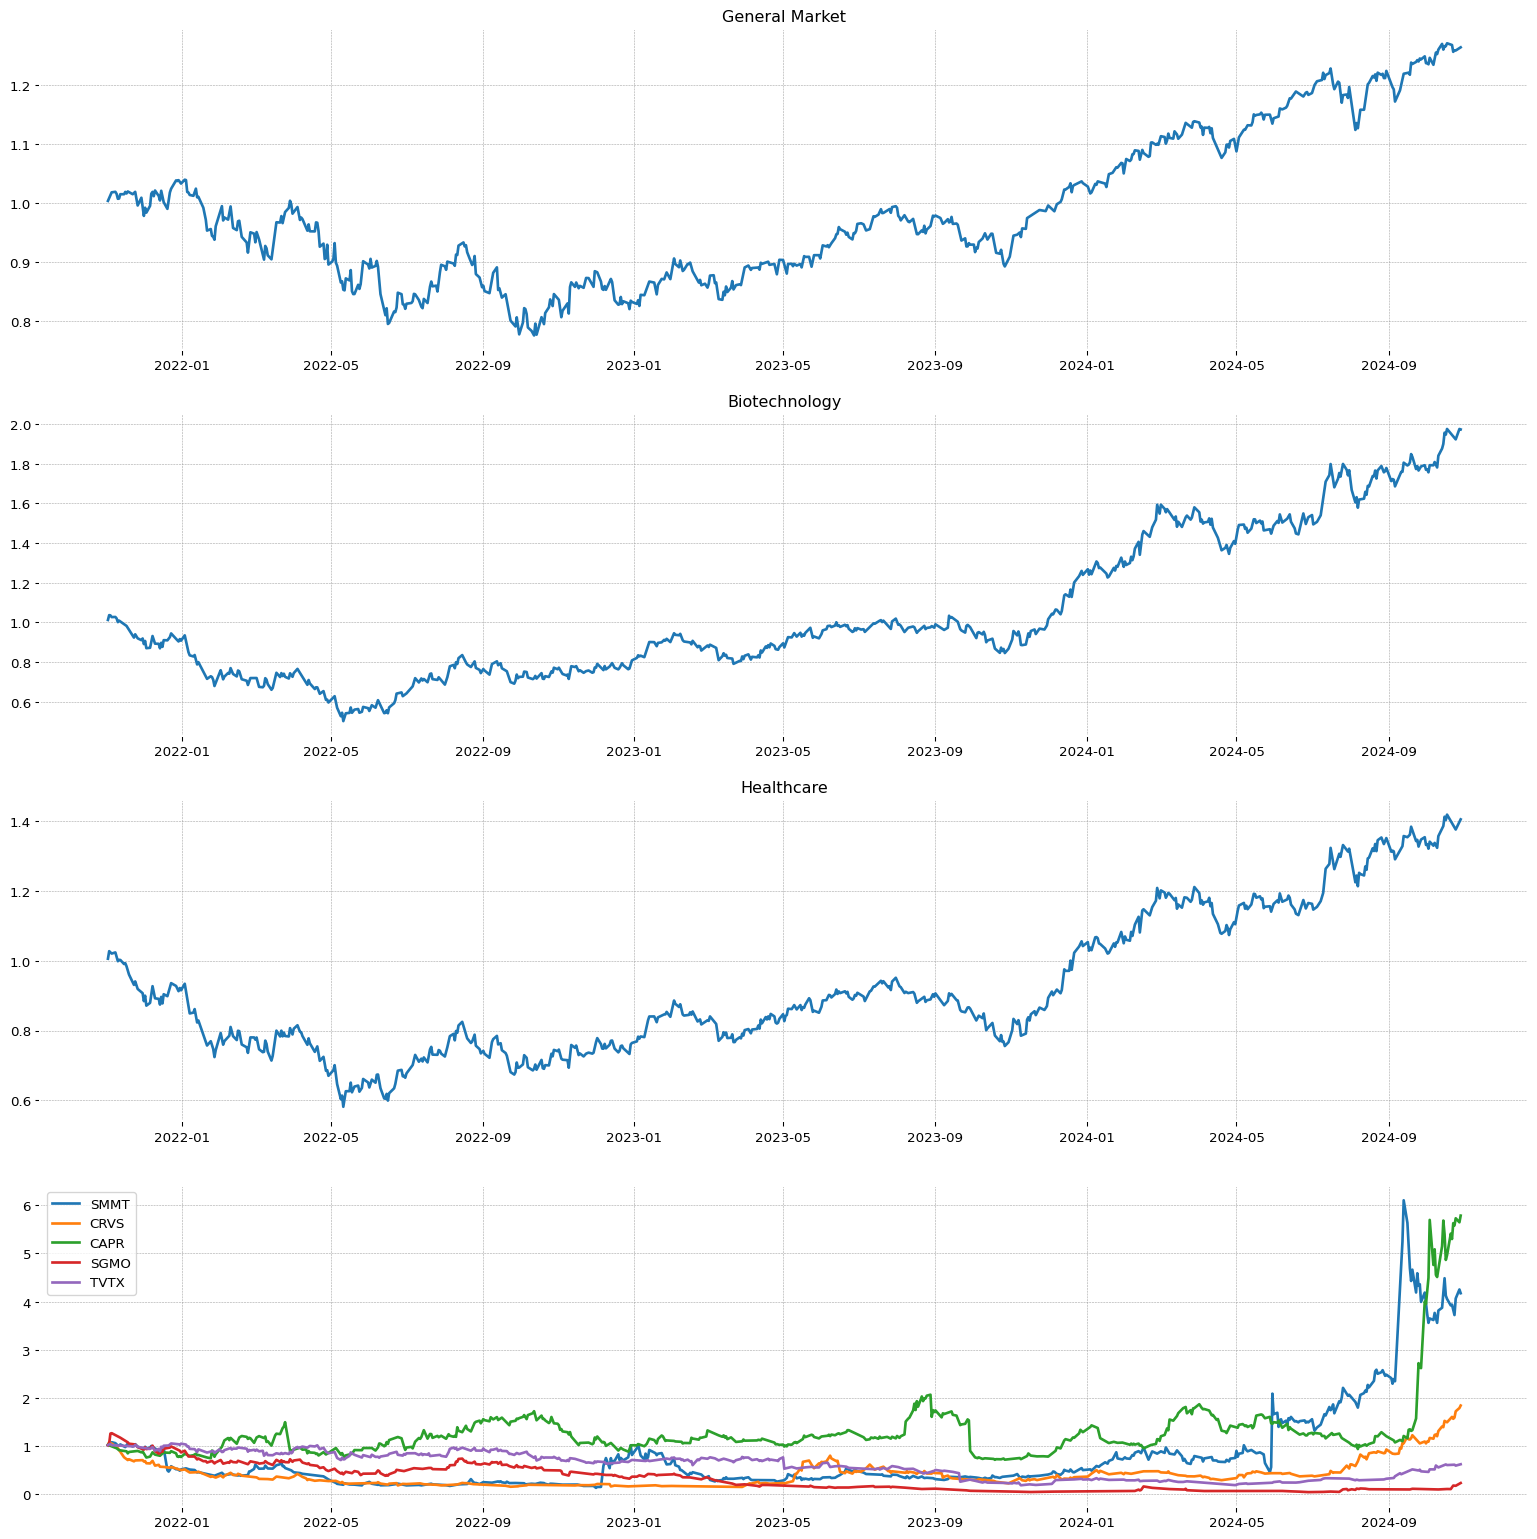 HROW
HROW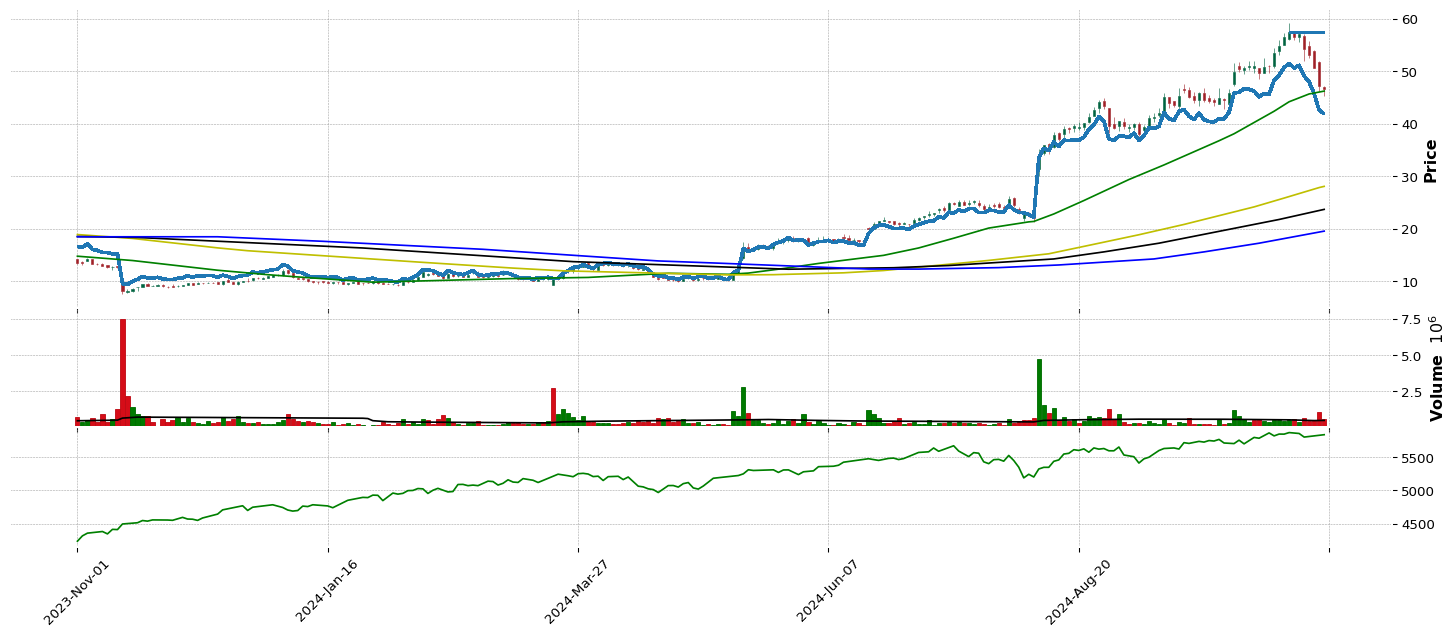
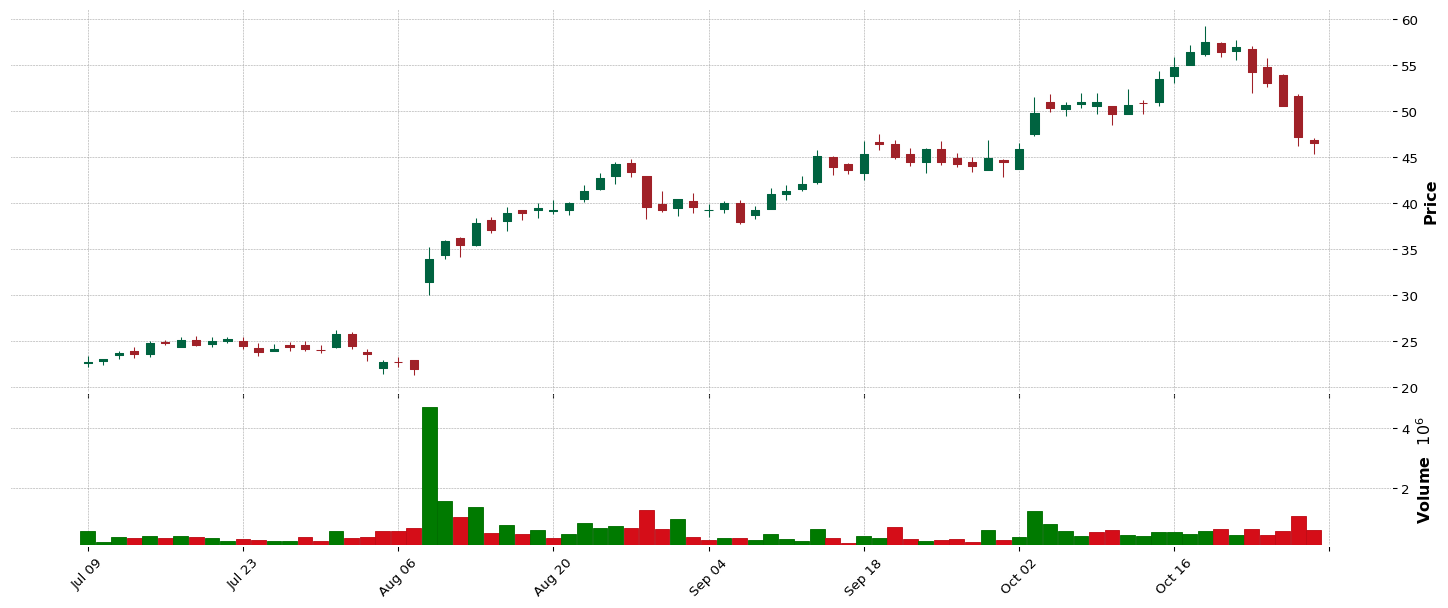
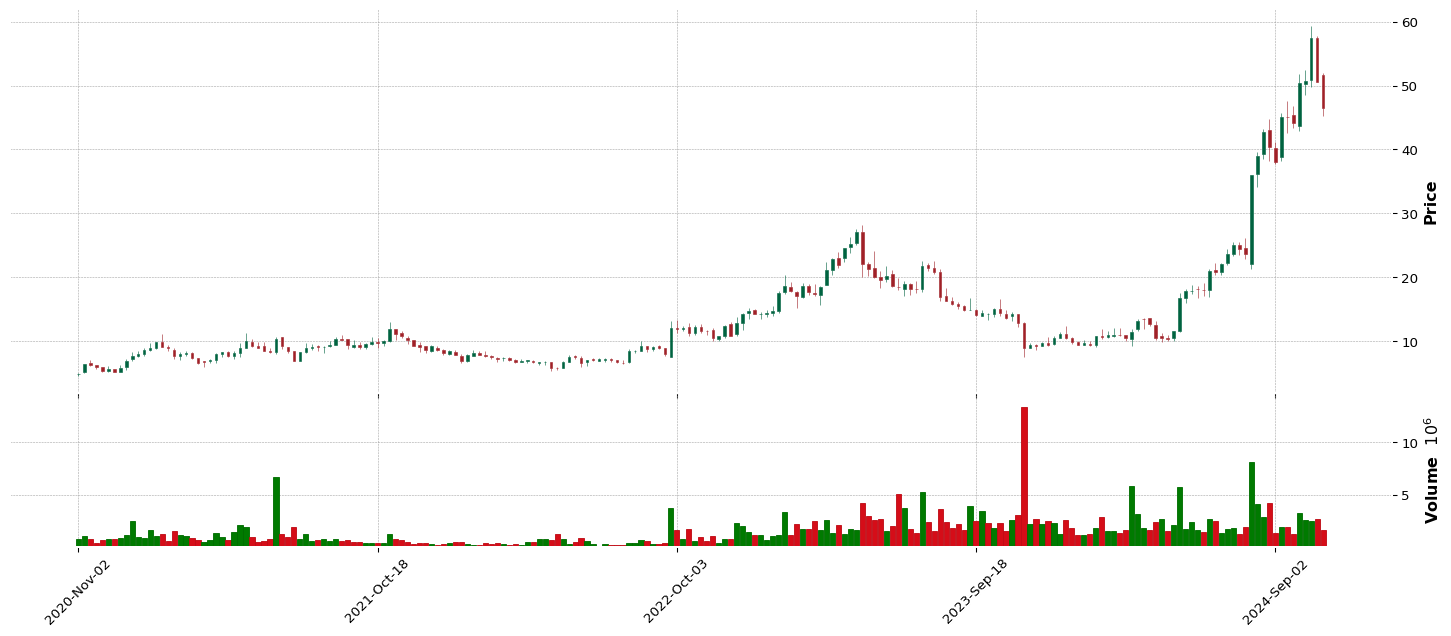
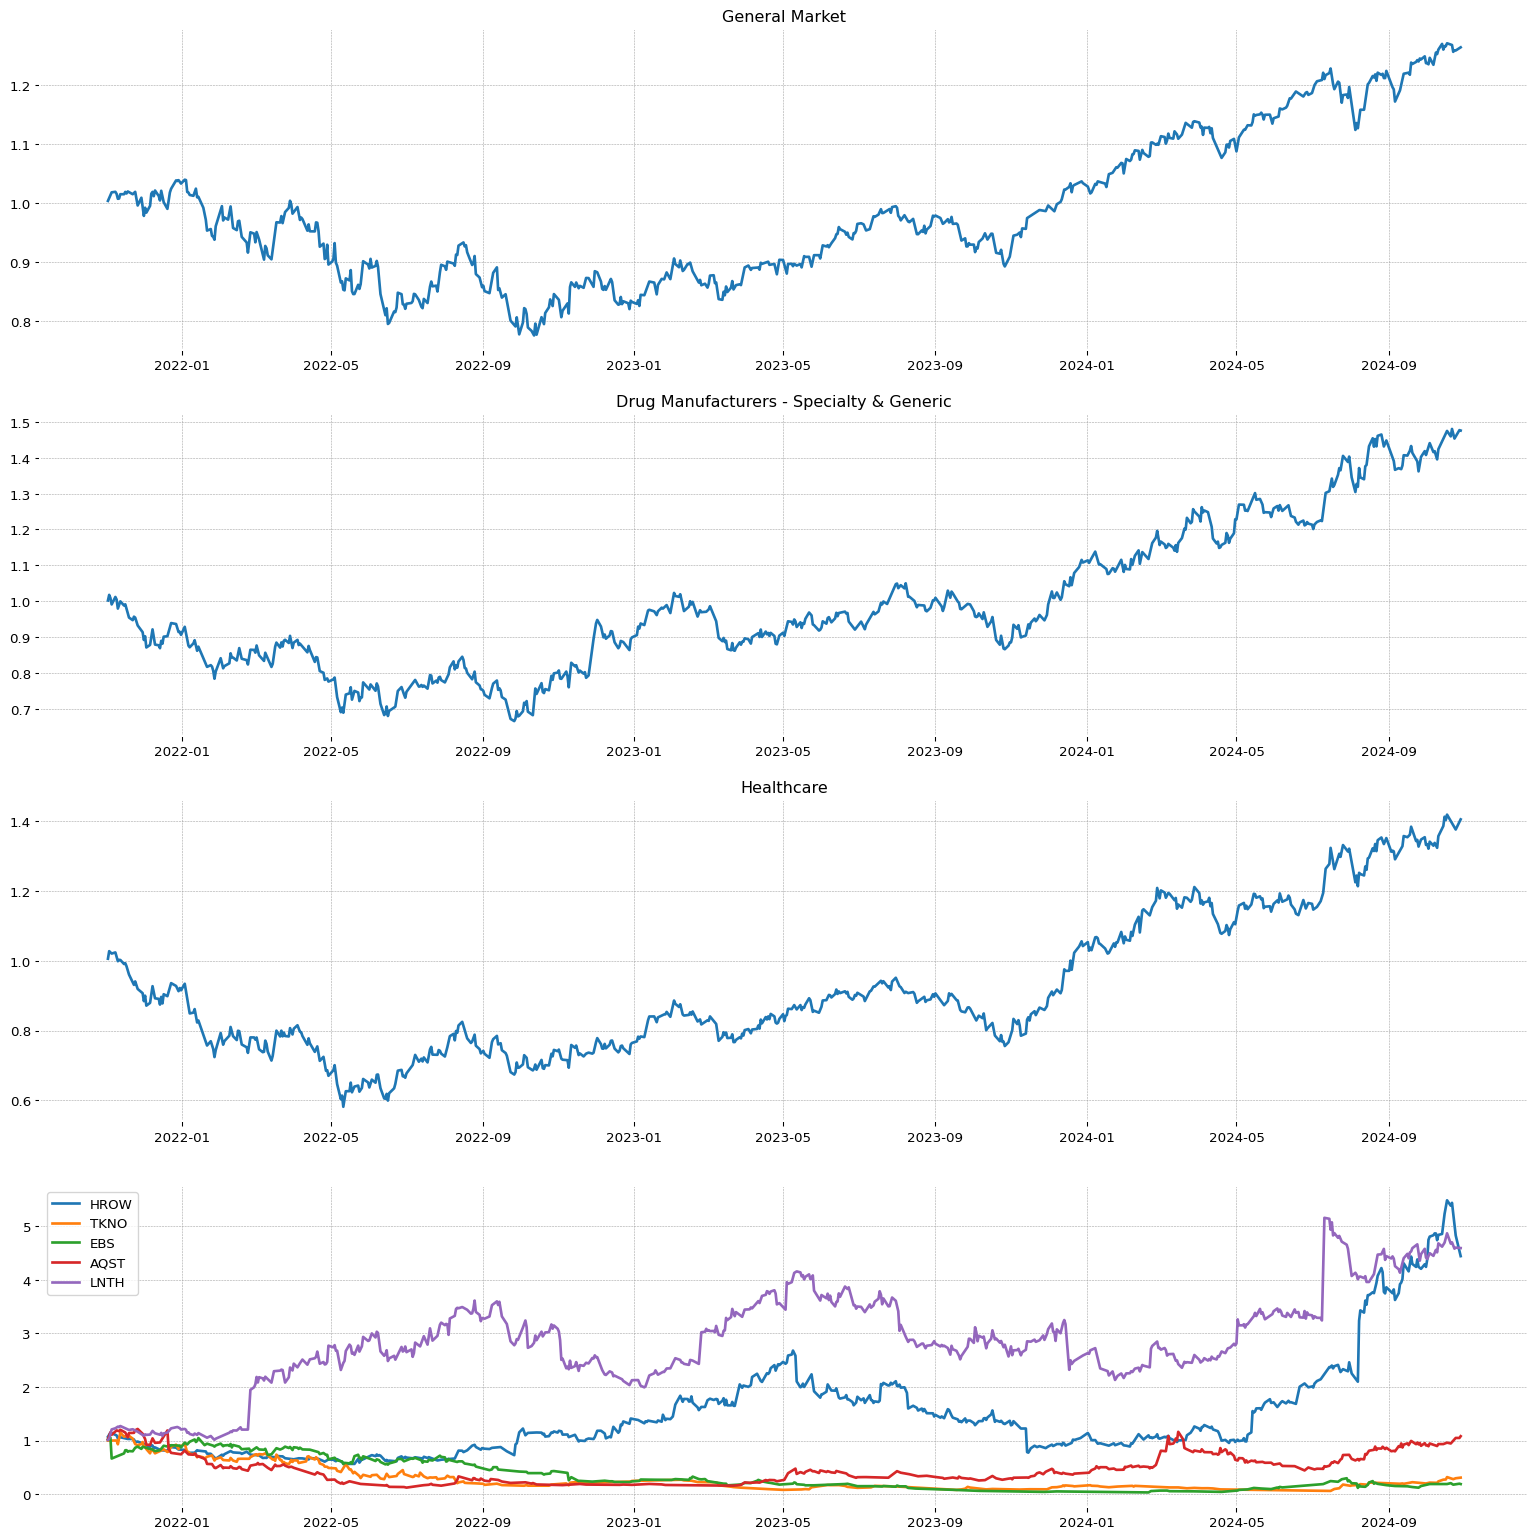 DOGZ
DOGZ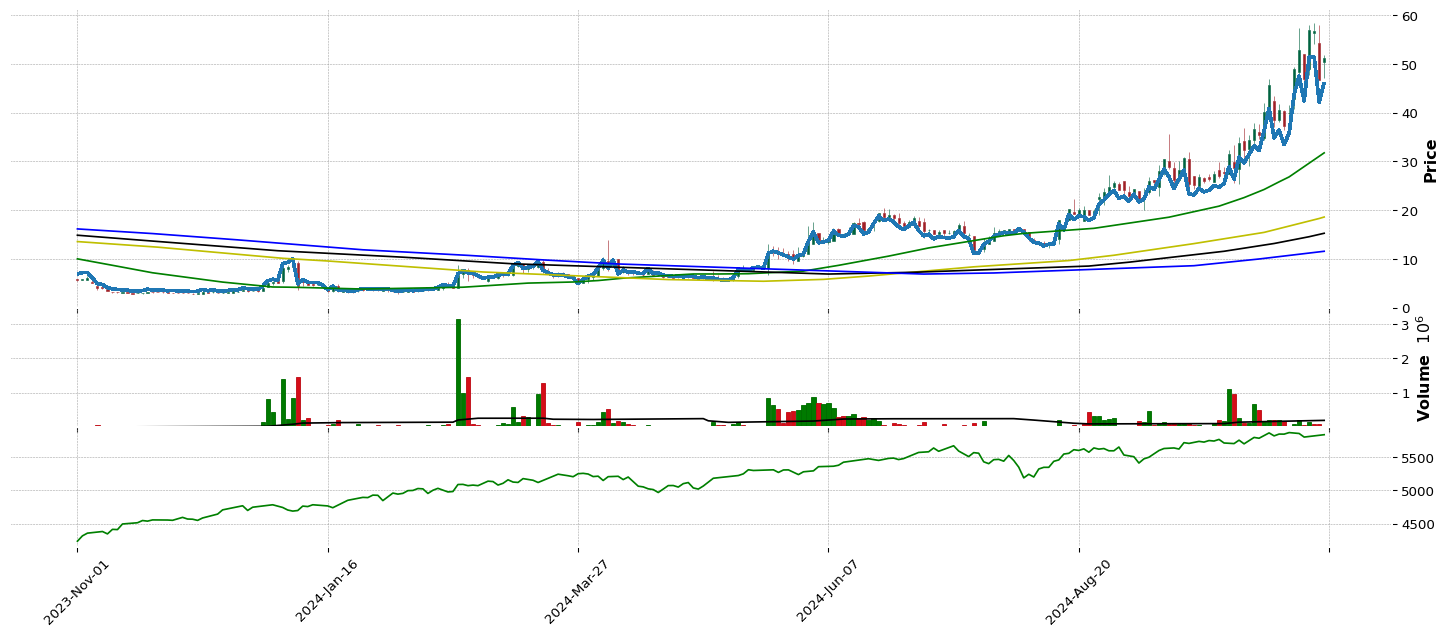
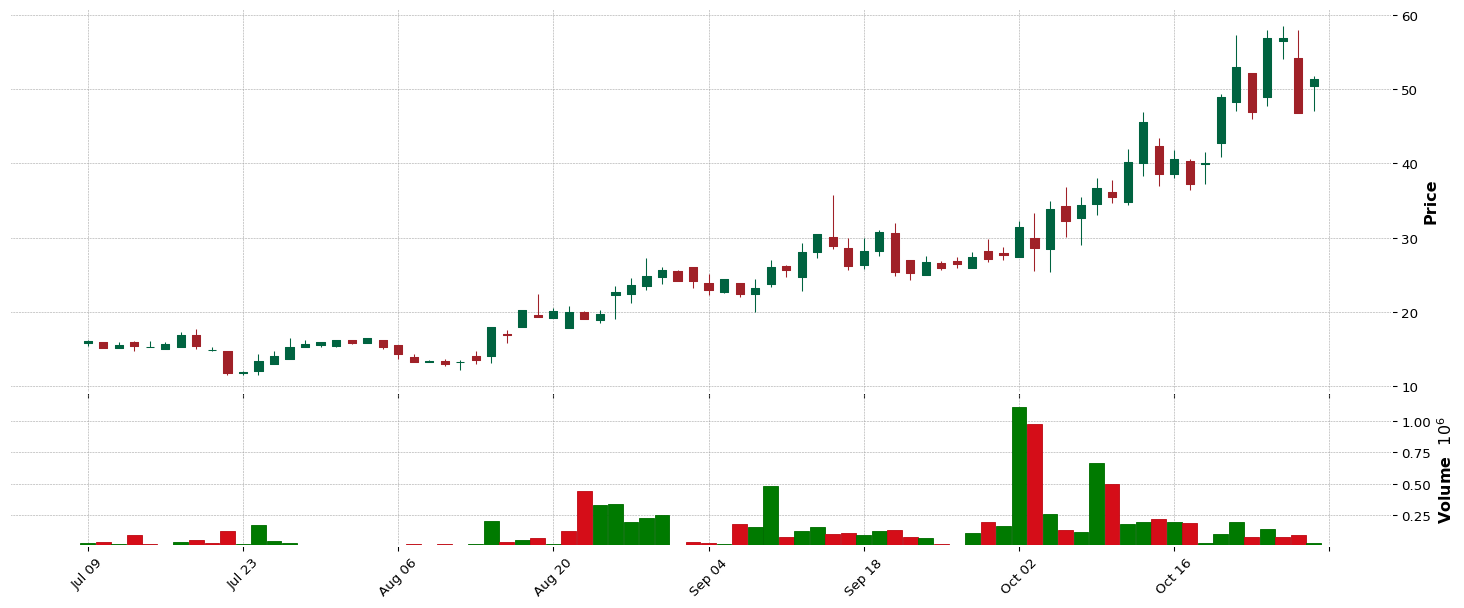
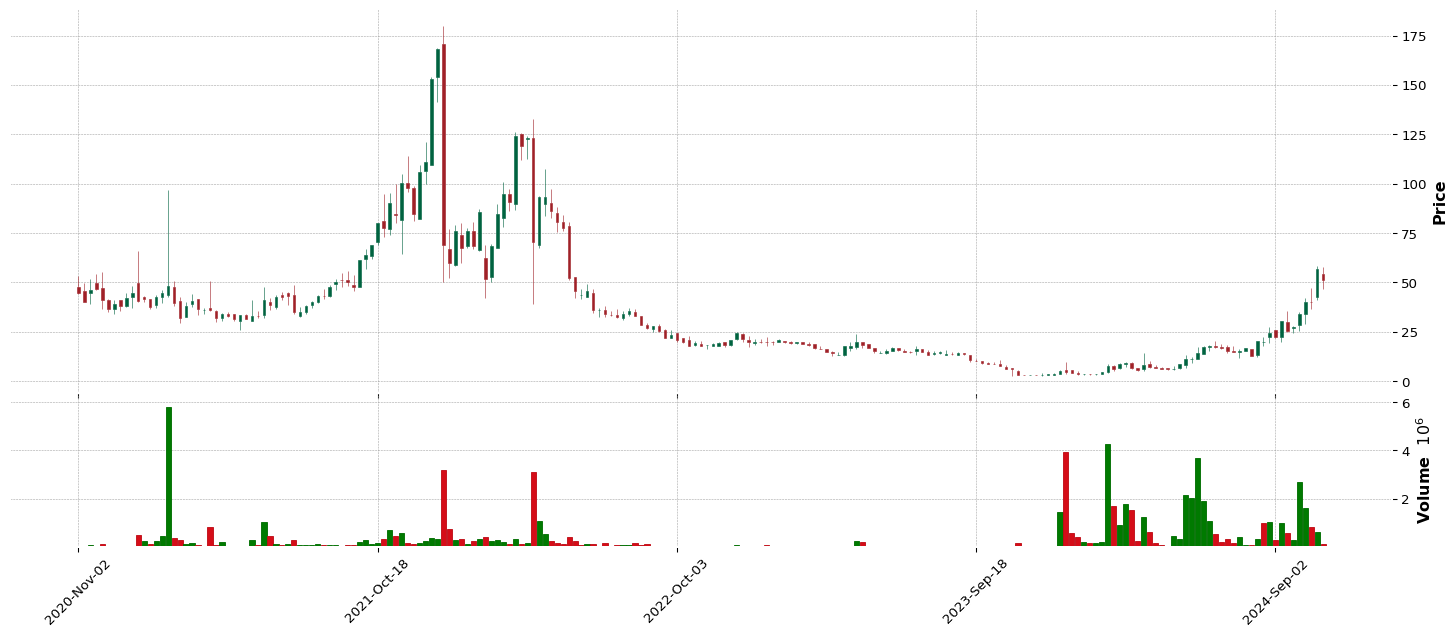
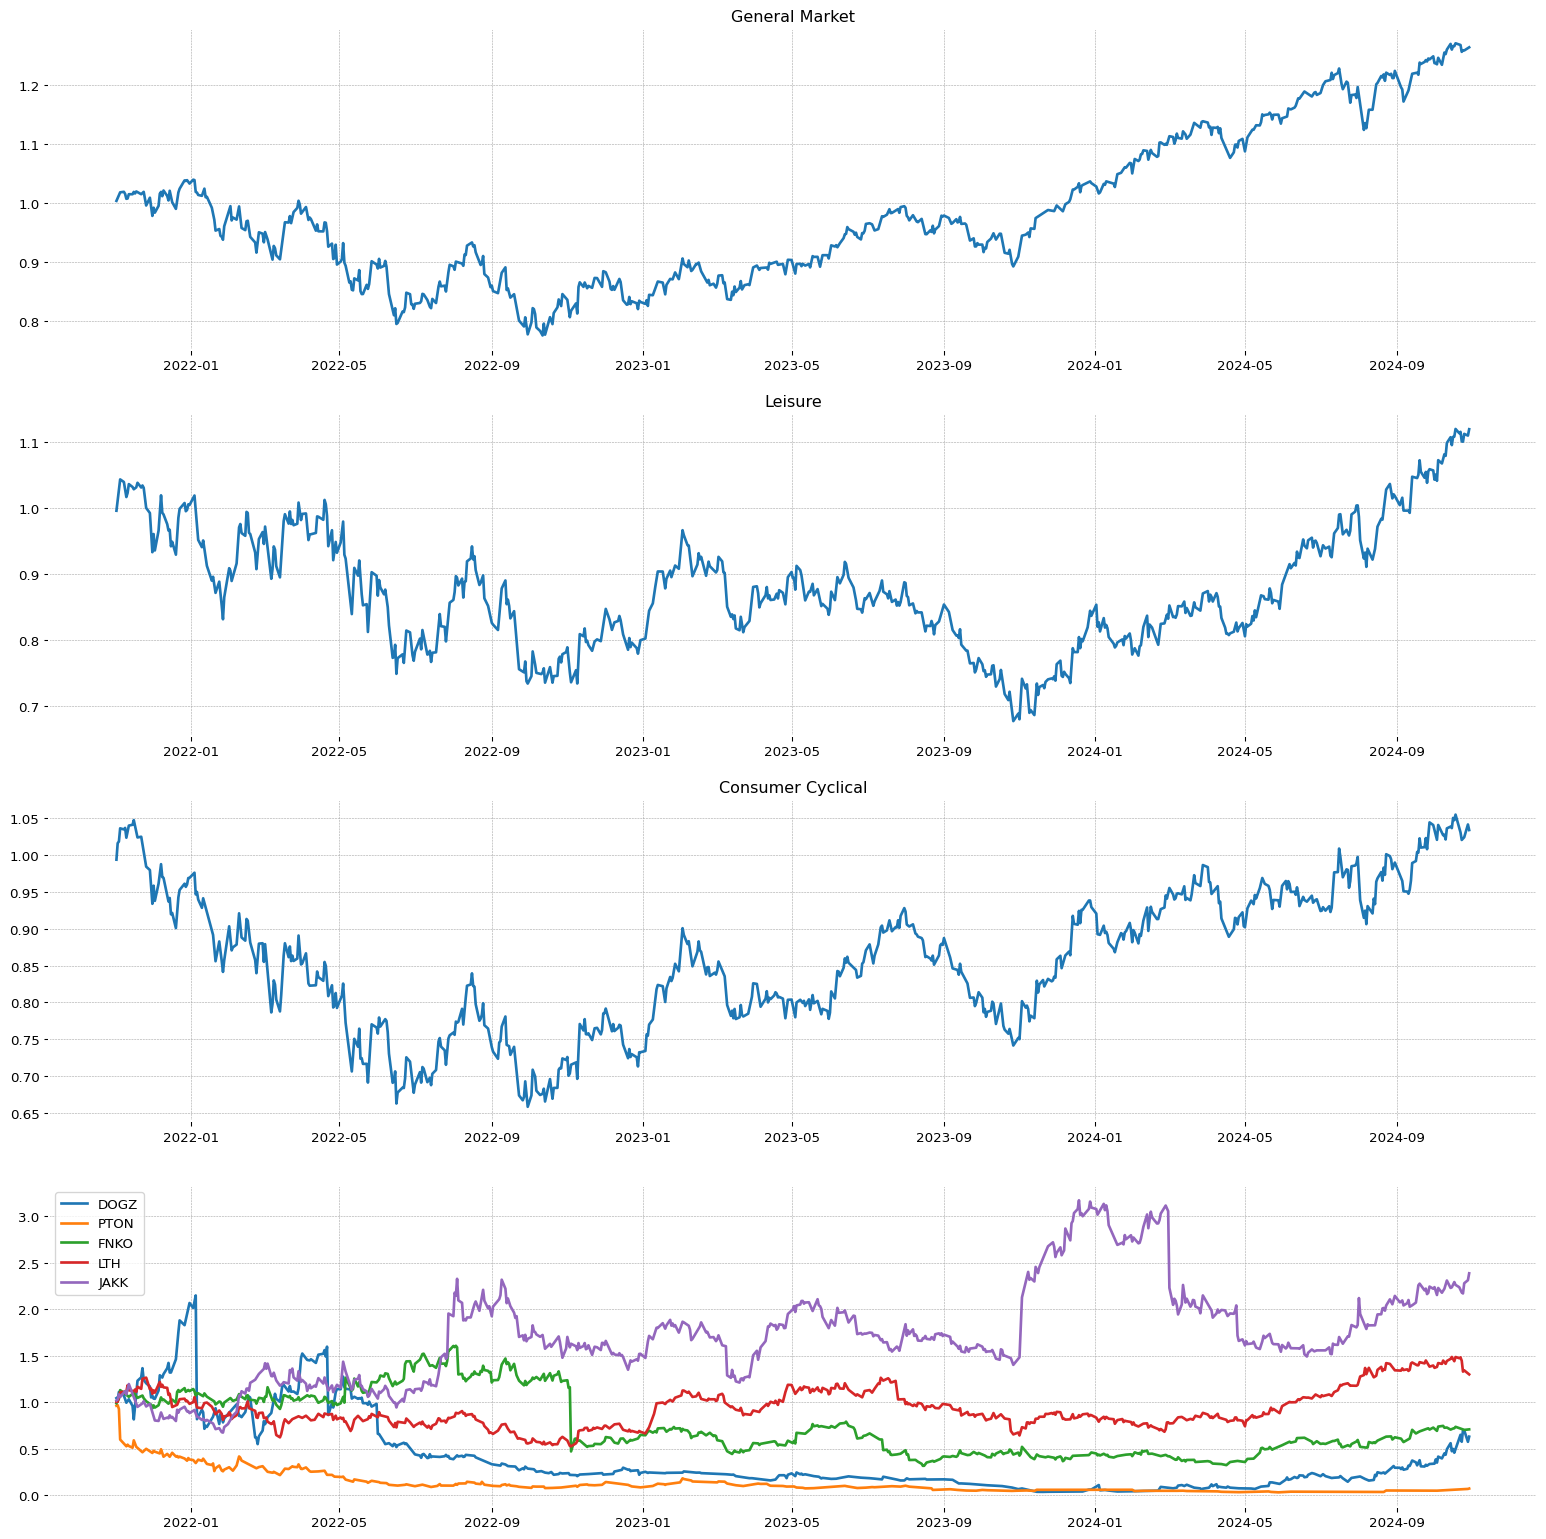 CRDO
CRDO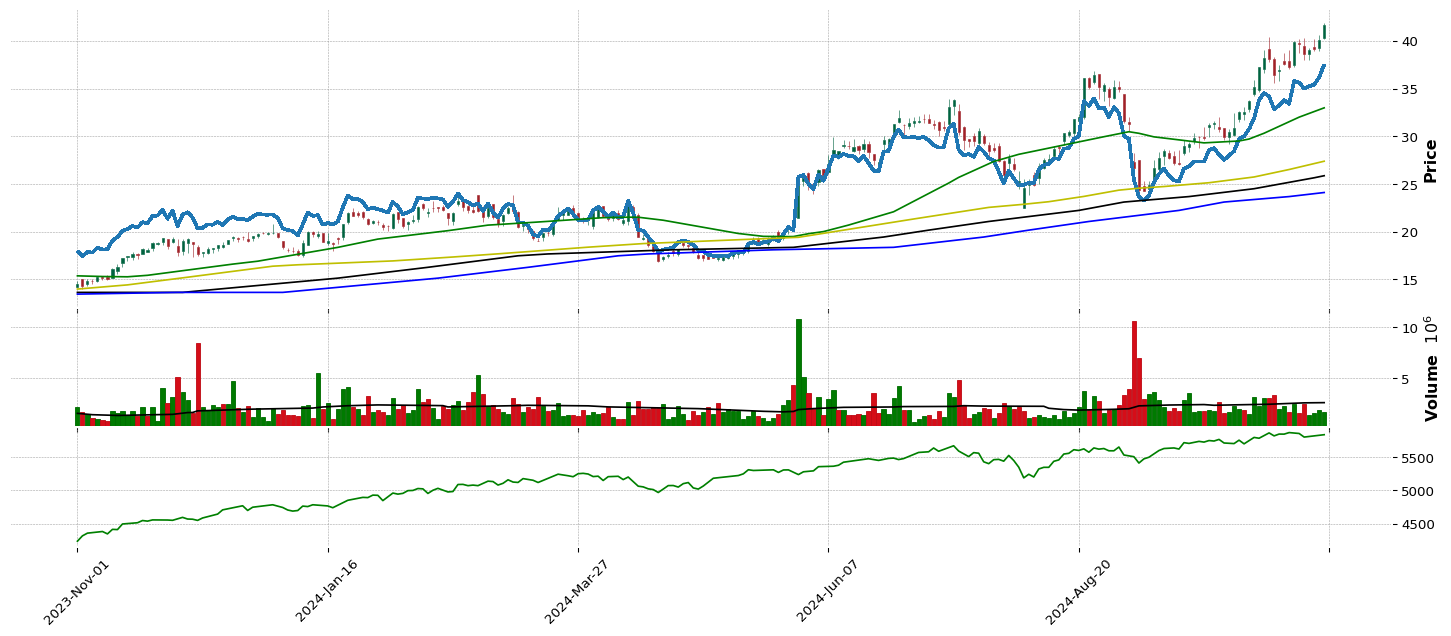
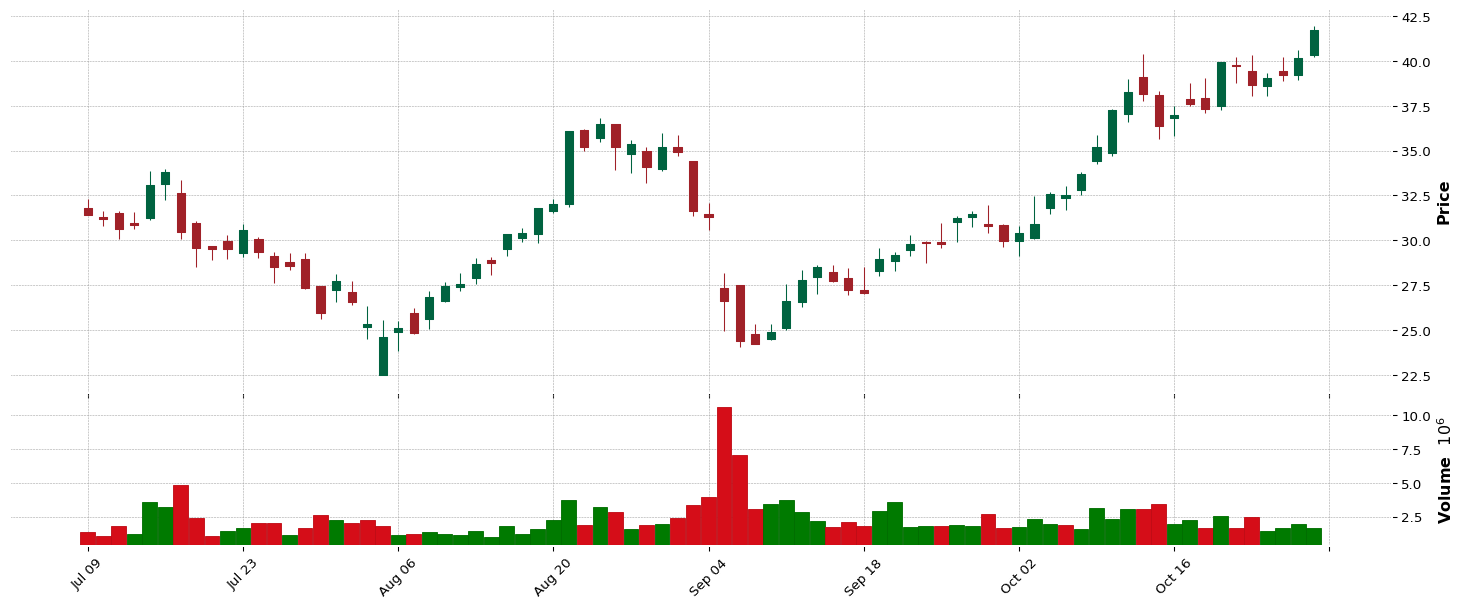
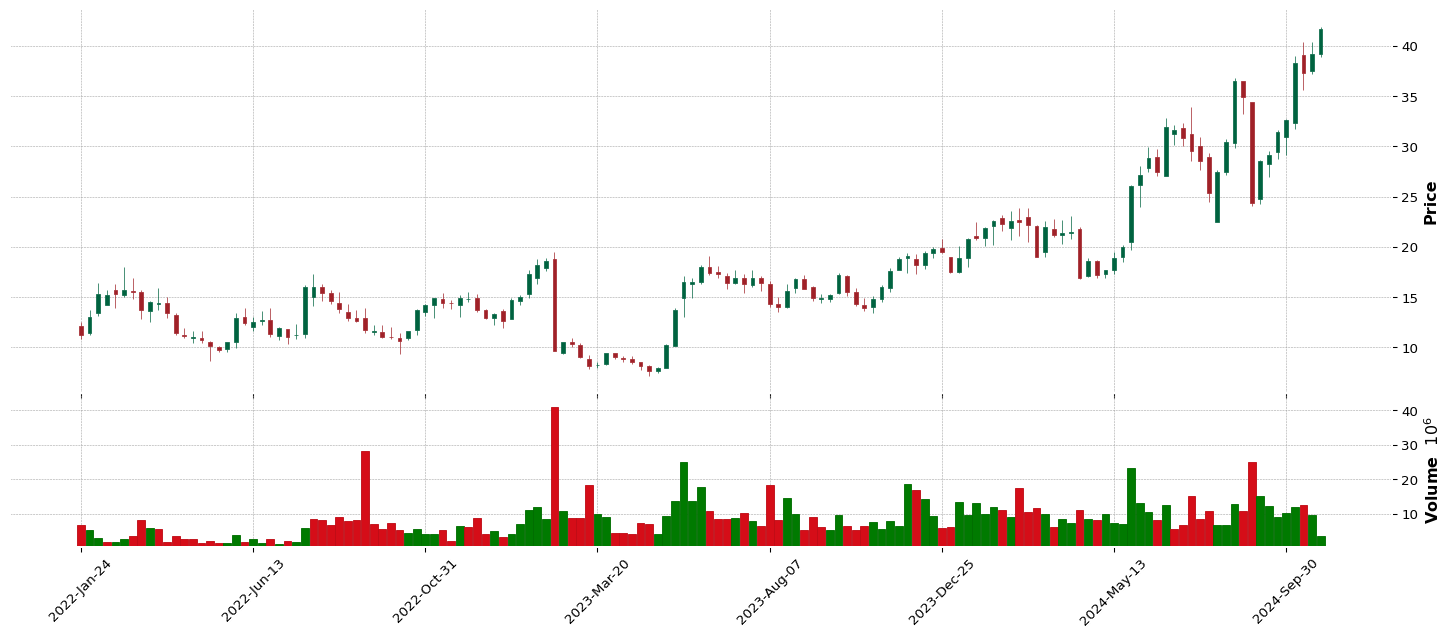
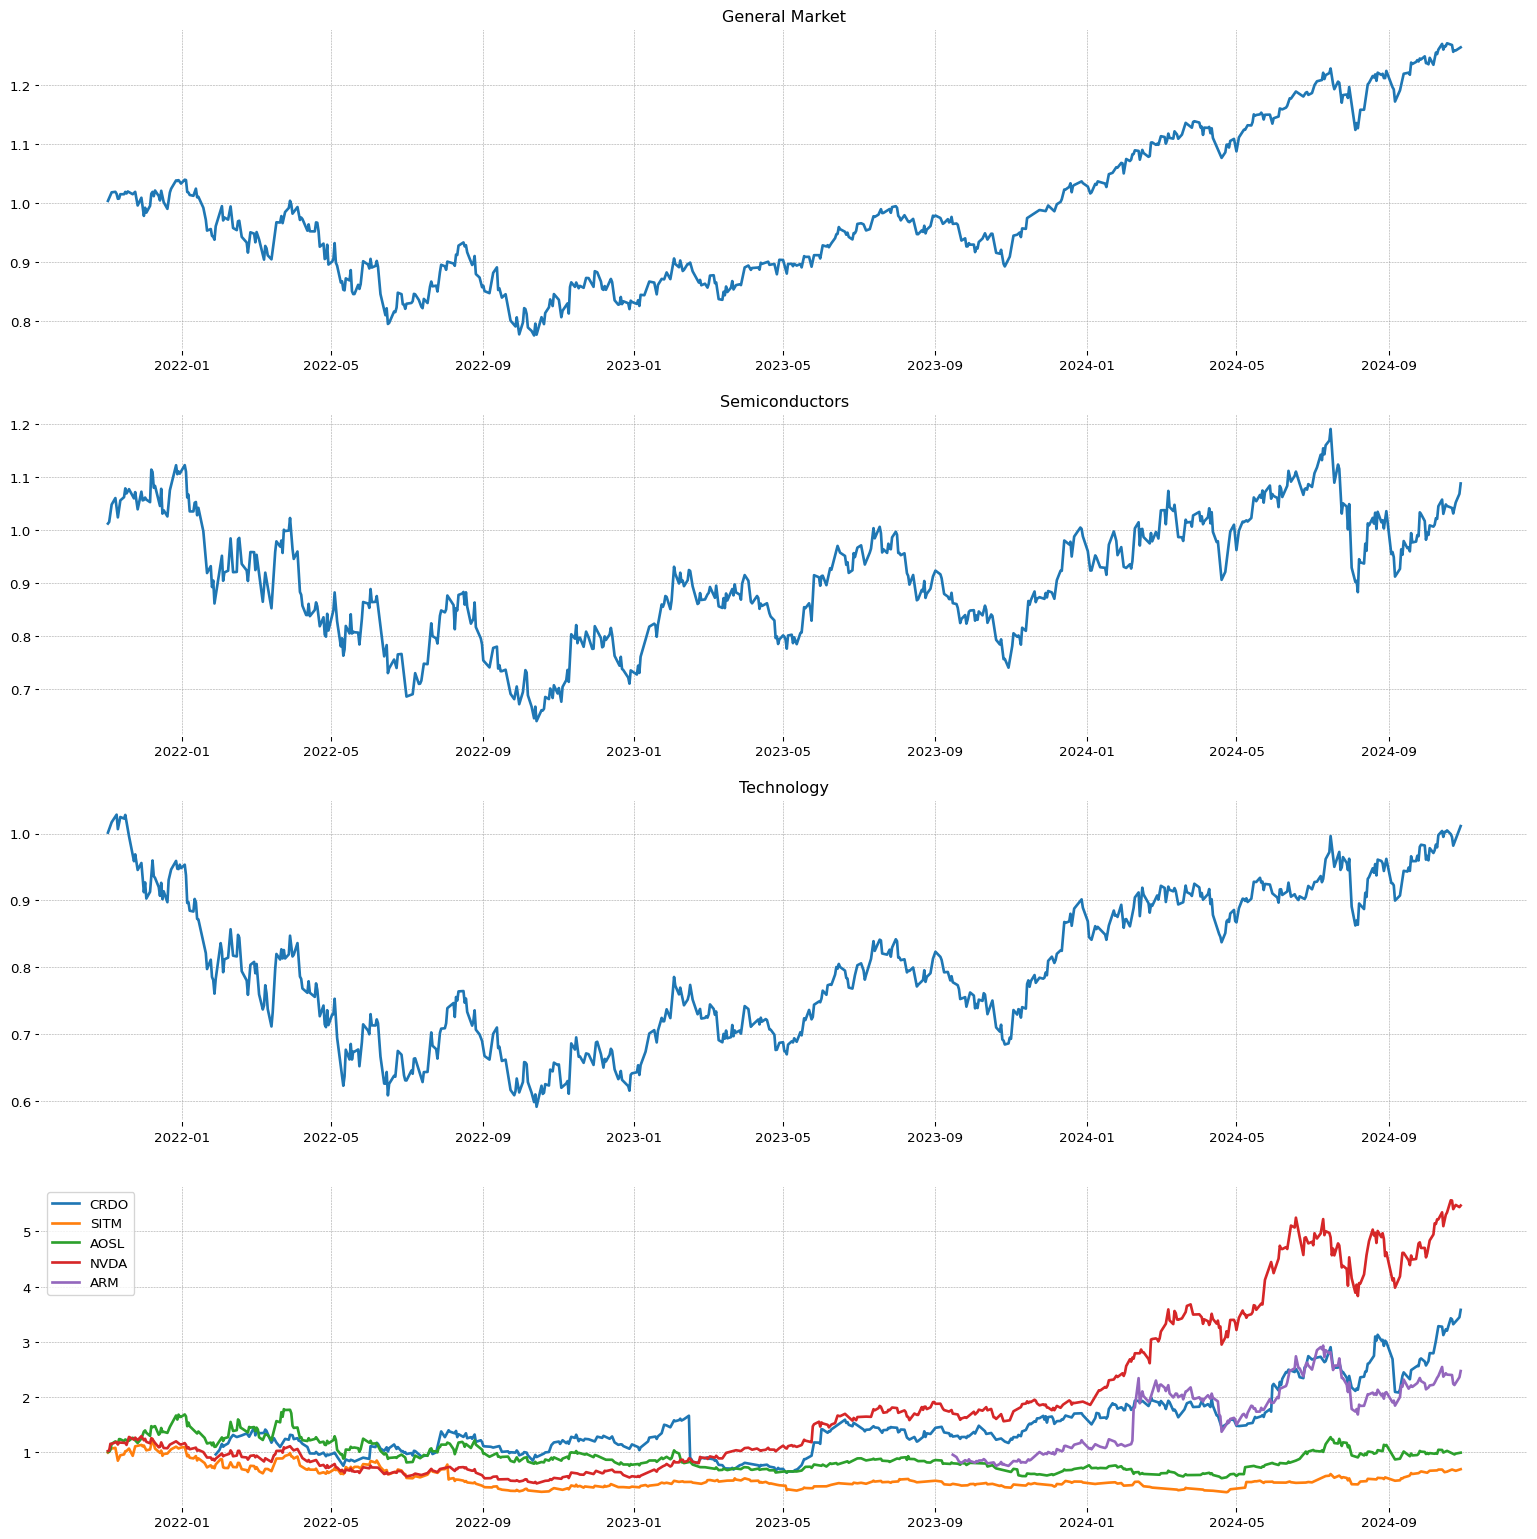 CMPO
CMPO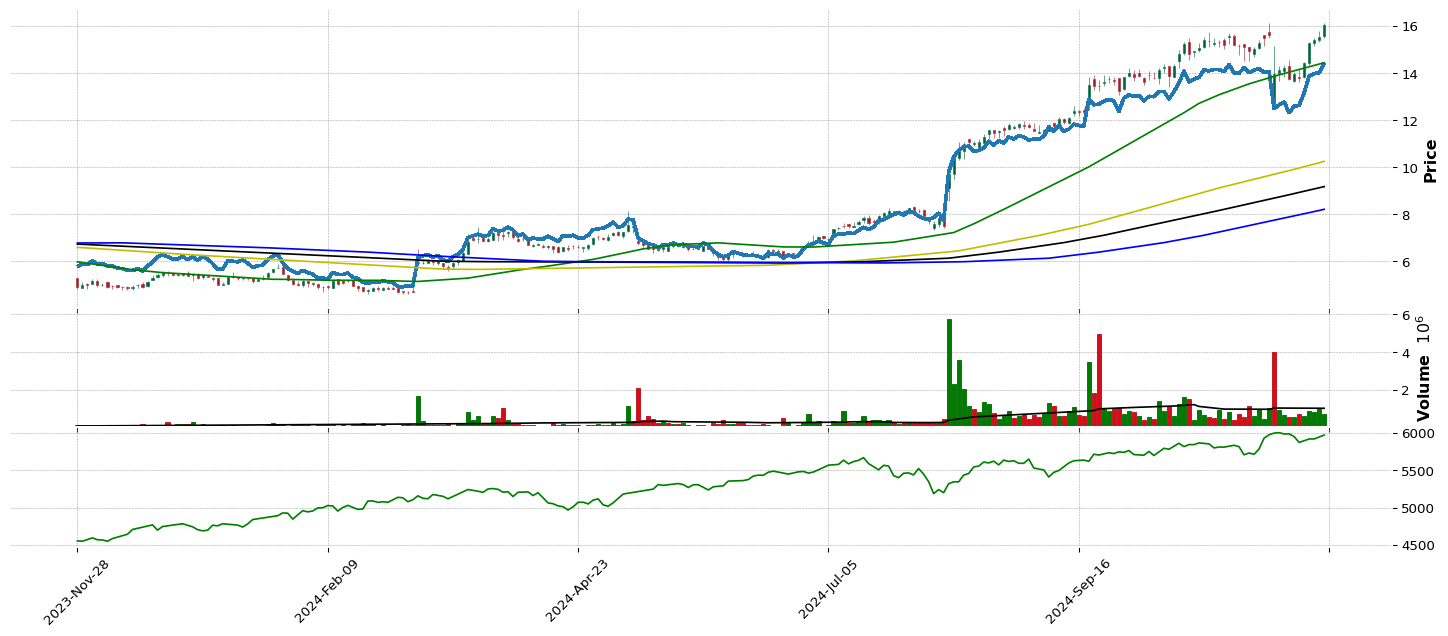
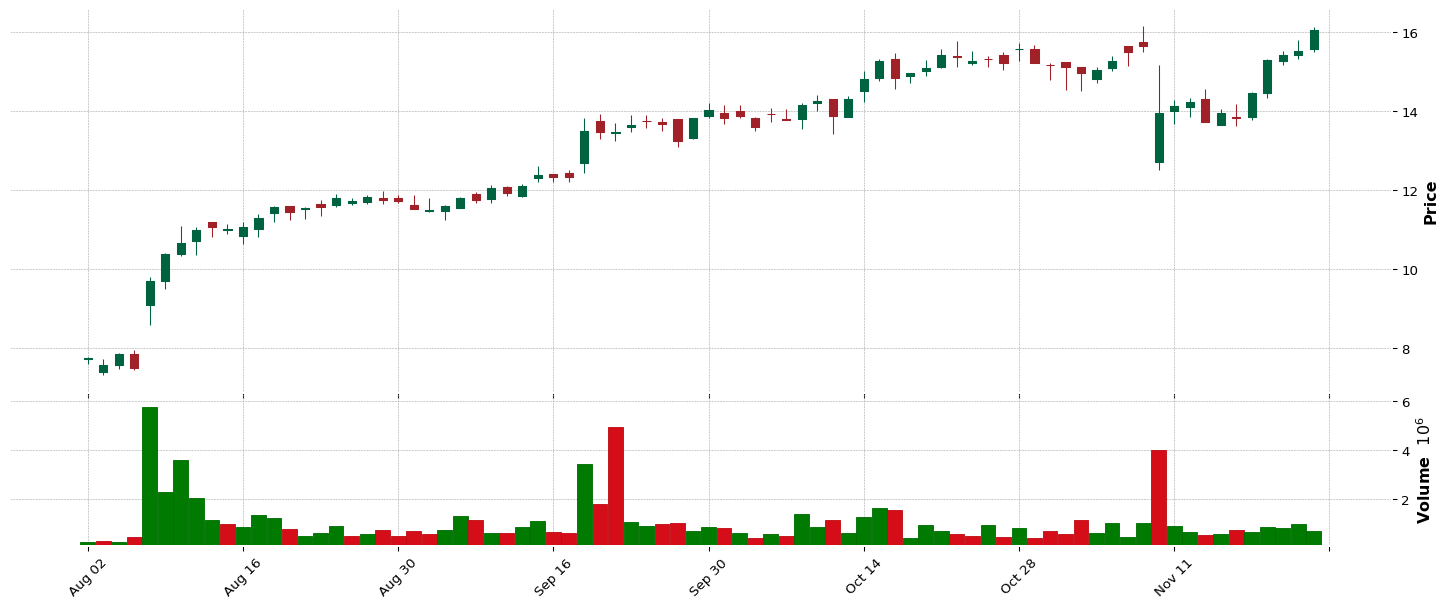
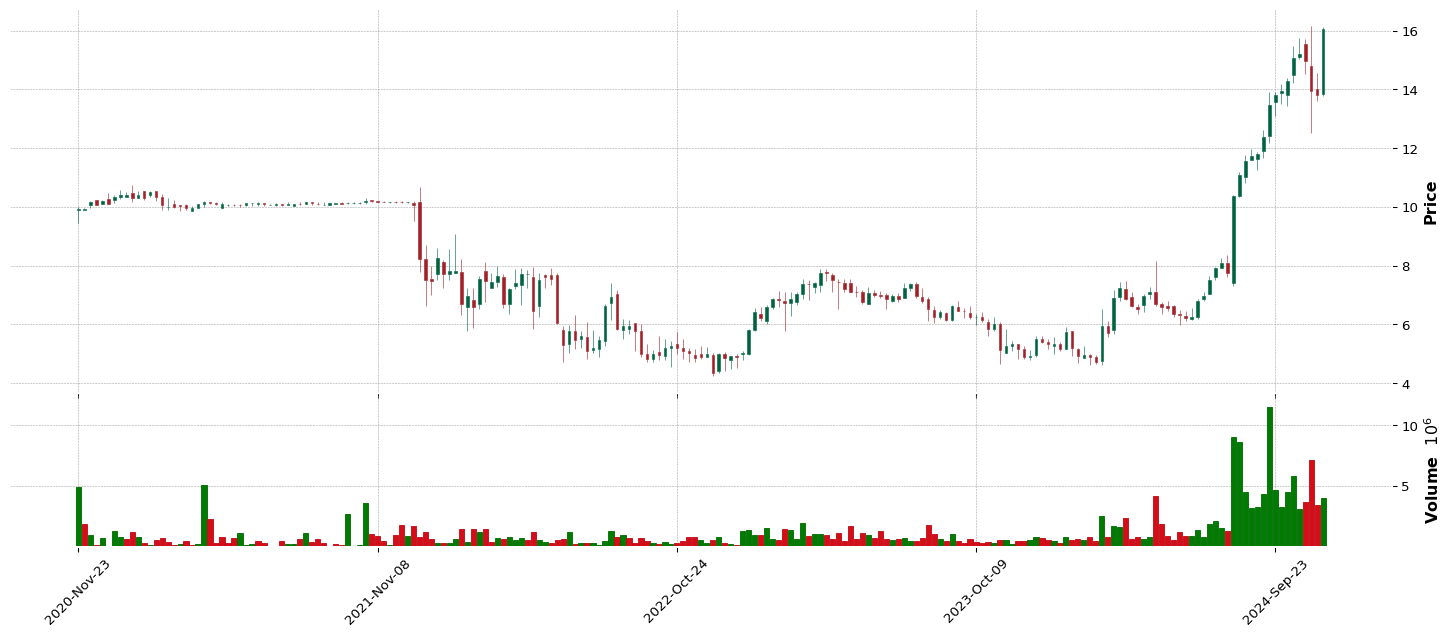
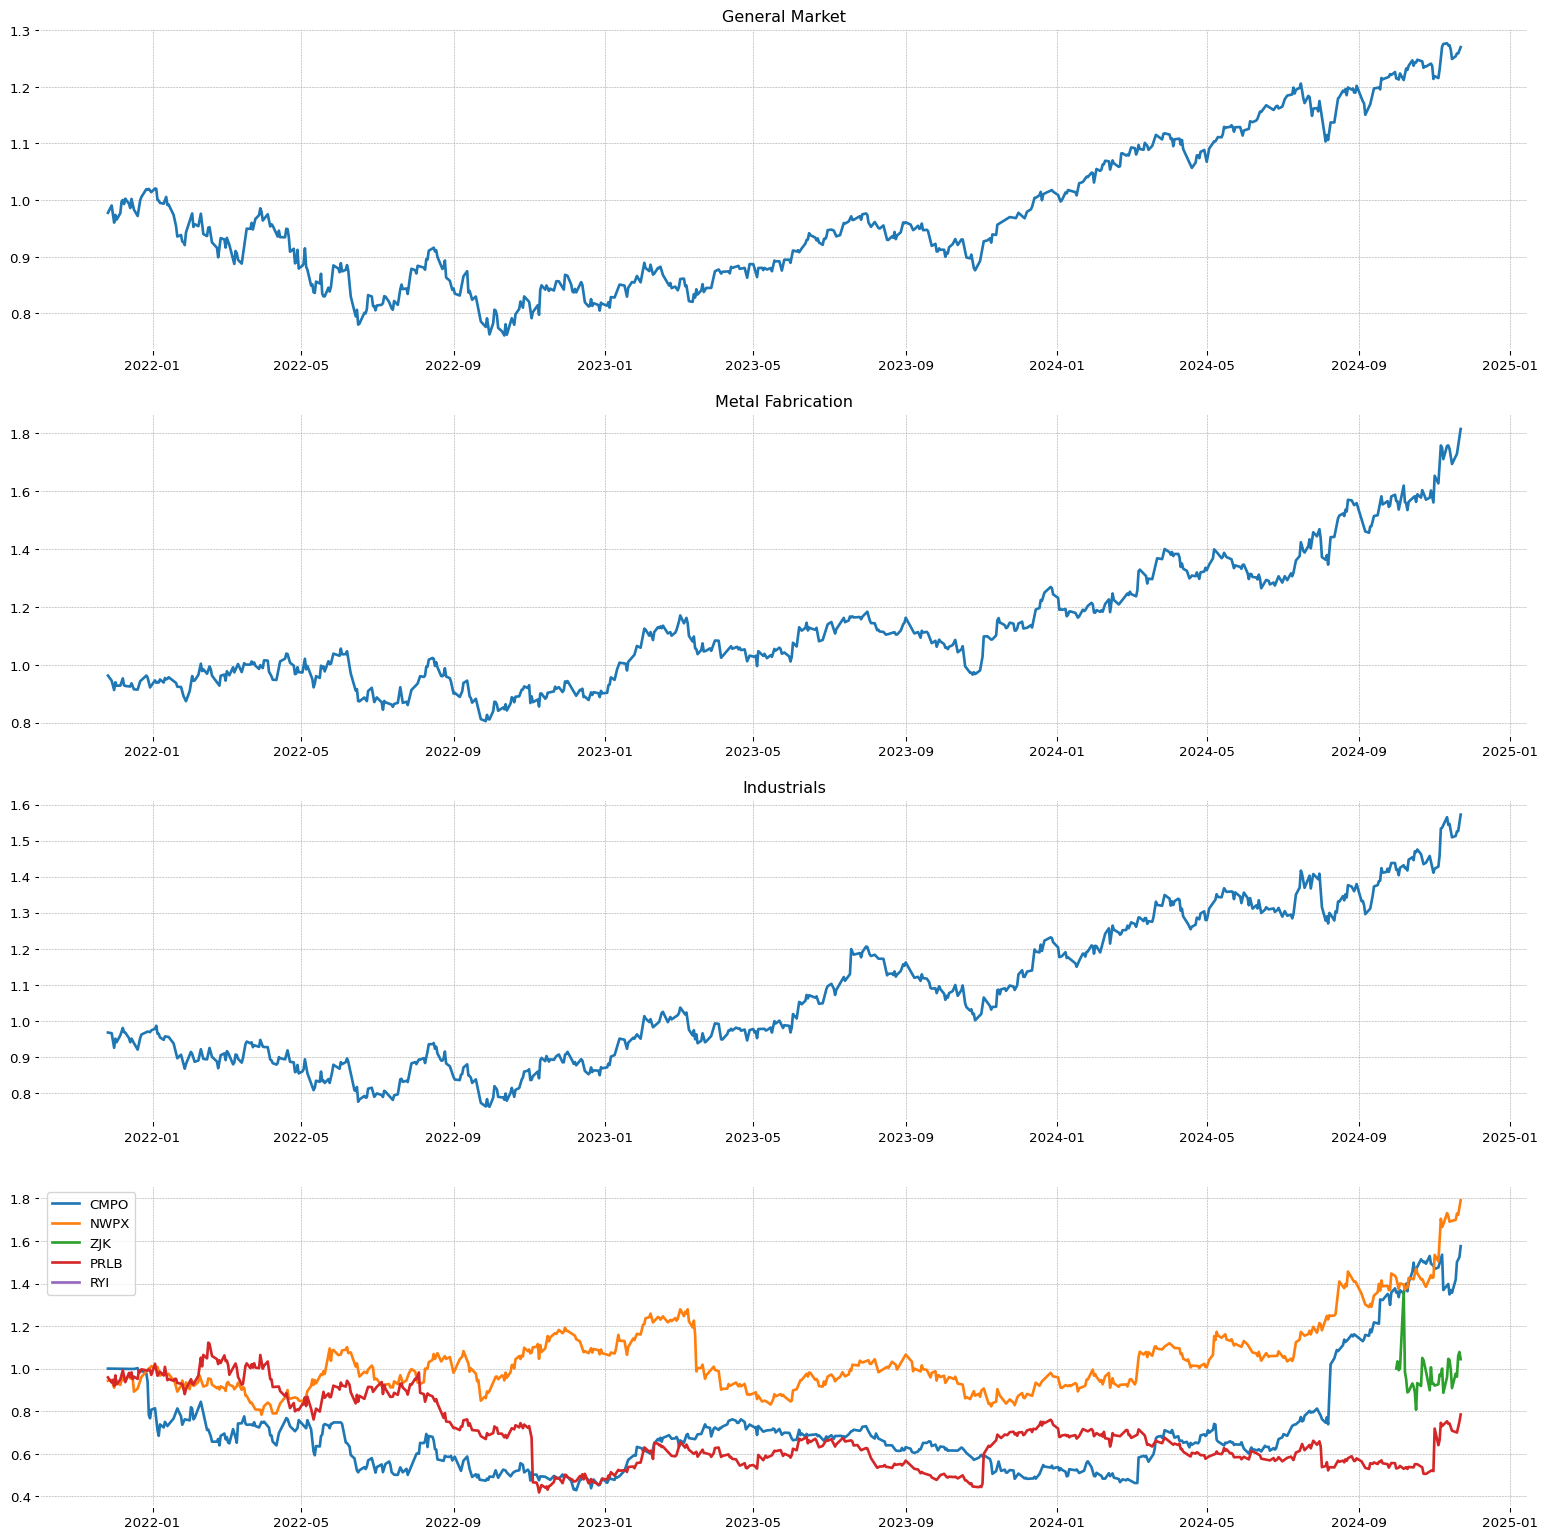 CLBT
CLBT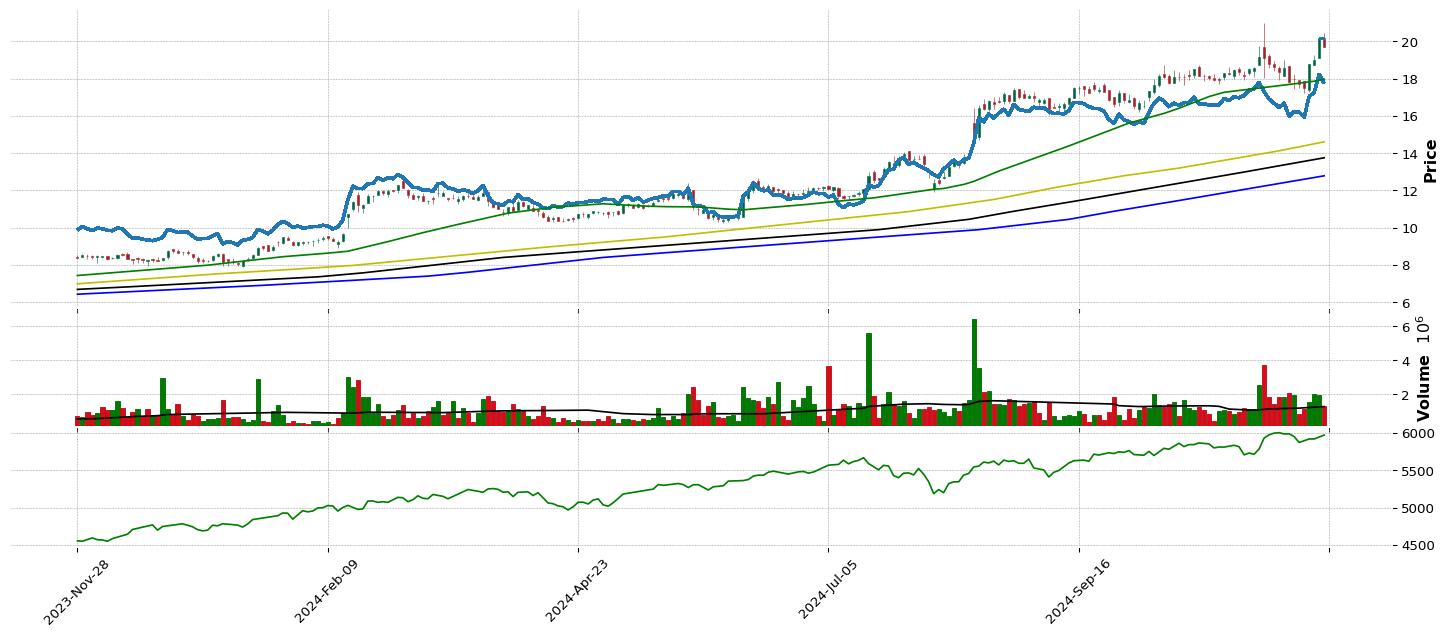
 FTAI
FTAI
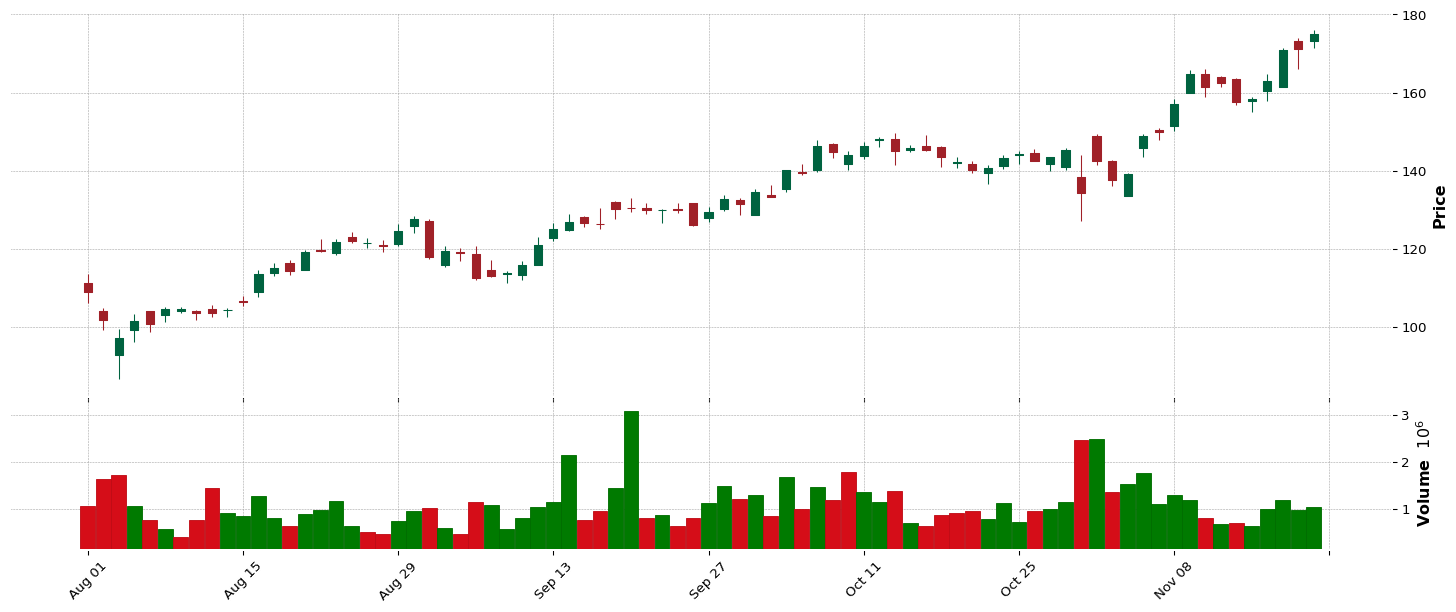
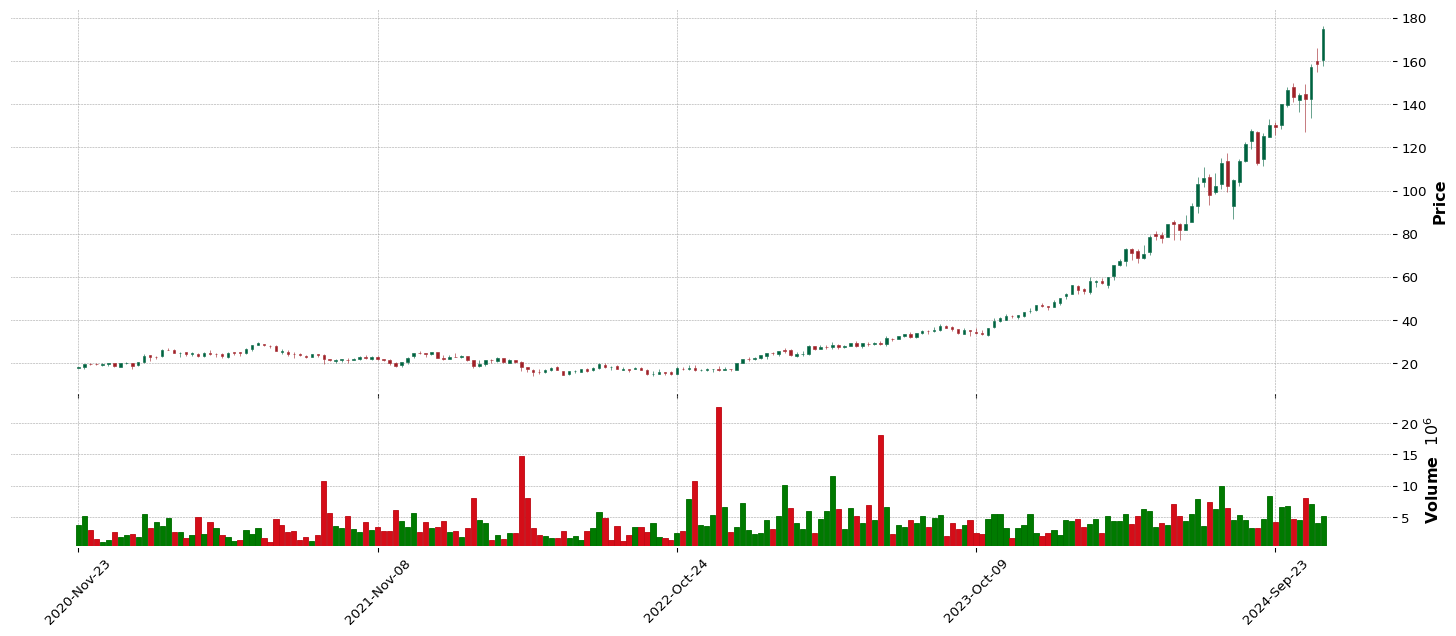
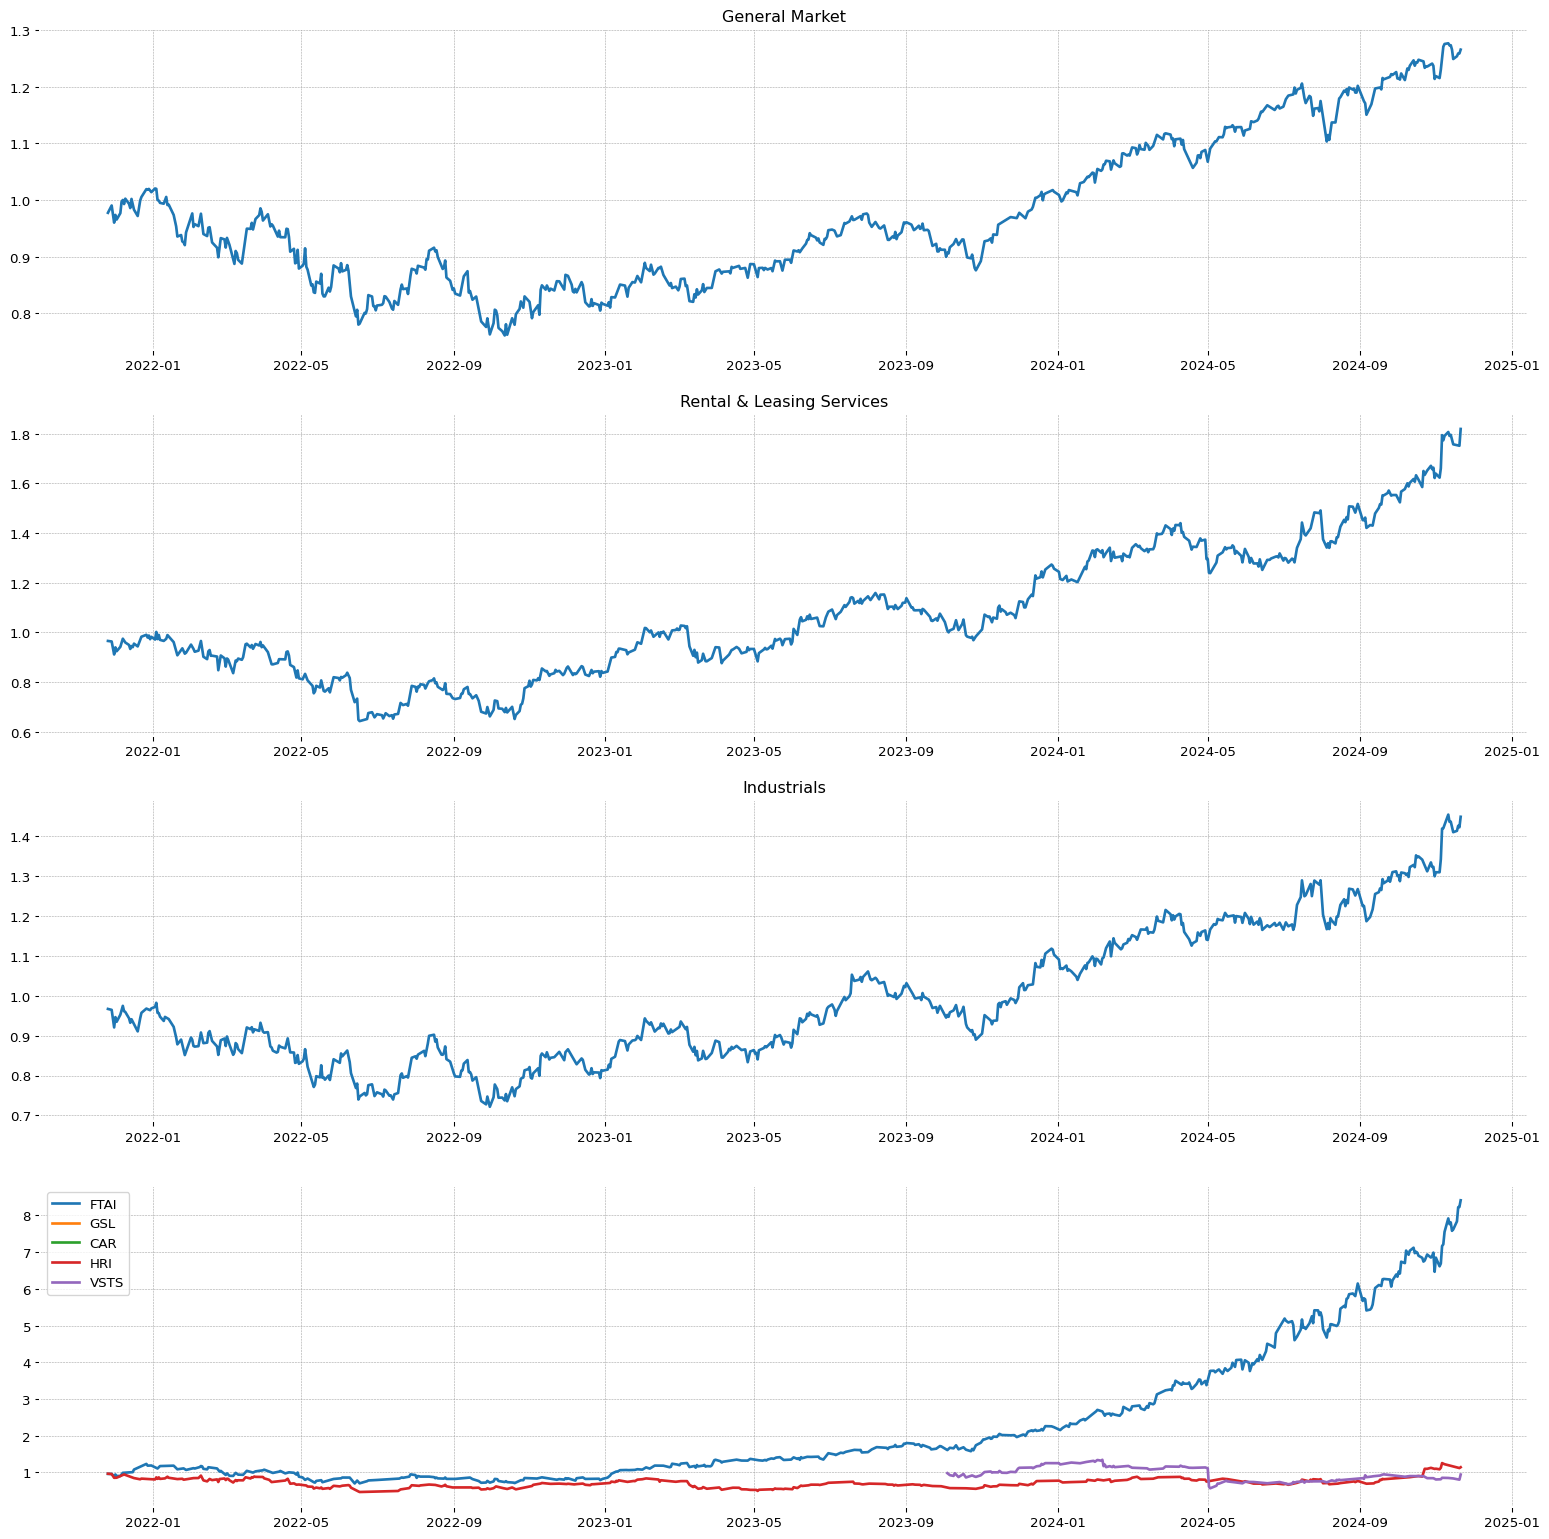 LBPH
LBPH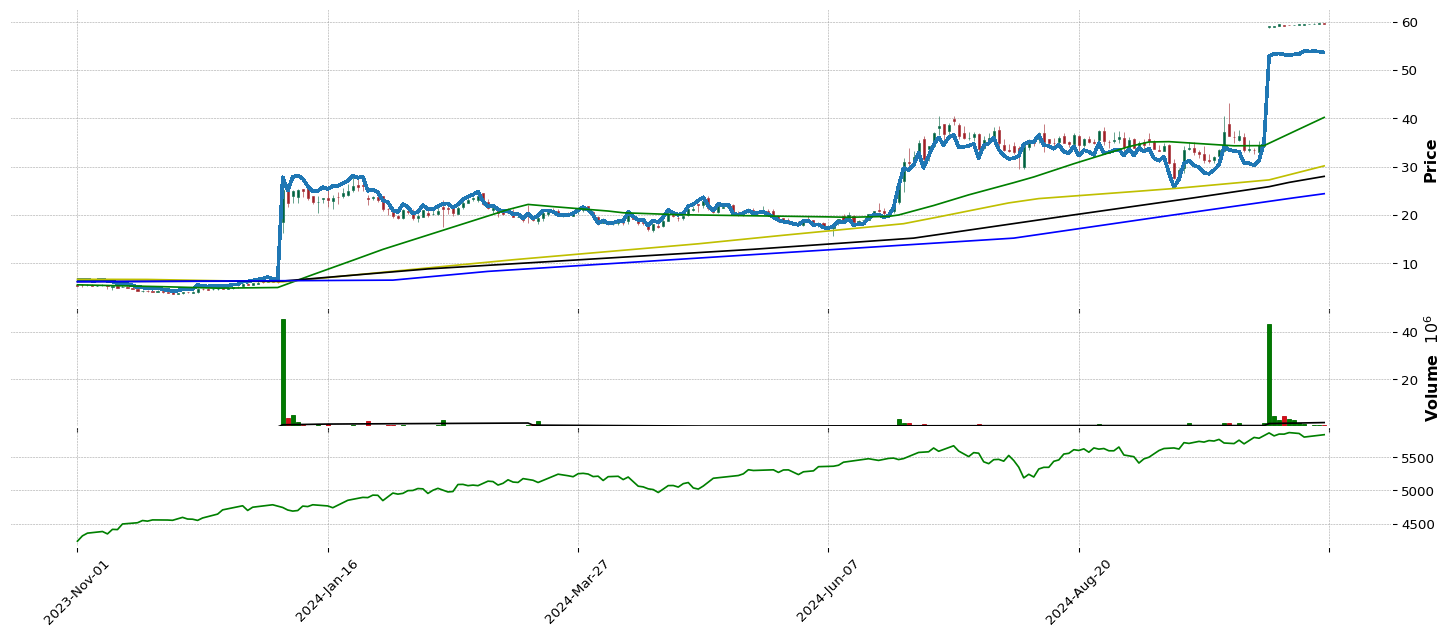
 HWKN
HWKN
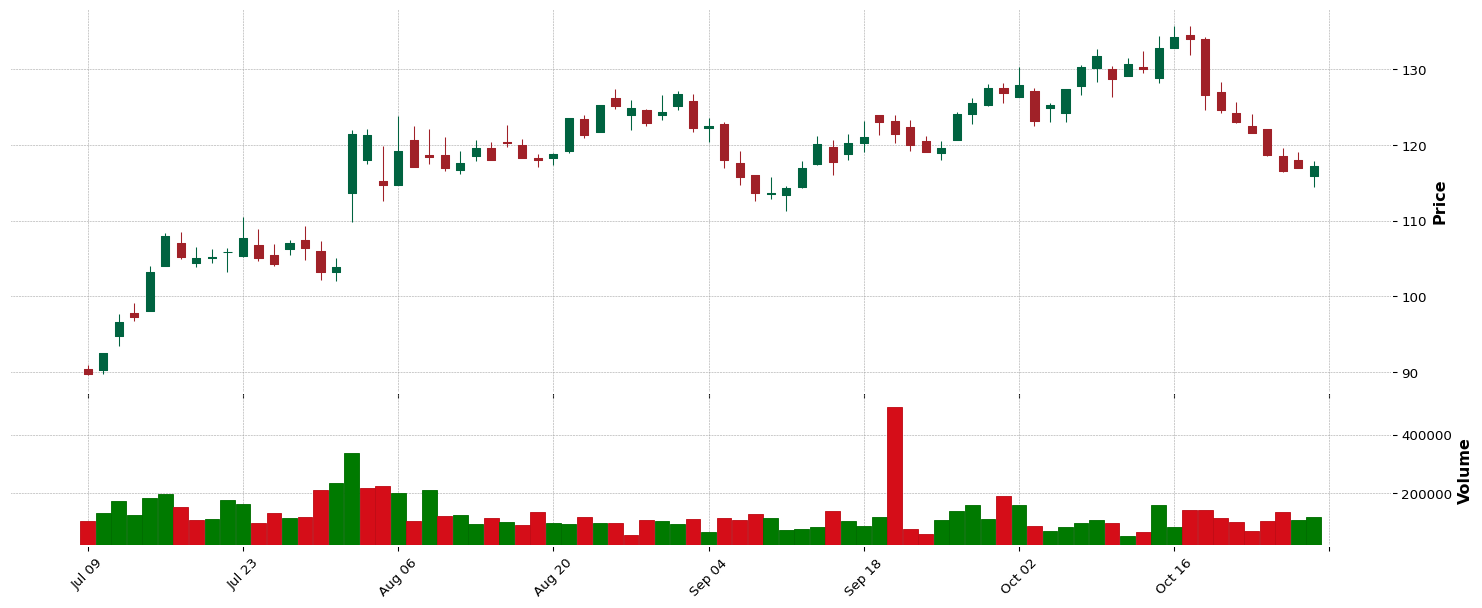
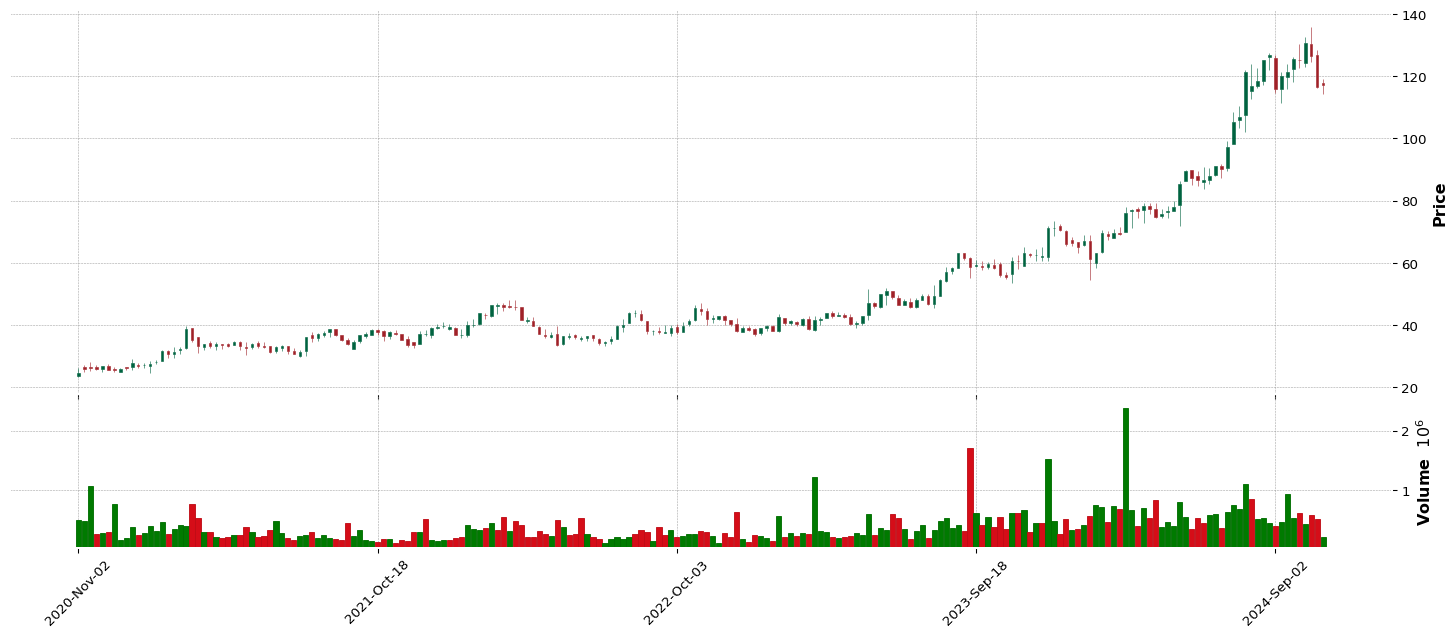
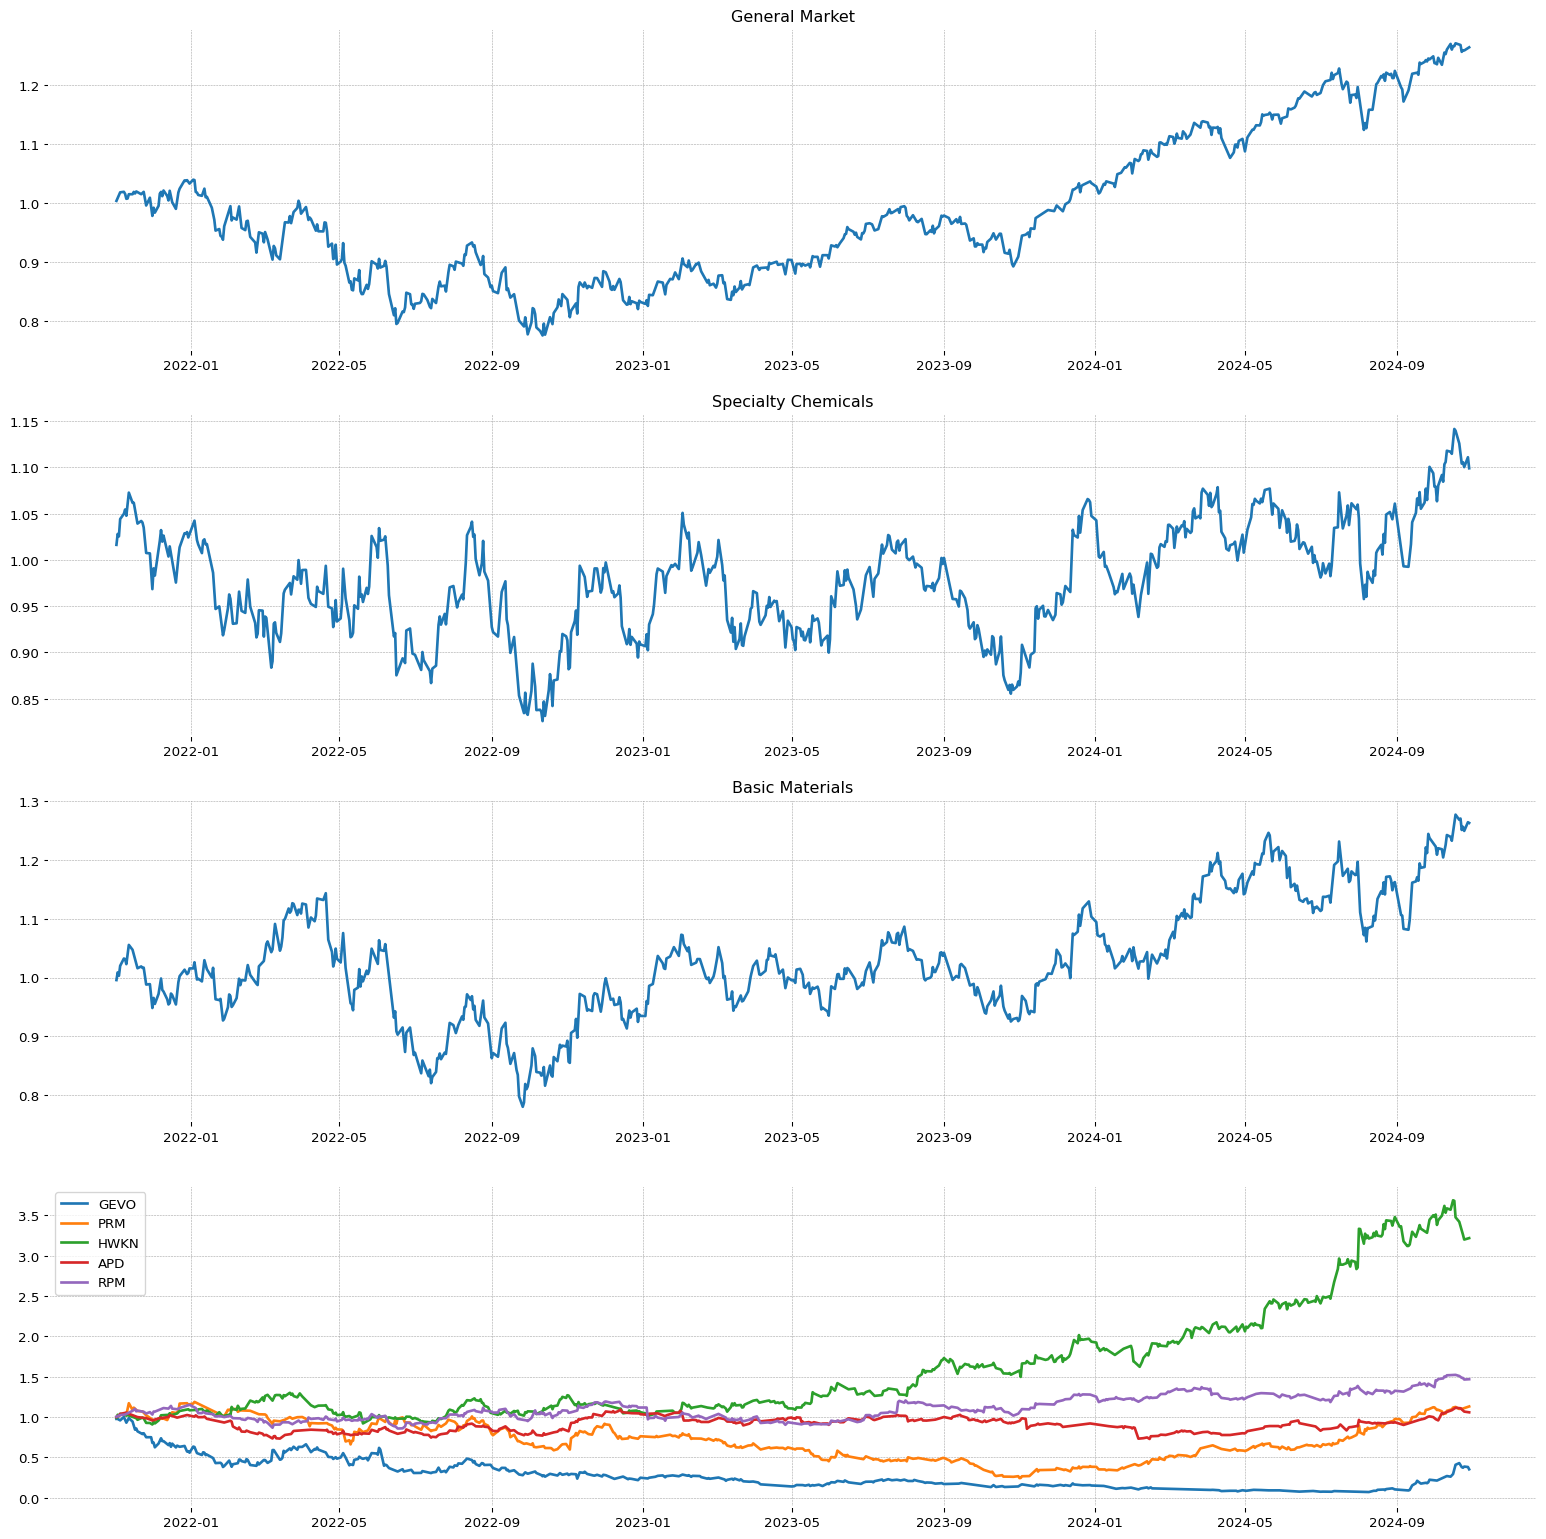 DAVE
DAVE


 FLXS
FLXS


 GDS
GDS


 MAX
MAX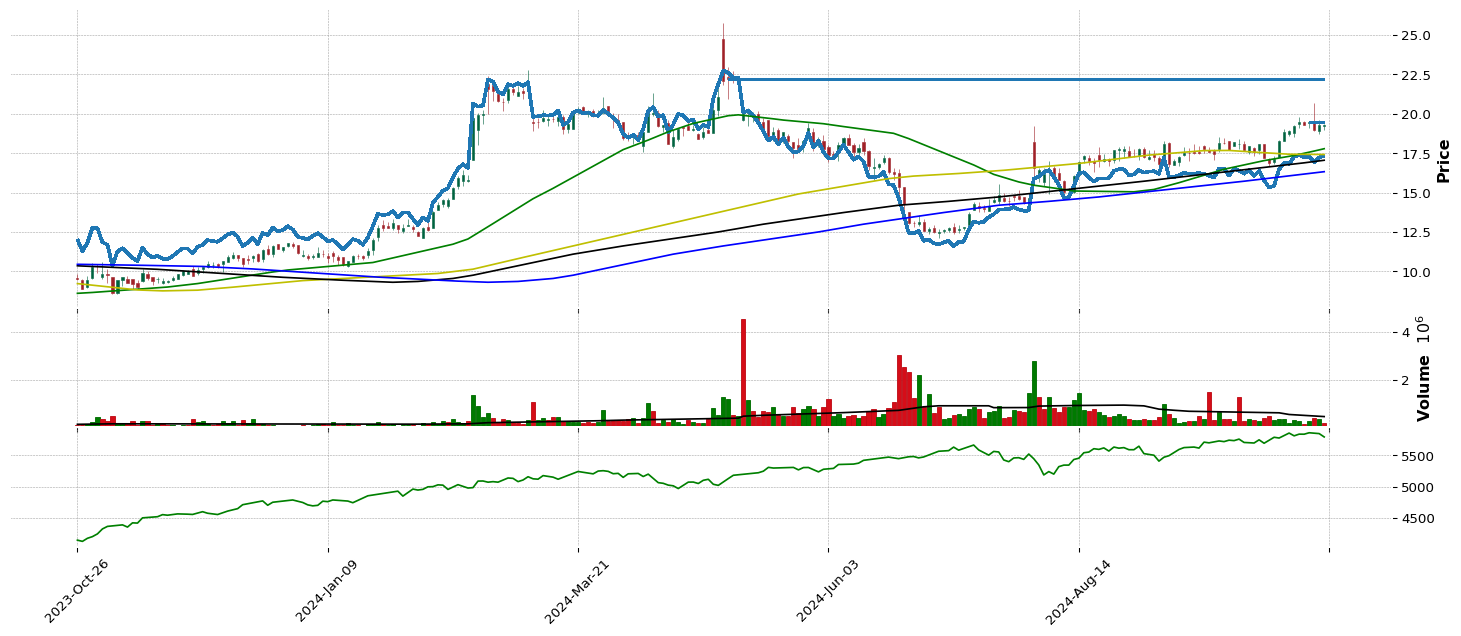
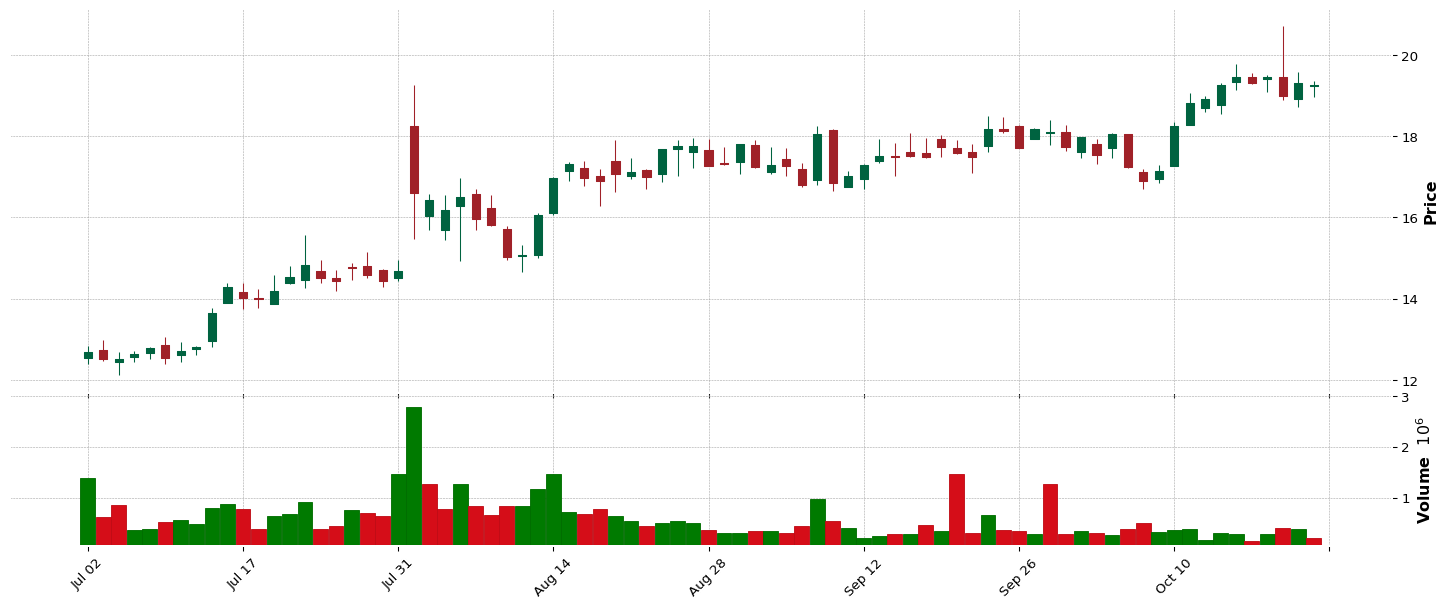
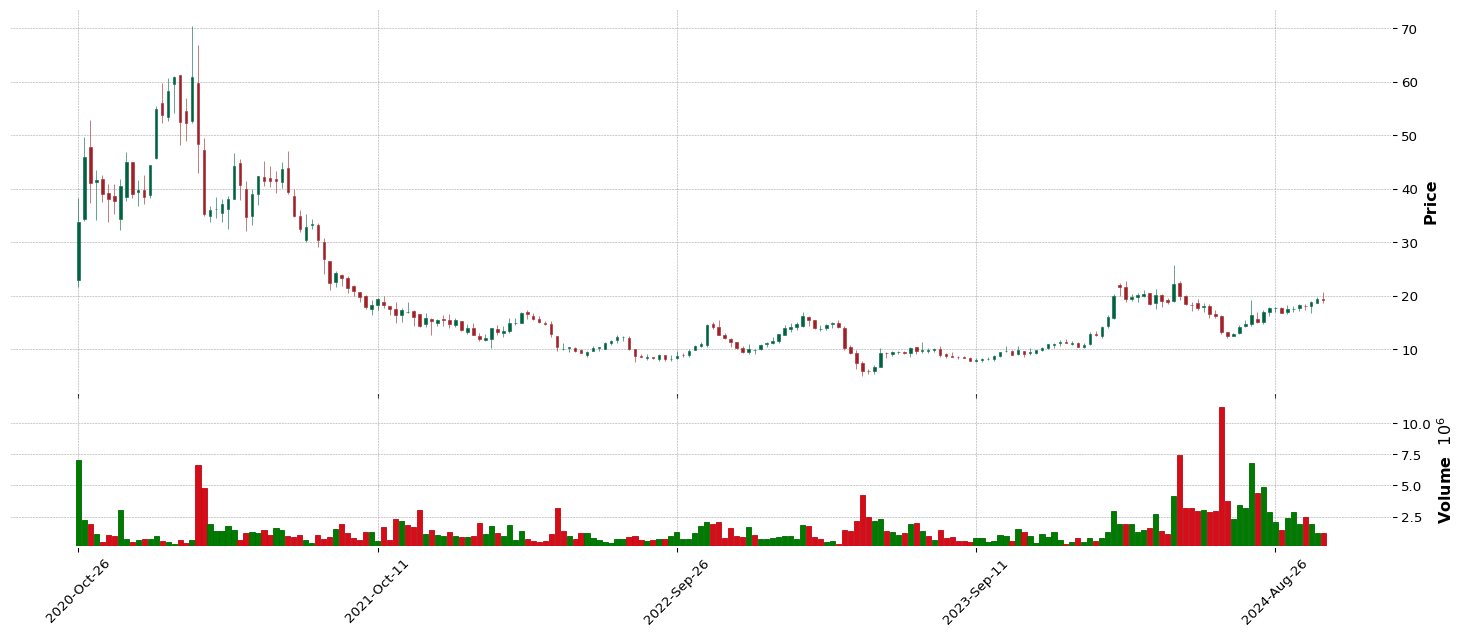
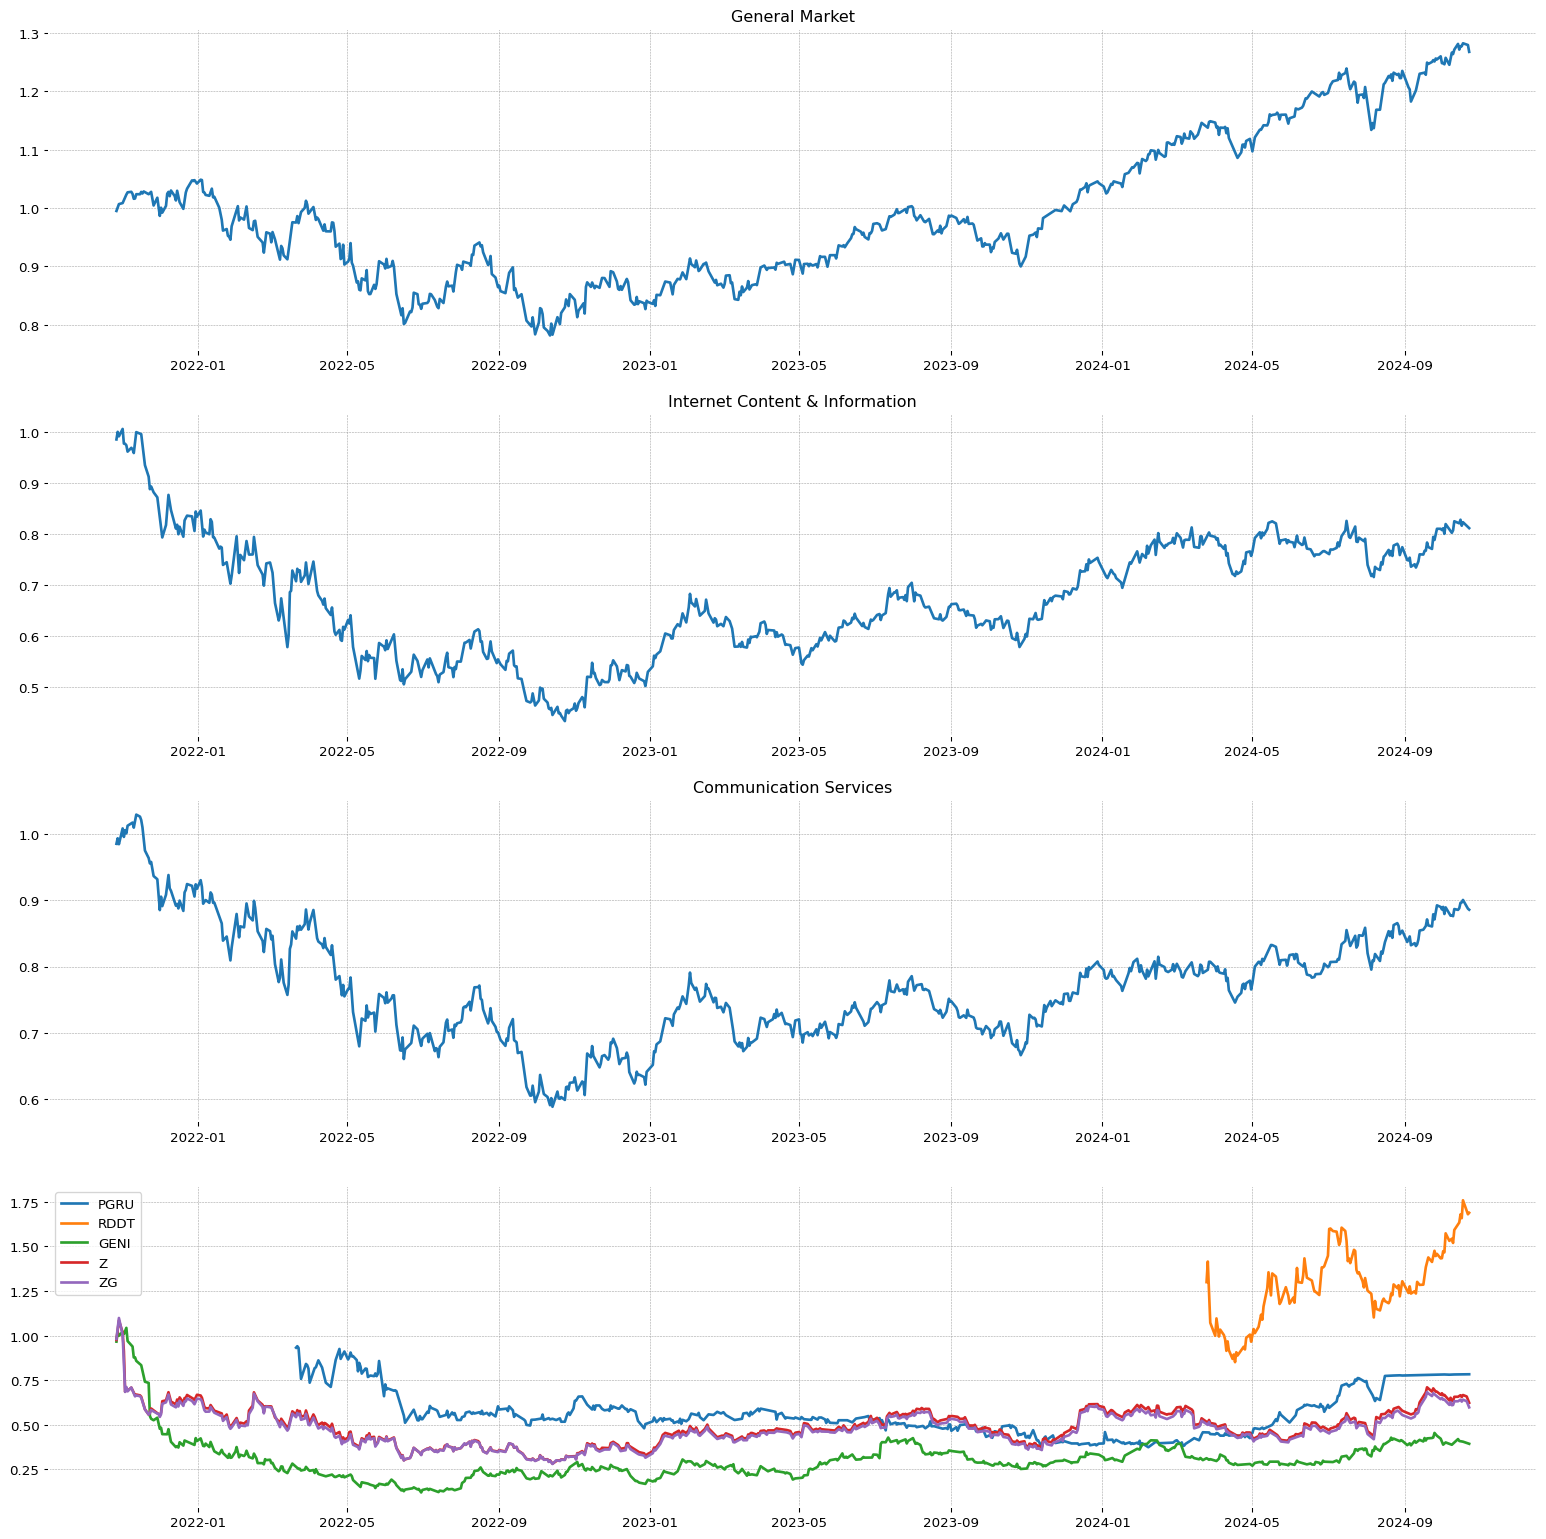 LWAY
LWAY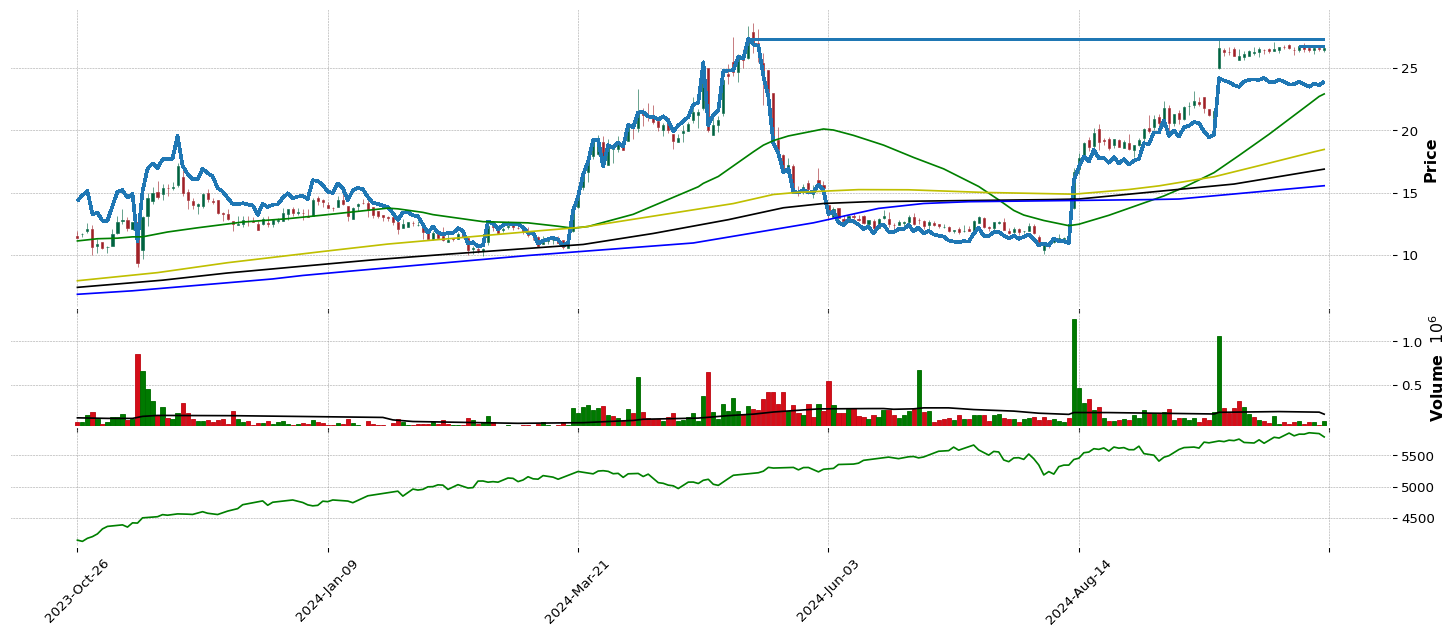
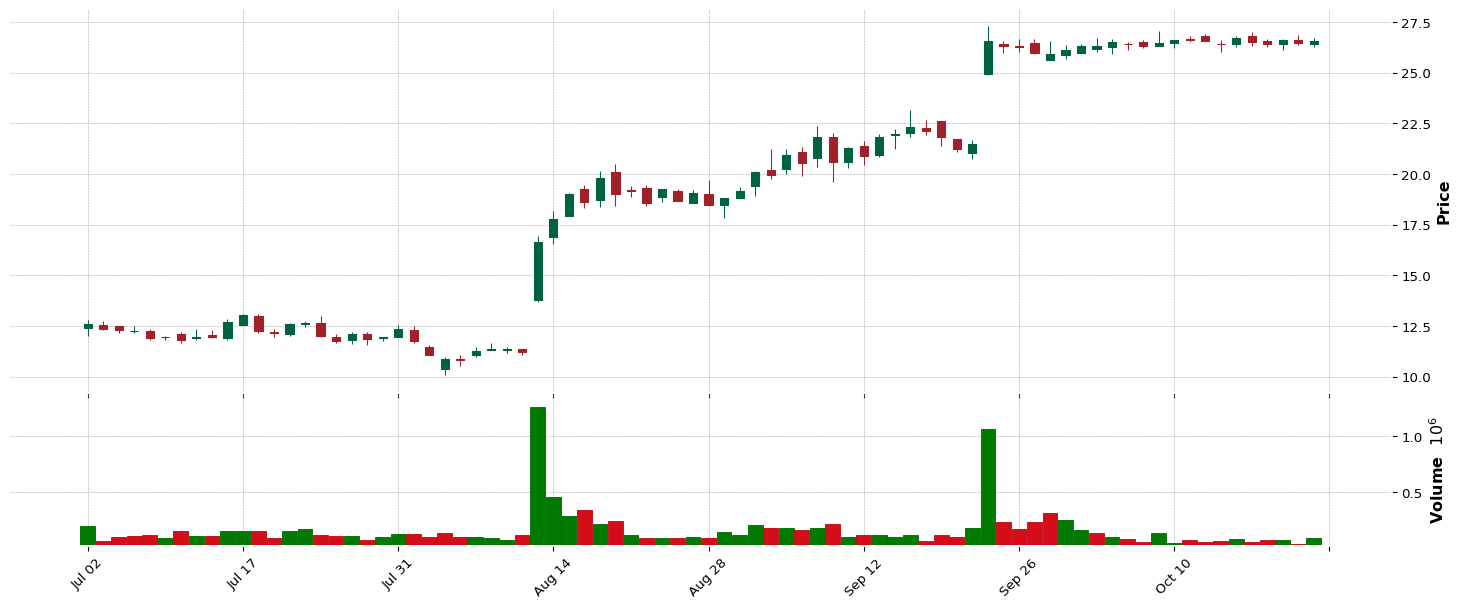
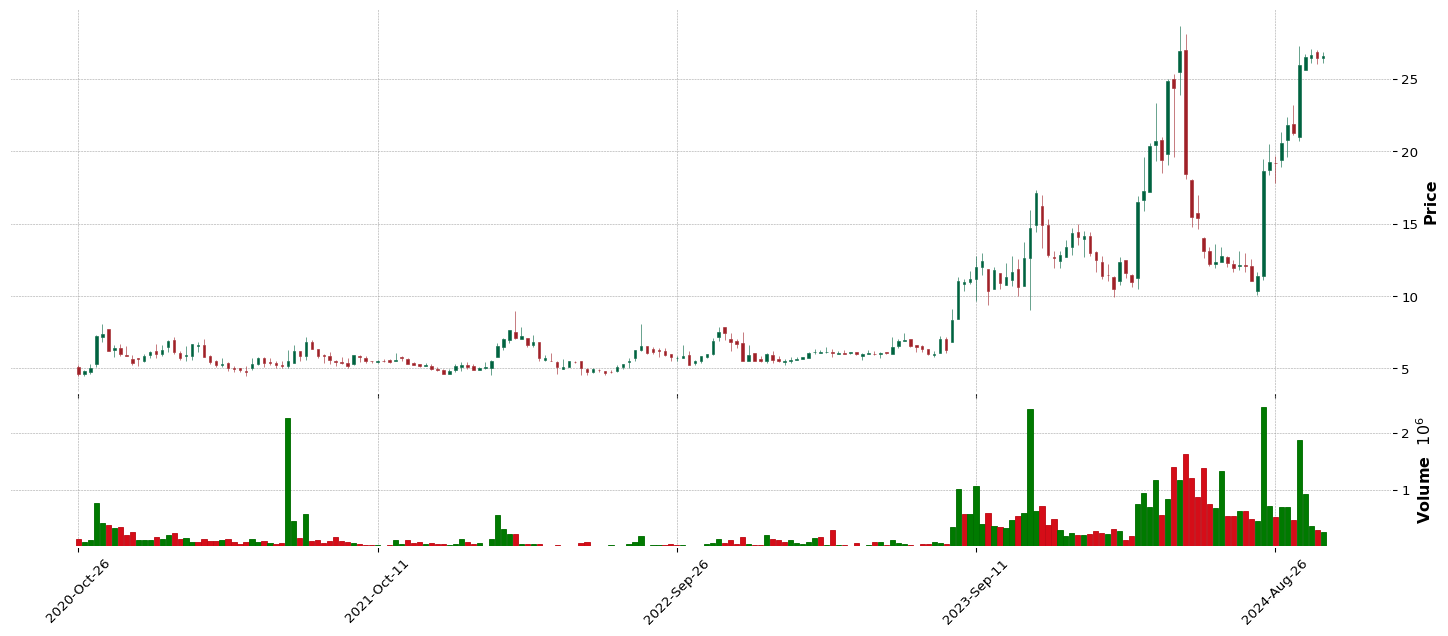
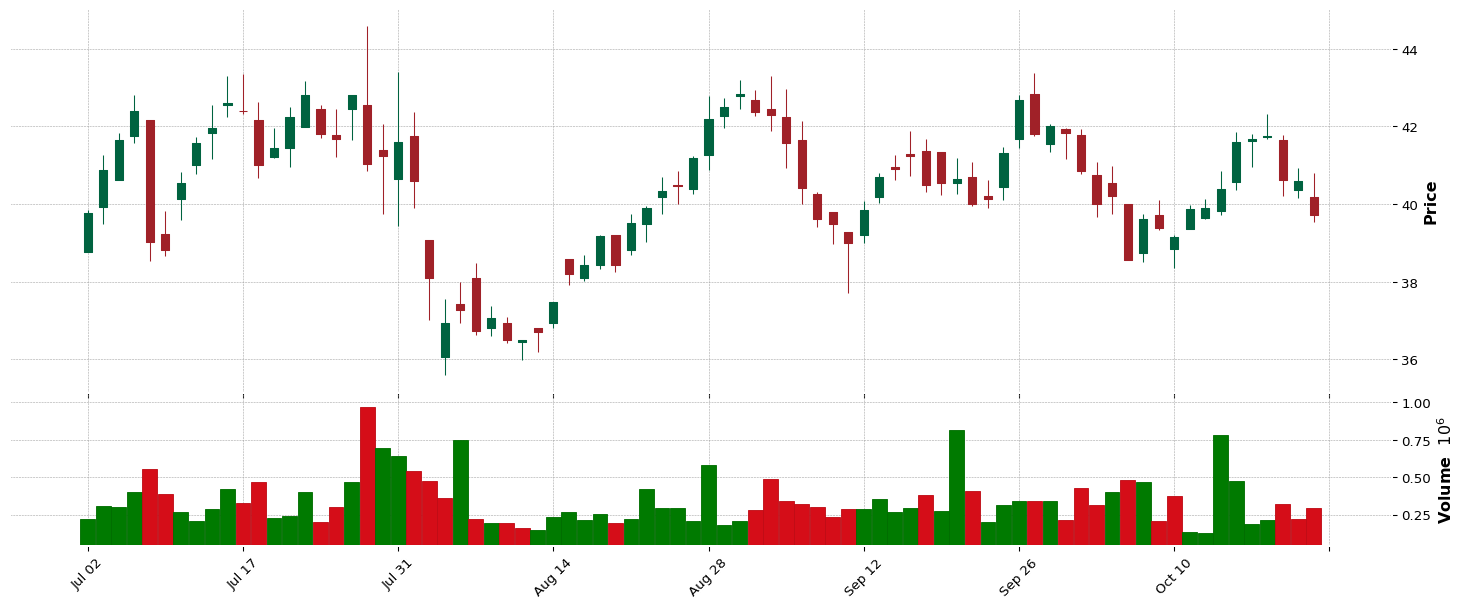
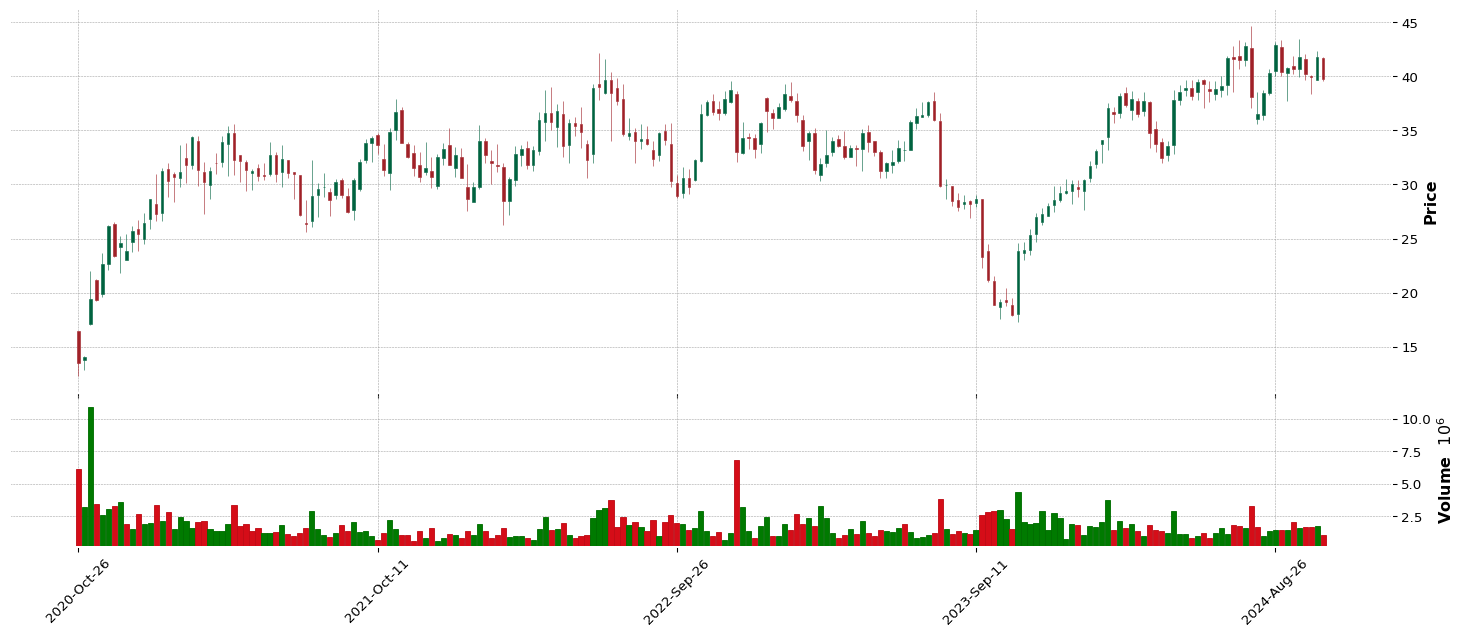
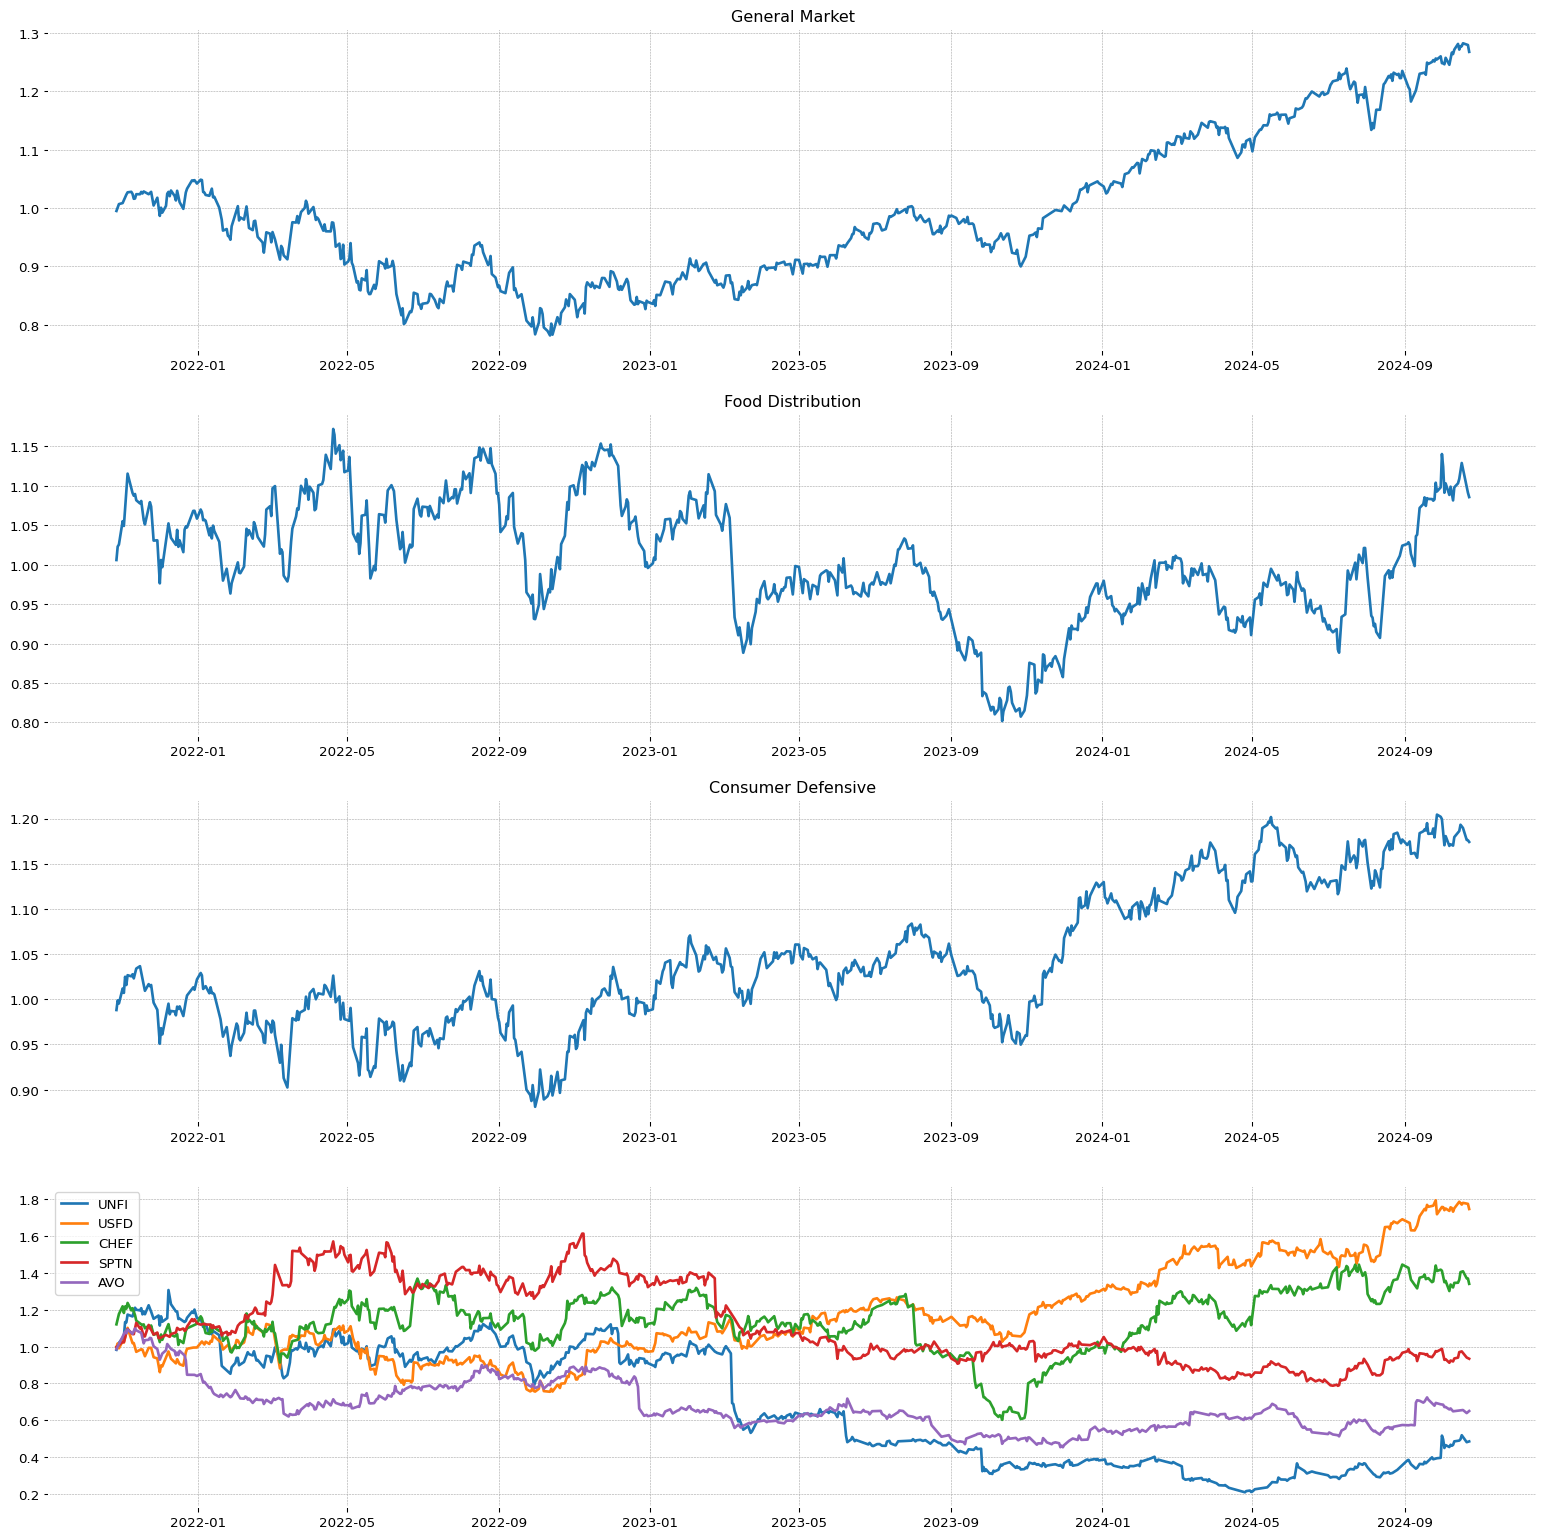
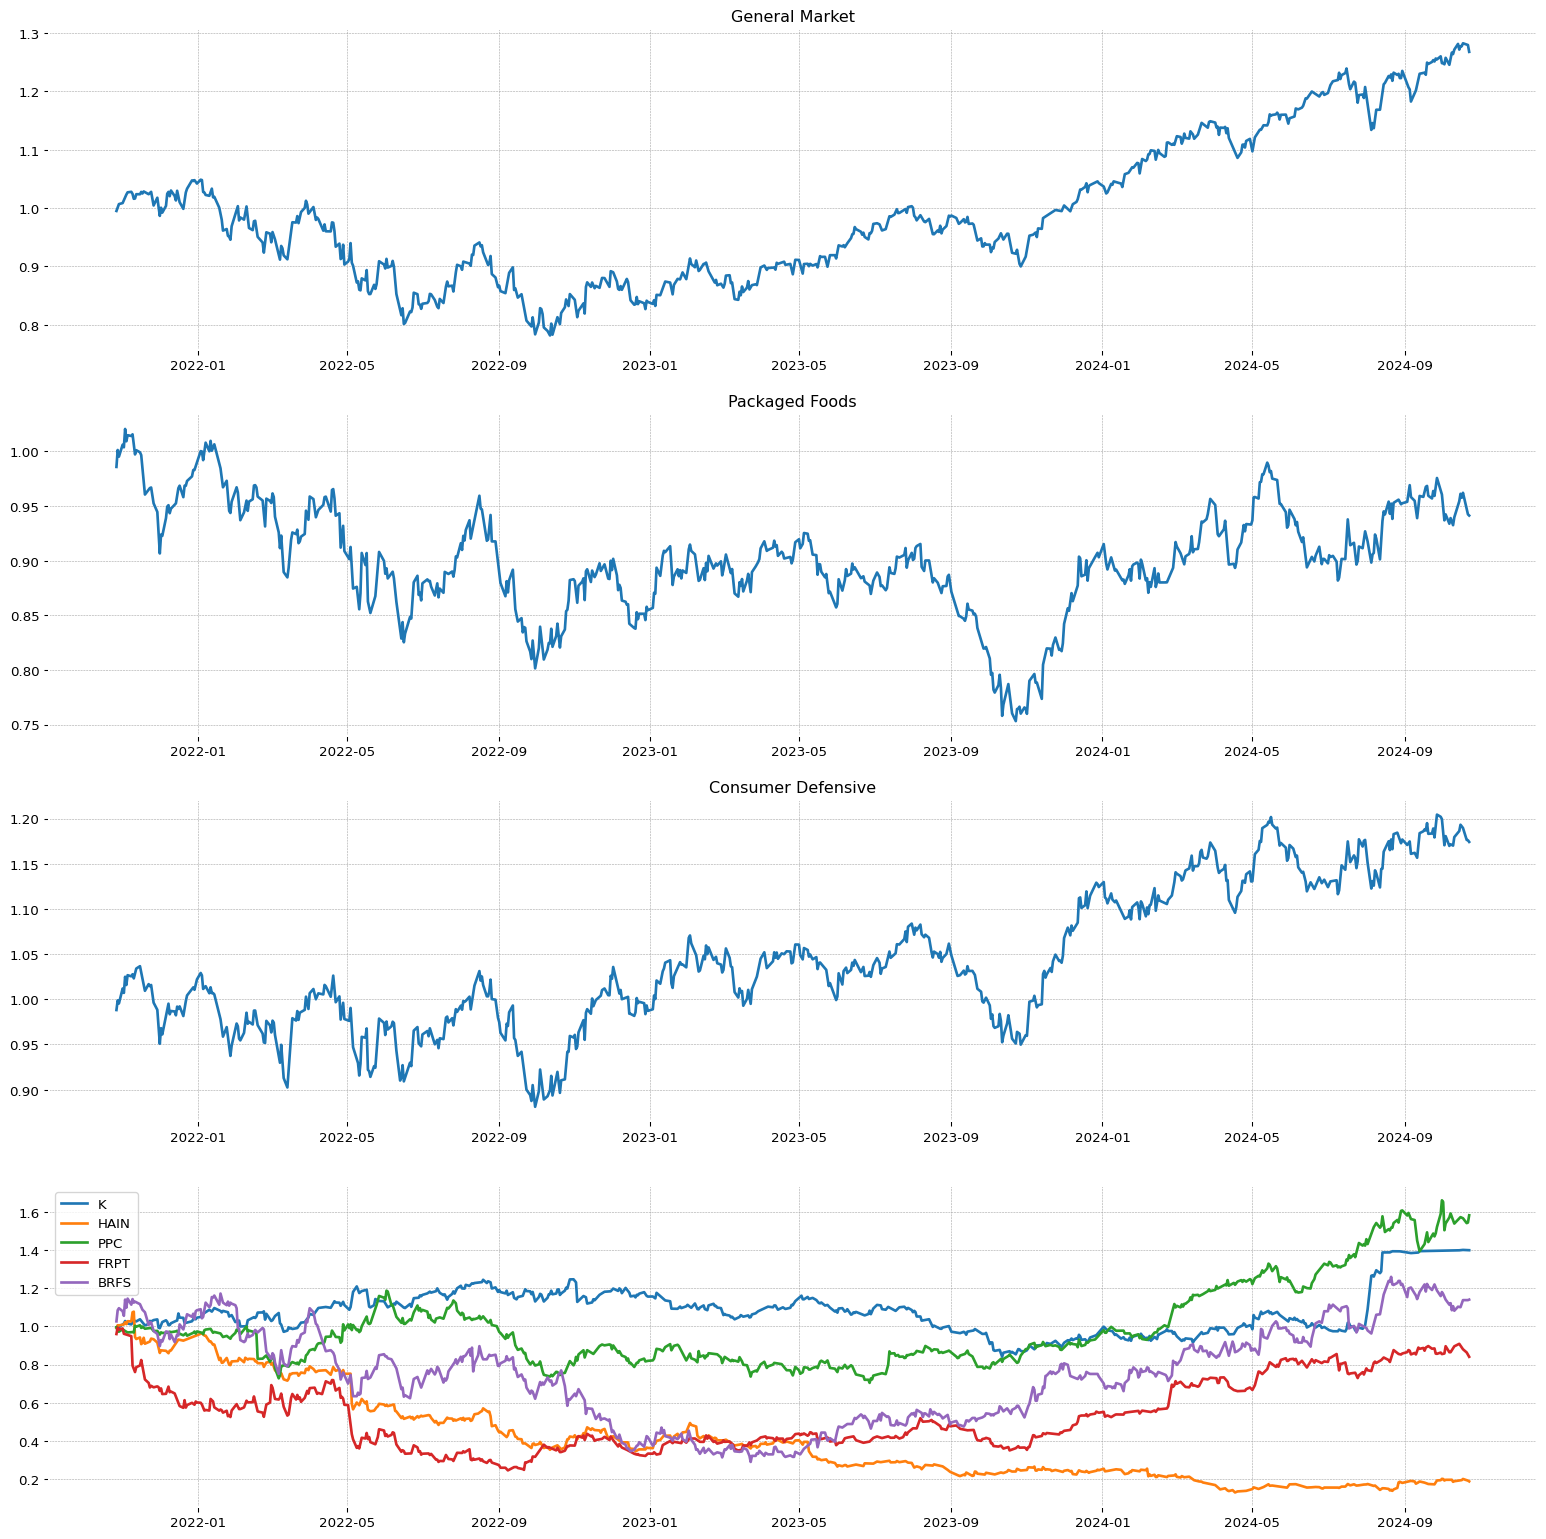 CHEF
CHEF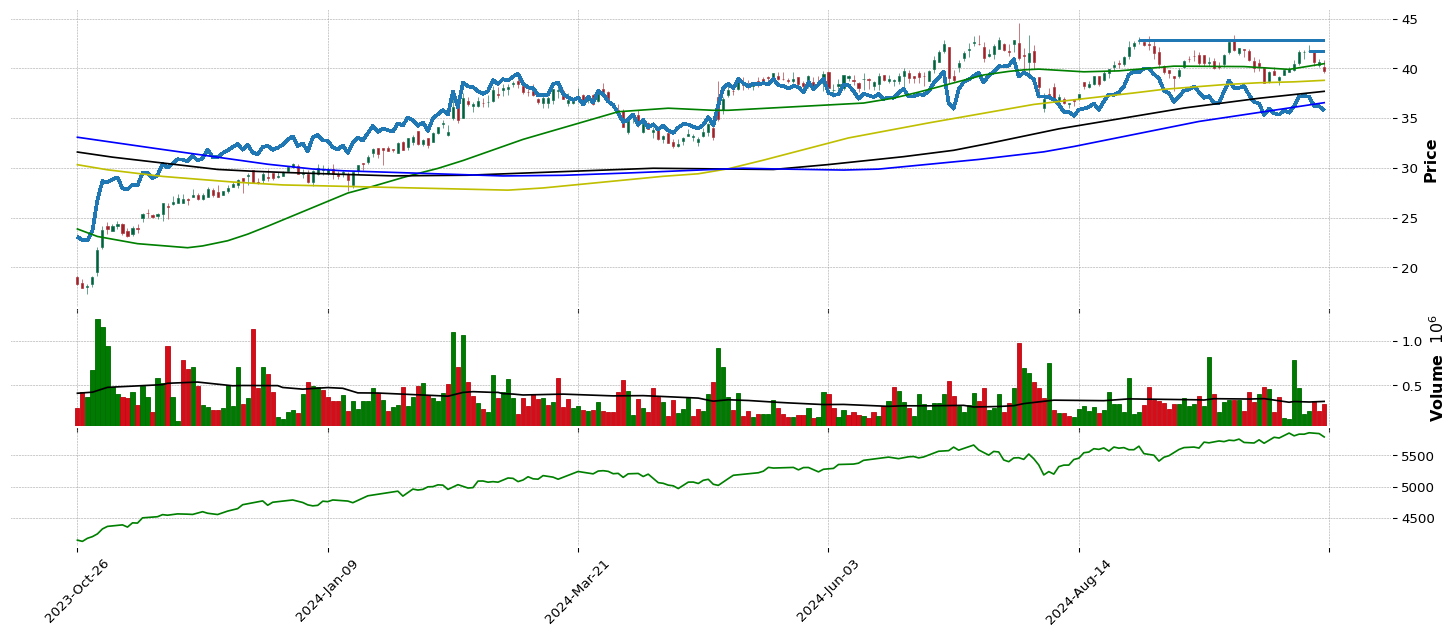
 CRDO
CRDO


