***************************
Market view: 5/7 (if value is >7 be careful)
Best 50 stock divided by Sector
| Sector Name | Valore |
| Healthcare | 27 |
| Technology | 6 |
| Financial | 6 |
| Consumer Cyclical | 6 |
| Basic Materials | 3 |
| Industrials | 1 |
| Communication Services | 1 |
Best 50 stock divided by industry | Industry Name | Valore |
| Biotechnology | 21 |
| Software - Application | 3 |
| Banks - Regional | 3 |
| Communication Equipment | 2 |
| Specialty Retail | 2 |
| Medical Instruments & Supplies | 1 |
| Information Technology Services | 1 |
| Telecom Services | 1 |
| Medical Devices | 1 |
| Leisure | 1 |
| Chemicals | 1 |
| Auto Parts | 1 |
| Credit Services | 1 |
| Restaurants | 1 |
| Specialty Industrial Machinery | 1 |
| Other Precious Metals & Mining | 1 |
| Healthcare Plans | 1 |
| Diagnostics & Research | 1 |
| Health Information Services | 1 |
| Financial Conglomerates | 1 |
| Specialty Chemicals | 1 |
| Drug Manufacturers - Specialty & Generic | 1 |
| Auto & Truck Dealerships | 1 |
| Insurance - Property & Casualty | 1 |
Return of Sector Group (now calculated on 27 weeks instead of 1 year)
| Pos. | |
Name | |
Today | |
3 weeks | |
6 weeks | |
26 weeks | |
1DAY | |
Ytoday | |
1YEAR | |
| 1.0 |
Healthcare |
100.0 |
63.0 |
72.0 |
100.0 |
1.91 |
32.37 |
75.31 |
| 2.0 |
Technology |
90.0 |
54.0 |
54.0 |
81.0 |
1.44 |
14.08 |
43.6 |
| 3.0 |
Financial |
81.0 |
90.0 |
81.0 |
63.0 |
1.56 |
18.61 |
45.84 |
| 4.0 |
Communication Services |
72.0 |
100.0 |
63.0 |
36.0 |
1.67 |
13.33 |
29.48 |
| 5.0 |
Real Estate |
63.0 |
81.0 |
100.0 |
27.0 |
0.39 |
6.41 |
31.71 |
| 6.0 |
Consumer Cyclical |
54.0 |
45.0 |
27.0 |
90.0 |
1.67 |
17.12 |
45.3 |
| 7.0 |
Industrials |
45.0 |
36.0 |
45.0 |
72.0 |
1.49 |
20.44 |
43.4 |
| 8.0 |
Utilities |
36.0 |
72.0 |
90.0 |
18.0 |
1.07 |
13.22 |
28.25 |
| 9.0 |
Basic Materials |
27.0 |
18.0 |
36.0 |
54.0 |
1.1 |
14.73 |
37.04 |
| 10.0 |
Consumer Defensive |
18.0 |
27.0 |
18.0 |
45.0 |
1.33 |
7.23 |
25.16 |
Best 50 Stock Industry Group
| Pos. | |
Name | |
Today | |
3 weeks | |
6 weeks | |
26 weeks | |
1DAY | |
Ytoday | |
1YEAR | |
|| |
Pos. | |
Name | |
Today | |
3 weeks | |
6 weeks | |
26 weeks | |
1DAY | |
7DAY | |
30DAY | |
Ytoday | |
1YEAR | |
Ratio_GP | |
Ratio_NI | |
ROE | |
| 1.0 |
Communication Equipment |
100.0 |
100.0 |
100.0 |
64.0 |
1.07 |
48.07 |
98.14 |
34.41 |
-7.57 |
6.03 |
|| |
26.0 |
Metal Fabrication |
82.0 |
87.0 |
87.0 |
61.0 |
2.67 |
38.09 |
63.53% |
25.74 |
4.5 |
8.24 |
| 2.0 |
Healthcare Plans |
99.0 |
99.0 |
99.0 |
55.0 |
-0.59 |
32.68 |
50.64 |
47.73 |
0.29 |
-5.42 |
|| |
27.0 |
REIT - Healthcare Facilities |
82.0 |
94.0 |
93.0 |
24.0 |
0.52 |
10.45 |
27.02% |
49.02 |
1.43 |
1.48 |
| 3.0 |
Leisure |
98.0 |
97.0 |
93.0 |
76.0 |
-0.44 |
48.56 |
64.98 |
44.23 |
-0.83 |
-10.35 |
|| |
28.0 |
Insurance - Specialty |
81.0 |
76.0 |
82.0 |
49.0 |
1.31 |
27.86 |
49.55% |
83.57 |
25.44 |
6.08 |
| 4.0 |
Pollution & Treatment Controls |
97.0 |
95.0 |
88.0 |
85.0 |
-0.49 |
68.1 |
82.03 |
31.96 |
7.59 |
8.79 |
|| |
29.0 |
Aerospace & Defense |
80.0 |
80.0 |
63.0 |
59.0 |
0.85 |
35.1 |
52.46% |
26.49 |
-6.1 |
7.44 |
| 5.0 |
Utilities - Independent Power Producers |
97.0 |
98.0 |
97.0 |
97.0 |
1.37 |
94.36 |
137.41 |
30.83 |
16.36 |
20.5 |
|| |
30.0 |
Drug Manufacturers - Specialty & Generic |
80.0 |
70.0 |
74.0 |
60.0 |
1.52 |
22.25 |
48.26% |
54.78 |
-8.76 |
5.24 |
| 6.0 |
Capital Markets |
96.0 |
92.0 |
80.0 |
94.0 |
4.48 |
27.95 |
75.24 |
50.67 |
12.53 |
4.11 |
|| |
31.0 |
Gold |
79.0 |
55.0 |
95.0 |
61.0 |
-0.45 |
33.31 |
53.84% |
28.78 |
1.37 |
-0.29 |
| 7.0 |
Silver |
95.0 |
44.0 |
98.0 |
75.0 |
2.01 |
60.3 |
82.65 |
16.13 |
2.14 |
2.31 |
|| |
32.0 |
Furnishings, Fixtures & Appliances |
78.0 |
68.0 |
78.0 |
39.0 |
1.38 |
30.4 |
53.53% |
35.81 |
-0.99 |
16.71 |
| 8.0 |
Thermal Coal |
95.0 |
97.0 |
60.0 |
6.0 |
1.35 |
10.16 |
11.74 |
37.86 |
45.64 |
27.18 |
|| |
33.0 |
Financial Data & Stock Exchanges |
78.0 |
63.0 |
57.0 |
72.0 |
1.06 |
16.9 |
50.89% |
62.02 |
24.95 |
5.31 |
| 9.0 |
Electrical Equipment & Parts |
94.0 |
84.0 |
43.0 |
40.0 |
2.61 |
30.33 |
40.56 |
7.54 |
-16.5 |
7.38 |
|| |
34.0 |
Auto & Truck Dealerships |
77.0 |
87.0 |
53.0 |
68.0 |
2.46 |
15.38 |
55.77% |
28.26 |
-1.4 |
28.75 |
| 10.0 |
Information Technology Services |
93.0 |
91.0 |
72.0 |
27.0 |
1.35 |
15.17 |
40.07 |
30.4 |
-4.61 |
24.88 |
|| |
35.0 |
Food Distribution |
76.0 |
77.0 |
48.0 |
34.0 |
1.81 |
12.26 |
32.4% |
13.8 |
0.85 |
14.43 |
| 11.0 |
Publishing |
93.0 |
96.0 |
96.0 |
57.0 |
1.68 |
38.4 |
44.0 |
36.84 |
-9.99 |
26.06 |
|| |
36.0 |
Gambling |
76.0 |
74.0 |
82.0 |
82.0 |
0.42 |
36.64 |
47.22% |
52.61 |
2.41 |
-2.89 |
| 12.0 |
Specialty Retail |
92.0 |
75.0 |
44.0 |
100.0 |
2.02 |
62.54 |
102.7 |
39.61 |
1.94 |
8.69 |
|| |
37.0 |
Grocery Stores |
75.0 |
69.0 |
83.0 |
19.0 |
1.74 |
23.72 |
28.54% |
29.63 |
3.57 |
12.7 |
| 13.0 |
Other Precious Metals & Mining |
91.0 |
55.0 |
97.0 |
88.0 |
-0.46 |
66.13 |
85.67 |
17.98 |
-12.05 |
-6.92 |
|| |
38.0 |
Insurance - Diversified |
74.0 |
71.0 |
61.0 |
46.0 |
1.26 |
30.25 |
44.33% |
63.89 |
27.93 |
11.13 |
| 14.0 |
Medical Care Facilities |
91.0 |
82.0 |
85.0 |
63.0 |
1.26 |
21.08 |
54.38 |
26.73 |
-1.9 |
38.82 |
|| |
39.0 |
Electronic Components |
74.0 |
64.0 |
72.0 |
84.0 |
0.94 |
21.7 |
44.4% |
28.45 |
5.96 |
11.87 |
| 15.0 |
Real Estate Services |
90.0 |
90.0 |
95.0 |
69.0 |
1.08 |
24.95 |
68.77 |
32.38 |
-2.9 |
-5.36 |
|| |
40.0 |
Specialty Industrial Machinery |
73.0 |
42.0 |
28.0 |
74.0 |
2.3 |
23.33 |
47.37% |
30.67 |
0.52 |
15.76 |
| 16.0 |
Travel Services |
89.0 |
59.0 |
46.0 |
86.0 |
2.07 |
30.9 |
75.41 |
53.89 |
25.61 |
17.43 |
|| |
41.0 |
Uranium |
72.0 |
22.0 |
4.0 |
9.0 |
3.21 |
14.53 |
20.22% |
543.5 |
-28.55 |
-10.03 |
| 17.0 |
Credit Services |
89.0 |
70.0 |
66.0 |
89.0 |
2.22 |
44.6 |
111.9 |
72.1 |
13.61 |
14.87 |
|| |
42.0 |
Residential Construction |
72.0 |
89.0 |
89.0 |
87.0 |
1.52 |
19.64 |
74.57% |
30.22 |
12.41 |
22.88 |
| 18.0 |
Electronic Gaming & Multimedia |
88.0 |
95.0 |
70.0 |
53.0 |
1.48 |
30.49 |
38.09 |
58.16 |
-4.9 |
-24.2 |
|| |
43.0 |
Tobacco |
71.0 |
88.0 |
56.0 |
29.0 |
1.24 |
10.06 |
29.86% |
45.54 |
8.77 |
-32.24 |
| 19.0 |
Biotechnology |
87.0 |
63.0 |
71.0 |
95.0 |
2.74 |
47.29 |
101.74 |
43.17 |
464.83 |
4.65 |
|| |
44.0 |
Electronics & Computer Distribution |
70.0 |
80.0 |
78.0 |
67.0 |
0.85 |
23.04 |
46.71% |
14.08 |
2.56 |
12.49 |
| 20.0 |
Insurance Brokers |
87.0 |
93.0 |
87.0 |
57.0 |
0.86 |
31.16 |
46.23 |
44.15 |
8.36 |
5.37 |
|| |
45.0 |
REIT - Retail |
70.0 |
72.0 |
81.0 |
29.0 |
0.82 |
9.79 |
30.47% |
58.26 |
23.59 |
6.3 |
| 21.0 |
Engineering & Construction |
86.0 |
91.0 |
85.0 |
90.0 |
0.8 |
49.1 |
73.25 |
23.74 |
4.22 |
11.81 |
|| |
46.0 |
Consulting Services |
69.0 |
74.0 |
68.0 |
54.0 |
0.9 |
27.6 |
37.52% |
38.78 |
10.53 |
26.4 |
| 22.0 |
Banks - Regional |
85.0 |
86.0 |
90.0 |
38.0 |
3.04 |
17.18 |
51.75 |
89.74 |
16.62 |
10.78 |
|| |
47.0 |
Internet Retail |
68.0 |
78.0 |
33.0 |
92.0 |
2.28 |
21.24 |
61.01% |
41.75 |
-1.66 |
12.96 |
| 23.0 |
Telecom Services |
85.0 |
85.0 |
80.0 |
10.0 |
0.45 |
11.22 |
24.35 |
46.15 |
0.79 |
54.33 |
|| |
48.0 |
Diagnostics & Research |
68.0 |
85.0 |
91.0 |
85.0 |
1.92 |
10.8 |
50.17% |
42.0 |
-14.32 |
-4.99 |
| 24.0 |
Personal Services |
84.0 |
93.0 |
92.0 |
72.0 |
0.64 |
25.73 |
51.7 |
39.27 |
11.19 |
120.74 |
|| |
49.0 |
Luxury Goods |
67.0 |
89.0 |
5.0 |
79.0 |
-0.83 |
28.15 |
56.64% |
52.46 |
5.82 |
16.75 |
| 25.0 |
REIT - Office |
83.0 |
81.0 |
84.0 |
41.0 |
0.1 |
15.76 |
50.75 |
41.45 |
-2.83 |
-3.63 |
|| |
50.0 |
Insurance - Life |
66.0 |
65.0 |
50.0 |
45.0 |
1.15 |
19.24 |
41.14% |
88.24 |
10.28 |
8.0 |
Best 30 Stock
| Pos. | |
Name | |
RS Today | |
RS 3Wk | |
RS 6Wk | |
RS 26wk | |
Secotr | |
Industry | |
Pos Ind | |
EPS | |
SMR | |
A/C | |
CR | |
Ind Pos. | |
Sec Pos. | |
Close. | |
10wk | |
26wk | |
| 1.0 |
WGS |
100.0 |
100.0 |
99.9 |
95.64 |
Healthcare |
Health Information Services |
111 |
97.33 |
96.88 |
88.99 |
37.45 |
1.0 |
1.0 |
56.06 |
1.0 |
1.0 |
| 2.0 |
FTEL |
99.96 |
99.93 |
99.81 |
0.0 |
Consumer Cyclical |
Specialty Retail |
12 |
0.0 |
0.0 |
52.44 |
0.0 |
1.0 |
1.0 |
31.31 |
1.0 |
1.0 |
| 3.0 |
SEZL |
99.93 |
99.96 |
99.93 |
0.0 |
Financial |
Credit Services |
17 |
94.86 |
86.39 |
86.2 |
70.23 |
1.0 |
1.0 |
220.91 |
1.0 |
1.0 |
| 4.0 |
SMMT |
99.9 |
99.9 |
100.0 |
97.1 |
Healthcare |
Biotechnology |
19 |
13.85 |
0.0 |
15.85 |
0.0 |
1.0 |
2.0 |
22.23 |
1.0 |
1.0 |
| 5.0 |
LENZ |
99.87 |
99.87 |
99.87 |
99.56 |
Healthcare |
Biotechnology |
19 |
23.1 |
0.0 |
48.72 |
0.0 |
2.0 |
3.0 |
28.5 |
1.0 |
1.0 |
| 6.0 |
LBPH |
99.84 |
99.72 |
99.59 |
97.76 |
Healthcare |
Biotechnology |
19 |
0.0 |
0.0 |
80.69 |
0.0 |
3.0 |
4.0 |
59.68 |
1.0 |
1.0 |
| 7.0 |
RNA |
99.81 |
99.81 |
99.75 |
95.33 |
Healthcare |
Biotechnology |
19 |
11.72 |
35.8 |
64.39 |
33.74 |
4.0 |
5.0 |
45.72 |
1.0 |
1.0 |
| 8.0 |
DOGZ |
99.78 |
99.04 |
96.85 |
1.21 |
Consumer Cyclical |
Leisure |
3 |
45.8 |
0.28 |
78.57 |
38.21 |
1.0 |
2.0 |
46.81 |
1.0 |
1.0 |
| 9.0 |
JANX |
99.75 |
99.38 |
99.66 |
99.12 |
Healthcare |
Biotechnology |
19 |
31.24 |
34.1 |
88.99 |
41.08 |
5.0 |
6.0 |
54.36 |
1.0 |
1.0 |
| 10.0 |
ASTS |
99.72 |
99.78 |
99.84 |
2.73 |
Technology |
Communication Equipment |
1 |
13.6 |
0.0 |
19.2 |
0.0 |
1.0 |
1.0 |
26.72 |
0.0 |
1.0 |
| 11.0 |
CAPR |
99.66 |
99.75 |
18.75 |
75.44 |
Healthcare |
Biotechnology |
19 |
7.17 |
74.55 |
80.3 |
17.93 |
7.0 |
8.0 |
21.45 |
1.0 |
1.0 |
| 12.0 |
VKTX |
99.63 |
99.63 |
99.56 |
99.09 |
Healthcare |
Biotechnology |
19 |
8.69 |
0.0 |
68.27 |
0.0 |
8.0 |
9.0 |
74.51 |
1.0 |
1.0 |
| 13.0 |
CVNA |
99.59 |
99.5 |
99.04 |
99.87 |
Consumer Cyclical |
Auto and Truck Dealerships |
34 |
77.54 |
76.45 |
99.06 |
82.96 |
1.0 |
3.0 |
205.02 |
1.0 |
1.0 |
| 14.0 |
DAVE |
99.56 |
99.84 |
99.78 |
99.81 |
Technology |
Software - Application |
76 |
49.95 |
80.91 |
61.23 |
36.65 |
1.0 |
2.0 |
39.27 |
0.0 |
1.0 |
| 15.0 |
SMR |
99.53 |
95.04 |
86.73 |
11.99 |
Industrials |
Specialty Industrial Machinery |
40 |
6.55 |
11.22 |
83.3 |
17.3 |
1.0 |
1.0 |
22.0 |
1.0 |
1.0 |
| 16.0 |
MSTR |
99.5 |
99.59 |
99.44 |
98.91 |
Technology |
Software - Application |
76 |
1.29 |
24.31 |
80.85 |
83.55 |
2.0 |
3.0 |
255.33 |
1.0 |
1.0 |
| 17.0 |
KRRO |
99.44 |
95.16 |
92.59 |
98.47 |
Healthcare |
Biotechnology |
19 |
0.0 |
0.0 |
24.38 |
0.0 |
10.0 |
11.0 |
63.84 |
1.0 |
1.0 |
| 18.0 |
EWTX |
99.41 |
99.29 |
98.36 |
93.78 |
Healthcare |
Biotechnology |
19 |
9.68 |
0.0 |
97.16 |
0.0 |
11.0 |
12.0 |
34.04 |
1.0 |
1.0 |
| 19.0 |
ADMA |
99.35 |
99.66 |
99.72 |
92.75 |
Healthcare |
Biotechnology |
19 |
98.6 |
99.32 |
68.27 |
21.73 |
12.0 |
13.0 |
16.43 |
0.0 |
1.0 |
| 20.0 |
GGAL |
99.29 |
98.61 |
98.45 |
98.25 |
Financial |
Banks - Regional |
22 |
98.91 |
97.43 |
90.06 |
57.35 |
2.0 |
3.0 |
54.11 |
1.0 |
1.0 |
| 21.0 |
NRIX |
99.26 |
98.21 |
97.65 |
69.13 |
Healthcare |
Biotechnology |
19 |
8.72 |
52.87 |
51.0 |
24.71 |
13.0 |
15.0 |
26.45 |
1.0 |
1.0 |
| 22.0 |
PRAX |
99.23 |
97.72 |
97.22 |
98.97 |
Healthcare |
Biotechnology |
19 |
87.78 |
0.0 |
88.99 |
0.0 |
14.0 |
16.0 |
71.73 |
1.0 |
1.0 |
| 23.0 |
APP |
99.1 |
98.58 |
98.85 |
99.28 |
Technology |
Software - Application |
76 |
95.14 |
99.93 |
92.14 |
84.59 |
3.0 |
4.0 |
166.18 |
1.0 |
1.0 |
| 24.0 |
VERA |
99.07 |
98.55 |
96.94 |
99.68 |
Healthcare |
Biotechnology |
19 |
34.61 |
0.0 |
47.38 |
0.0 |
15.0 |
19.0 |
47.34 |
1.0 |
1.0 |
| 25.0 |
IGMS |
99.01 |
97.87 |
97.13 |
14.29 |
Healthcare |
Biotechnology |
19 |
43.36 |
97.94 |
40.94 |
22.18 |
16.0 |
20.0 |
17.82 |
1.0 |
1.0 |
| 26.0 |
ROOT |
98.98 |
98.79 |
99.32 |
99.96 |
Financial |
Insurance - Property and Casualty |
96 |
74.6 |
60.12 |
91.24 |
45.55 |
1.0 |
4.0 |
40.47 |
0.0 |
0.0 |
| 27.0 |
CAVA |
98.92 |
99.19 |
99.38 |
0.0 |
Consumer Cyclical |
Restaurants |
82 |
0.0 |
98.71 |
83.3 |
0.0 |
1.0 |
4.0 |
138.47 |
1.0 |
1.0 |
| 28.0 |
DYN |
98.89 |
99.13 |
99.25 |
95.55 |
Healthcare |
Biotechnology |
19 |
29.72 |
0.0 |
28.34 |
0.0 |
17.0 |
21.0 |
30.78 |
0.0 |
0.0 |
| 29.0 |
BMA |
98.86 |
98.98 |
98.7 |
98.63 |
Financial |
Banks - Regional |
22 |
84.93 |
92.01 |
49.8 |
66.9 |
3.0 |
5.0 |
79.11 |
1.0 |
1.0 |
| 30.0 |
CDNA |
98.79 |
99.56 |
99.35 |
25.36 |
Healthcare |
Diagnostics and Research |
48 |
30.74 |
20.4 |
8.37 |
20.21 |
1.0 |
22.0 |
22.88 |
0.0 |
1.0 |
Canslim Selection
| Pos. | |
Name | |
RS Today | |
RS 3Wk | |
RS 6Wk | |
RS 26wk | |
Secotr | |
Industry | |
Pos Ind | |
EPS | |
SMR | |
A/C | |
CR | |
Ind Pos. | |
Sec Pos. | |
Close. | |
10wk | |
26wk | |
| 1.0 |
SEZL |
99.93 |
99.96 |
99.93 |
0.0 |
Financial |
Credit Services |
17 |
94.86 |
86.39 |
86.2 |
70.23 |
1.0 |
1.0 |
220.91 |
1.0 |
1.0 |
| 2.0 |
IRM |
91.87 |
92.02 |
91.57 |
77.49 |
Real Estate |
REIT - Specialty |
53 |
61.76 |
32.4 |
94.42 |
83.1 |
1.0 |
7.0 |
128.13 |
1.0 |
1.0 |
| 3.0 |
FIX |
91.44 |
96.02 |
94.04 |
95.05 |
Industrials |
Engineering and Construction |
21 |
90.87 |
92.65 |
61.23 |
97.26 |
6.0 |
36.0 |
389.29 |
1.0 |
1.0 |
| 4.0 |
ALNY |
87.22 |
83.52 |
83.52 |
10.63 |
Healthcare |
Biotechnology |
19 |
71.11 |
98.1 |
3.79 |
94.87 |
81.0 |
119.0 |
286.91 |
1.0 |
1.0 |
| 5.0 |
DECK |
81.43 |
91.22 |
90.58 |
89.43 |
Consumer Cyclical |
Footwear and Accessories |
66 |
89.79 |
93.51 |
57.04 |
90.68 |
3.0 |
67.0 |
169.28 |
1.0 |
1.0 |
| 6.0 |
MELI |
79.52 |
83.62 |
83.58 |
55.48 |
Consumer Cyclical |
Internet Retail |
47 |
99.31 |
72.24 |
51.0 |
99.86 |
7.0 |
74.0 |
2056.09 |
1.0 |
1.0 |
| 7.0 |
NTAP |
79.24 |
84.51 |
83.61 |
88.0 |
Technology |
Computer Hardware |
77 |
74.38 |
75.39 |
52.44 |
84.9 |
6.0 |
109.0 |
120.41 |
0.0 |
1.0 |
| 8.0 |
DFH |
78.29 |
80.94 |
82.22 |
96.48 |
Consumer Cyclical |
Residential Construction |
42 |
86.63 |
62.84 |
52.44 |
52.33 |
13.0 |
80.0 |
32.2 |
0.0 |
1.0 |
| 9.0 |
ODFL |
26.66 |
18.41 |
24.71 |
54.7 |
Industrials |
Trucking |
75 |
43.82 |
47.38 |
30.28 |
90.82 |
8.0 |
297.0 |
200.88 |
1.0 |
1.0 |
| 10.0 |
NXT |
16.56 |
21.95 |
19.34 |
78.61 |
Technology |
Solar |
134 |
42.31 |
99.8 |
5.22 |
53.4 |
5.0 |
356.0 |
32.56 |
0.0 |
0.0 |
Base Formation Stock
| Pos. | |
Name | |
RS Today | |
RS 3Wk | |
RS 6Wk | |
RS 26wk | |
Secotr | |
Industry | |
Pos Ind | |
EPS | |
SMR | |
A/C | |
CR | |
Ind Pos. | |
Sec Pos. | |
Close. | |
10wk | |
26wk | |
| 1.0 |
VERA |
99.07 |
98.55 |
96.94 |
99.68 |
Healthcare |
Biotechnology |
19 |
34.61 |
0.0 |
47.38 |
0.0 |
15.0 |
19.0 |
47.34 |
1.0 |
1.0 |
| 2.0 |
OSCR |
96.7 |
98.67 |
99.19 |
97.48 |
Healthcare |
Healthcare Plans |
2 |
83.17 |
92.71 |
31.56 |
23.5 |
2.0 |
51.0 |
15.35 |
0.0 |
0.0 |
| 3.0 |
INSM |
96.3 |
97.66 |
98.33 |
66.33 |
Healthcare |
Biotechnology |
19 |
11.5 |
84.98 |
68.27 |
65.73 |
38.0 |
56.0 |
71.95 |
0.0 |
1.0 |
| 4.0 |
INOD |
95.75 |
92.88 |
93.15 |
24.18 |
Technology |
Information Technology Services |
10 |
46.95 |
95.92 |
40.94 |
31.18 |
2.0 |
19.0 |
20.48 |
1.0 |
1.0 |
| 5.0 |
HOV |
94.73 |
95.28 |
95.15 |
94.21 |
Consumer Cyclical |
Residential Construction |
42 |
79.92 |
54.79 |
40.94 |
86.98 |
1.0 |
17.0 |
176.17 |
0.0 |
1.0 |
| 6.0 |
ERJ |
94.39 |
96.15 |
96.79 |
90.08 |
Industrials |
Aerospace and Defense |
29 |
91.09 |
90.98 |
88.99 |
52.54 |
5.0 |
23.0 |
34.38 |
1.0 |
1.0 |
| 7.0 |
DNTH |
93.41 |
95.25 |
93.55 |
100.0 |
Healthcare |
Biotechnology |
19 |
74.85 |
38.94 |
57.04 |
41.84 |
60.0 |
83.0 |
28.12 |
1.0 |
1.0 |
| 8.0 |
INBK |
92.27 |
90.91 |
94.53 |
97.94 |
Financial |
Banks - Regional |
22 |
0.0 |
0.0 |
8.37 |
0.0 |
7.0 |
25.0 |
35.97 |
1.0 |
1.0 |
| 9.0 |
AGIO |
92.17 |
87.4 |
92.22 |
78.58 |
Healthcare |
Biotechnology |
19 |
10.45 |
22.36 |
24.38 |
48.28 |
66.0 |
93.0 |
46.08 |
1.0 |
1.0 |
| 10.0 |
GDDY |
92.11 |
93.75 |
94.6 |
89.99 |
Technology |
Software - Infrastructure |
55 |
99.87 |
38.24 |
68.27 |
87.67 |
11.0 |
39.0 |
159.89 |
1.0 |
1.0 |
| 11.0 |
IBP |
90.94 |
92.08 |
92.44 |
93.53 |
Consumer Cyclical |
Residential Construction |
42 |
74.51 |
50.11 |
74.48 |
92.66 |
3.0 |
26.0 |
234.71 |
1.0 |
1.0 |
| 12.0 |
BURL |
90.7 |
93.04 |
92.74 |
32.88 |
Consumer Cyclical |
Apparel Retail |
80 |
96.47 |
76.77 |
58.34 |
94.18 |
4.0 |
27.0 |
253.27 |
0.0 |
1.0 |
| 13.0 |
AORT |
90.57 |
87.68 |
88.09 |
80.41 |
Healthcare |
Medical Devices |
95 |
41.97 |
45.1 |
68.27 |
40.63 |
8.0 |
104.0 |
26.45 |
1.0 |
1.0 |
| 14.0 |
WING |
89.47 |
94.85 |
96.72 |
90.82 |
Consumer Cyclical |
Restaurants |
82 |
96.41 |
85.43 |
8.37 |
96.43 |
5.0 |
30.0 |
368.55 |
0.0 |
0.0 |
| 15.0 |
MPWR |
89.43 |
89.9 |
93.18 |
79.42 |
Technology |
Semiconductors |
79 |
52.95 |
24.35 |
20.31 |
99.2 |
8.0 |
53.0 |
890.46 |
0.0 |
1.0 |
| 16.0 |
NVMI |
89.1 |
91.62 |
89.87 |
92.91 |
Technology |
Semiconductor Equipment and Materials |
133 |
86.66 |
57.52 |
25.96 |
89.54 |
1.0 |
56.0 |
189.05 |
0.0 |
0.0 |
| 17.0 |
REVG |
88.88 |
85.52 |
91.54 |
94.87 |
Industrials |
Farm and Heavy Construction Machinery |
116 |
92.45 |
86.1 |
1.86 |
44.96 |
2.0 |
53.0 |
28.2 |
1.0 |
1.0 |
| 18.0 |
GKOS |
88.63 |
89.59 |
85.25 |
95.02 |
Healthcare |
Medical Devices |
95 |
5.22 |
53.44 |
22.7 |
79.95 |
10.0 |
111.0 |
134.08 |
1.0 |
1.0 |
| 19.0 |
UTI |
87.77 |
90.08 |
93.52 |
96.89 |
Consumer Defensive |
Education and Training Services |
119 |
98.2 |
79.65 |
40.94 |
32.6 |
1.0 |
14.0 |
16.79 |
1.0 |
1.0 |
| 20.0 |
DKS |
87.71 |
91.04 |
93.02 |
77.86 |
Consumer Cyclical |
Specialty Retail |
12 |
0.0 |
0.0 |
5.81 |
0.0 |
3.0 |
38.0 |
205.27 |
0.0 |
0.0 |
| 21.0 |
GHM |
87.37 |
86.69 |
92.31 |
96.36 |
Industrials |
Specialty Industrial Machinery |
40 |
92.76 |
94.64 |
40.94 |
49.15 |
7.0 |
60.0 |
29.56 |
0.0 |
1.0 |
| 22.0 |
BFH |
87.34 |
77.98 |
80.62 |
82.09 |
Financial |
Credit Services |
17 |
82.7 |
63.36 |
32.7 |
63.23 |
8.0 |
50.0 |
51.25 |
0.0 |
1.0 |
| 23.0 |
BHE |
86.69 |
87.83 |
91.45 |
76.09 |
Technology |
Electronic Components |
39 |
86.51 |
52.77 |
64.39 |
61.4 |
3.0 |
66.0 |
45.16 |
1.0 |
1.0 |
| 24.0 |
MLR |
86.63 |
81.15 |
80.06 |
78.8 |
Consumer Cyclical |
Auto Parts |
136 |
89.63 |
97.81 |
77.07 |
73.31 |
4.0 |
45.0 |
67.76 |
1.0 |
1.0 |
| 25.0 |
AX |
86.45 |
83.99 |
87.75 |
72.61 |
Financial |
Banks - Regional |
22 |
85.49 |
60.37 |
22.7 |
68.95 |
17.0 |
61.0 |
67.02 |
1.0 |
1.0 |
NEW STAGGE 1
| Pos. | |
Name | |
RS Today | |
RS 3Wk | |
RS 6Wk | |
RS 26wk | |
Secotr | |
Industry | |
Pos Ind | |
EPS | |
SMR | |
A/C | |
CR | |
Ind Pos. | |
Sec Pos. | |
Close. | |
10wk | |
26wk | |
| 1.0 |
WRB |
53.32 |
66.68 |
68.31 |
72.55 |
Financial |
Insurance - Property and Casualty |
96 |
86.6 |
68.07 |
33.6 |
69.43 |
19.0 |
382.0 |
58.4 |
1.0 |
1.0 |
| 2.0 |
ORLY |
51.57 |
59.88 |
54.02 |
48.74 |
Consumer Cyclical |
Specialty Retail |
12 |
19.51 |
68.43 |
40.94 |
99.65 |
15.0 |
151.0 |
1197.1 |
1.0 |
1.0 |
| 3.0 |
CHDN |
51.47 |
53.47 |
51.89 |
21.44 |
Consumer Cyclical |
Gambling |
36 |
83.51 |
74.59 |
40.94 |
88.36 |
7.0 |
154.0 |
141.16 |
1.0 |
1.0 |
| 4.0 |
CHH |
50.27 |
31.28 |
32.18 |
26.01 |
Consumer Cyclical |
Lodging |
52 |
58.89 |
11.48 |
17.46 |
83.59 |
7.0 |
159.0 |
140.83 |
1.0 |
1.0 |
| 5.0 |
PAYX |
49.26 |
45.38 |
50.94 |
50.88 |
Technology |
Software - Application |
76 |
50.01 |
53.89 |
11.92 |
85.25 |
64.0 |
241.0 |
140.27 |
1.0 |
1.0 |
| 6.0 |
EIG |
49.07 |
50.58 |
52.73 |
47.28 |
Financial |
Insurance - Specialty |
28 |
47.07 |
65.92 |
11.92 |
61.05 |
12.0 |
425.0 |
47.93 |
1.0 |
1.0 |
| 7.0 |
GD |
48.92 |
57.01 |
69.79 |
75.03 |
Industrials |
Aerospace and Defense |
29 |
41.63 |
50.43 |
91.24 |
96.22 |
25.0 |
228.0 |
303.92 |
1.0 |
1.0 |
| 8.0 |
PCG |
48.76 |
53.72 |
47.14 |
35.28 |
Utilities |
Utilities - Regulated Electric |
59 |
0.0 |
0.0 |
63.25 |
0.0 |
17.0 |
35.0 |
20.51 |
1.0 |
1.0 |
| 9.0 |
LNT |
48.21 |
50.21 |
50.1 |
25.8 |
Utilities |
Utilities - Regulated Electric |
59 |
0.0 |
0.0 |
40.94 |
0.0 |
18.0 |
36.0 |
61.13 |
1.0 |
1.0 |
| 10.0 |
BR |
48.15 |
48.98 |
47.48 |
66.24 |
Technology |
Information Technology Services |
10 |
36.0 |
61.05 |
93.24 |
93.56 |
24.0 |
244.0 |
213.69 |
1.0 |
1.0 |
| 11.0 |
WPP |
48.02 |
36.54 |
38.07 |
24.43 |
Communication Services |
Advertising Agencies |
78 |
62.57 |
19.63 |
28.34 |
63.06 |
10.0 |
71.0 |
53.84 |
1.0 |
1.0 |
| 12.0 |
NODK |
47.69 |
53.81 |
51.52 |
55.54 |
Financial |
Insurance - Property and Casualty |
96 |
32.19 |
80.75 |
83.3 |
33.92 |
25.0 |
441.0 |
15.85 |
1.0 |
1.0 |
| 13.0 |
PFG |
47.59 |
52.61 |
39.46 |
54.14 |
Financial |
Asset Management |
61 |
70.73 |
32.49 |
71.99 |
77.91 |
39.0 |
442.0 |
84.48 |
1.0 |
1.0 |
| 14.0 |
BKH |
47.56 |
46.52 |
43.96 |
19.73 |
Utilities |
Utilities - Regulated Gas |
117 |
24.15 |
52.96 |
83.3 |
69.19 |
5.0 |
37.0 |
60.34 |
1.0 |
1.0 |
| 15.0 |
ET |
47.41 |
47.16 |
48.78 |
65.65 |
Energy |
Oil and Gas Midstream |
97 |
73.61 |
34.0 |
40.94 |
31.98 |
15.0 |
35.0 |
16.39 |
1.0 |
1.0 |
| 16.0 |
IIIV |
46.73 |
42.51 |
36.59 |
35.25 |
Technology |
Software - Infrastructure |
55 |
25.82 |
62.78 |
40.94 |
39.8 |
59.0 |
249.0 |
23.28 |
1.0 |
1.0 |
| 17.0 |
EVRG |
46.61 |
49.29 |
46.86 |
19.58 |
Utilities |
Utilities - Regulated Electric |
59 |
27.83 |
34.58 |
40.94 |
65.45 |
19.0 |
38.0 |
60.97 |
1.0 |
1.0 |
| 18.0 |
PBH |
46.42 |
43.62 |
62.41 |
58.43 |
Healthcare |
Drug Manufacturers - Specialty and Generic |
30 |
66.9 |
68.04 |
71.99 |
76.32 |
23.0 |
251.0 |
73.62 |
1.0 |
1.0 |
| 19.0 |
WTW |
46.15 |
70.5 |
71.05 |
51.63 |
Financial |
Insurance Brokers |
20 |
66.62 |
81.48 |
77.83 |
96.33 |
8.0 |
463.0 |
292.11 |
1.0 |
1.0 |
| 20.0 |
FWONK |
46.02 |
36.82 |
52.76 |
37.11 |
Communication Services |
Entertainment |
73 |
73.16 |
23.53 |
2.7 |
71.85 |
17.0 |
73.0 |
80.05 |
1.0 |
1.0 |
| 21.0 |
OSBC |
45.96 |
35.74 |
57.32 |
59.99 |
Financial |
Banks - Regional |
22 |
50.51 |
43.27 |
88.99 |
34.96 |
190.0 |
466.0 |
16.77 |
1.0 |
1.0 |
| 22.0 |
KVUE |
45.28 |
39.68 |
44.12 |
0.0 |
Consumer Defensive |
Household and Personal Products |
123 |
35.38 |
42.18 |
96.11 |
42.47 |
7.0 |
55.0 |
22.87 |
1.0 |
1.0 |
| 23.0 |
GTY |
44.27 |
39.56 |
40.35 |
16.38 |
Real Estate |
REIT - Retail |
45 |
38.75 |
29.09 |
96.11 |
52.82 |
15.0 |
93.0 |
32.52 |
1.0 |
1.0 |
| 24.0 |
HBT |
44.15 |
45.75 |
62.11 |
45.25 |
Financial |
Banks - Regional |
22 |
62.29 |
76.22 |
40.94 |
41.74 |
196.0 |
493.0 |
21.97 |
1.0 |
1.0 |
| 25.0 |
OGS |
43.96 |
29.49 |
27.46 |
16.47 |
Utilities |
Utilities - Regulated Gas |
117 |
17.84 |
31.82 |
74.48 |
72.06 |
6.0 |
41.0 |
73.69 |
1.0 |
1.0 |
| 26.0 |
INCY |
43.65 |
44.05 |
41.0 |
13.14 |
Healthcare |
Biotechnology |
19 |
78.41 |
77.83 |
40.94 |
72.93 |
142.0 |
261.0 |
65.69 |
1.0 |
1.0 |
| 27.0 |
POR |
43.53 |
35.16 |
43.72 |
20.88 |
Utilities |
Utilities - Regulated Electric |
59 |
91.27 |
44.3 |
57.04 |
65.97 |
22.0 |
42.0 |
48.7 |
1.0 |
1.0 |
| 28.0 |
SRE |
43.34 |
47.69 |
47.57 |
28.44 |
Utilities |
Utilities - Diversified |
88 |
78.87 |
50.59 |
40.94 |
77.88 |
3.0 |
43.0 |
85.16 |
1.0 |
1.0 |
| 29.0 |
MPLX |
43.16 |
54.74 |
60.66 |
60.8 |
Energy |
Oil and Gas Midstream |
97 |
90.34 |
71.31 |
4.38 |
61.78 |
16.0 |
37.0 |
43.77 |
1.0 |
1.0 |
| 30.0 |
VOYA |
42.05 |
46.85 |
42.91 |
34.72 |
Financial |
Financial Conglomerates |
87 |
87.47 |
77.09 |
65.61 |
79.23 |
2.0 |
520.0 |
80.66 |
1.0 |
1.0 |
| 31.0 |
PFIS |
42.02 |
36.42 |
37.76 |
36.43 |
Financial |
Banks - Regional |
22 |
6.74 |
44.52 |
68.27 |
60.57 |
198.0 |
521.0 |
47.36 |
1.0 |
1.0 |
| 32.0 |
ABR |
41.74 |
27.89 |
24.25 |
57.94 |
Real Estate |
REIT - Mortgage |
120 |
0.0 |
0.0 |
83.3 |
0.0 |
9.0 |
99.0 |
15.18 |
1.0 |
1.0 |
| 33.0 |
ALE |
41.13 |
47.84 |
47.63 |
29.37 |
Utilities |
Utilities - Diversified |
88 |
31.11 |
31.21 |
22.7 |
65.03 |
5.0 |
48.0 |
64.29 |
1.0 |
1.0 |
| 34.0 |
UGI |
40.94 |
37.43 |
25.39 |
15.23 |
Utilities |
Utilities - Regulated Gas |
117 |
65.26 |
46.39 |
72.94 |
46.0 |
7.0 |
50.0 |
24.95 |
1.0 |
1.0 |
| 35.0 |
DGX |
40.82 |
52.15 |
59.82 |
38.26 |
Healthcare |
Diagnostics and Research |
48 |
17.56 |
37.11 |
83.3 |
87.98 |
17.0 |
274.0 |
155.91 |
1.0 |
1.0 |
| 36.0 |
ED |
40.45 |
44.11 |
47.39 |
31.08 |
Utilities |
Utilities - Regulated Electric |
59 |
41.57 |
68.91 |
79.65 |
83.35 |
24.0 |
52.0 |
104.8 |
1.0 |
1.0 |
| 37.0 |
WEC |
40.17 |
42.27 |
40.85 |
22.07 |
Utilities |
Utilities - Regulated Electric |
59 |
23.87 |
25.92 |
78.57 |
78.53 |
25.0 |
53.0 |
97.0 |
1.0 |
1.0 |
| 38.0 |
OGE |
39.5 |
46.55 |
47.67 |
28.81 |
Utilities |
Utilities - Regulated Electric |
59 |
0.0 |
0.0 |
68.27 |
0.0 |
27.0 |
55.0 |
40.65 |
1.0 |
1.0 |
| 39.0 |
ARW |
38.42 |
39.74 |
30.14 |
50.6 |
Technology |
Electronics and Computer Distribution |
44 |
31.73 |
5.0 |
2.7 |
77.18 |
6.0 |
266.0 |
133.82 |
1.0 |
1.0 |
| 40.0 |
ENS |
38.08 |
31.21 |
32.98 |
50.01 |
Industrials |
Electrical Equipment and Parts |
9 |
58.7 |
71.99 |
5.81 |
79.82 |
11.0 |
253.0 |
100.77 |
1.0 |
1.0 |
| 41.0 |
AVT |
37.8 |
39.77 |
38.38 |
61.08 |
Technology |
Electronics and Computer Distribution |
44 |
35.04 |
5.71 |
40.94 |
60.29 |
7.0 |
271.0 |
54.4 |
1.0 |
1.0 |
| 42.0 |
GSBC |
37.71 |
41.9 |
56.24 |
42.71 |
Financial |
Banks - Regional |
22 |
21.55 |
49.66 |
57.04 |
66.32 |
207.0 |
570.0 |
58.36 |
1.0 |
1.0 |
| 43.0 |
IVT |
37.68 |
42.98 |
54.79 |
54.27 |
Real Estate |
REIT - Retail |
45 |
57.65 |
23.99 |
78.57 |
48.52 |
19.0 |
108.0 |
29.45 |
1.0 |
1.0 |
| 44.0 |
AEE |
36.33 |
40.24 |
35.11 |
18.3 |
Utilities |
Utilities - Regulated Electric |
59 |
32.81 |
19.12 |
59.02 |
75.07 |
28.0 |
61.0 |
88.12 |
1.0 |
1.0 |
| 45.0 |
NWE |
35.22 |
38.11 |
39.89 |
20.2 |
Utilities |
Utilities - Regulated Electric |
59 |
0.0 |
0.0 |
40.94 |
0.0 |
29.0 |
62.0 |
55.34 |
1.0 |
1.0 |
| 46.0 |
PEBO |
34.51 |
41.62 |
57.2 |
57.28 |
Financial |
Banks - Regional |
22 |
60.06 |
65.15 |
94.42 |
55.9 |
209.0 |
595.0 |
31.54 |
1.0 |
1.0 |
| 47.0 |
HDB |
34.11 |
28.04 |
36.37 |
17.93 |
Financial |
Banks - Regional |
22 |
21.86 |
50.78 |
24.38 |
66.56 |
210.0 |
601.0 |
64.5 |
1.0 |
1.0 |
| 48.0 |
HSTM |
34.05 |
62.56 |
71.24 |
45.91 |
Healthcare |
Health Information Services |
111 |
80.85 |
49.56 |
24.38 |
47.94 |
9.0 |
291.0 |
28.95 |
1.0 |
1.0 |
| 49.0 |
DE |
32.75 |
28.78 |
27.83 |
40.09 |
Industrials |
Farm and Heavy Construction Machinery |
116 |
64.76 |
46.61 |
17.46 |
97.43 |
9.0 |
271.0 |
412.35 |
1.0 |
1.0 |
| 50.0 |
XOM |
32.2 |
43.19 |
26.99 |
49.76 |
Energy |
Oil and Gas Integrated |
132 |
71.75 |
8.05 |
33.6 |
81.55 |
6.0 |
56.0 |
118.9 |
1.0 |
1.0 |
| 51.0 |
WABC |
30.88 |
32.11 |
53.99 |
65.62 |
Financial |
Banks - Regional |
22 |
48.19 |
41.22 |
40.94 |
63.89 |
214.0 |
623.0 |
52.5 |
1.0 |
1.0 |
| 52.0 |
KMT |
30.44 |
26.57 |
32.39 |
21.79 |
Industrials |
Tools and Accessories |
108 |
35.84 |
22.1 |
80.3 |
43.26 |
5.0 |
281.0 |
25.59 |
1.0 |
1.0 |
| 53.0 |
LNG |
29.95 |
36.23 |
44.09 |
50.29 |
Energy |
Oil and Gas Midstream |
97 |
44.41 |
11.26 |
40.94 |
88.47 |
25.0 |
61.0 |
183.58 |
1.0 |
1.0 |
| 54.0 |
NWN |
29.67 |
25.49 |
29.68 |
17.84 |
Utilities |
Utilities - Regulated Gas |
117 |
8.9 |
17.29 |
68.27 |
53.47 |
10.0 |
69.0 |
40.4 |
1.0 |
1.0 |
| 55.0 |
IDA |
29.24 |
29.03 |
35.6 |
20.01 |
Utilities |
Utilities - Regulated Electric |
59 |
31.36 |
27.91 |
11.92 |
75.18 |
33.0 |
71.0 |
103.81 |
1.0 |
1.0 |
| 56.0 |
FSK |
29.06 |
28.6 |
26.78 |
45.13 |
Financial |
Asset Management |
61 |
64.27 |
49.43 |
61.23 |
40.46 |
55.0 |
634.0 |
20.72 |
1.0 |
1.0 |
| 57.0 |
AC |
27.21 |
31.8 |
20.88 |
23.65 |
Financial |
Asset Management |
61 |
55.49 |
90.05 |
91.24 |
61.64 |
58.0 |
649.0 |
36.09 |
1.0 |
1.0 |
| 58.0 |
AWR |
26.69 |
28.66 |
32.33 |
15.44 |
Utilities |
Utilities - Regulated Water |
105 |
21.0 |
24.15 |
40.94 |
71.58 |
6.0 |
73.0 |
83.26 |
1.0 |
1.0 |
| 59.0 |
TXNM |
23.64 |
24.87 |
25.6 |
13.7 |
Utilities |
Utilities - Regulated Electric |
59 |
8.22 |
0.0 |
94.42 |
0.0 |
35.0 |
77.0 |
43.74 |
1.0 |
1.0 |
| 60.0 |
EXC |
23.52 |
25.3 |
27.42 |
23.18 |
Utilities |
Utilities - Regulated Electric |
59 |
50.13 |
56.4 |
74.48 |
61.43 |
36.0 |
78.0 |
40.22 |
1.0 |
1.0 |
| 61.0 |
GBLI |
18.96 |
21.85 |
20.95 |
52.96 |
Financial |
Insurance - Property and Casualty |
96 |
95.76 |
78.82 |
59.02 |
61.26 |
33.0 |
678.0 |
34.0 |
1.0 |
1.0 |
| 62.0 |
WINA |
16.34 |
18.28 |
28.6 |
49.08 |
Consumer Cyclical |
Specialty Retail |
12 |
35.16 |
51.39 |
20.31 |
96.5 |
24.0 |
266.0 |
377.0 |
1.0 |
1.0 |
| 63.0 |
BWA |
16.1 |
16.65 |
13.91 |
15.97 |
Consumer Cyclical |
Auto Parts |
136 |
50.35 |
21.49 |
71.99 |
54.62 |
15.0 |
269.0 |
34.4 |
1.0 |
1.0 |
New Hight
| Pos. | |
Name | |
RS Today | |
RS 3Wk | |
RS 6Wk | |
RS 26wk | |
Secotr | |
Industry | |
Pos Ind | |
EPS | |
SMR | |
A/C | |
CR | |
Ind Pos. | |
Sec Pos. | |
Close. | |
10wk | |
26wk | |
| 1.0 |
LENZ |
99.87 |
99.87 |
99.87 |
99.56 |
Healthcare |
Biotechnology |
19 |
23.1 |
0.0 |
48.72 |
0.0 |
2.0 |
3.0 |
28.5 |
1.0 |
1.0 |
| 2.0 |
LBPH |
99.84 |
99.72 |
99.59 |
97.76 |
Healthcare |
Biotechnology |
19 |
0.0 |
0.0 |
80.69 |
0.0 |
3.0 |
4.0 |
59.68 |
1.0 |
1.0 |
| 3.0 |
DOGZ |
99.78 |
99.04 |
96.85 |
1.21 |
Consumer Cyclical |
Leisure |
3 |
45.8 |
0.28 |
78.57 |
38.21 |
1.0 |
2.0 |
46.81 |
1.0 |
1.0 |
| 4.0 |
CAPR |
99.66 |
99.75 |
18.75 |
75.44 |
Healthcare |
Biotechnology |
19 |
7.17 |
74.55 |
80.3 |
17.93 |
7.0 |
8.0 |
21.45 |
1.0 |
1.0 |
| 5.0 |
CVNA |
99.59 |
99.5 |
99.04 |
99.87 |
Consumer Cyclical |
Auto & Truck Dealerships |
34 |
77.54 |
76.45 |
99.06 |
82.96 |
1.0 |
3.0 |
205.02 |
1.0 |
1.0 |
| 6.0 |
SMR |
99.53 |
95.04 |
86.73 |
11.99 |
Industrials |
Specialty Industrial Machinery |
40 |
6.55 |
11.22 |
83.3 |
17.3 |
1.0 |
1.0 |
22.0 |
1.0 |
1.0 |
| 7.0 |
MSTR |
99.5 |
99.59 |
99.44 |
98.91 |
Technology |
Software - Application |
76 |
1.29 |
24.31 |
80.85 |
83.55 |
2.0 |
3.0 |
255.33 |
1.0 |
1.0 |
| 8.0 |
GGAL |
99.29 |
98.61 |
98.45 |
98.25 |
Financial |
Banks - Regional |
22 |
98.91 |
97.43 |
90.06 |
57.35 |
2.0 |
3.0 |
54.11 |
1.0 |
1.0 |
| 9.0 |
NRIX |
99.26 |
98.21 |
97.65 |
69.13 |
Healthcare |
Biotechnology |
19 |
8.72 |
52.87 |
51.0 |
24.71 |
13.0 |
15.0 |
26.45 |
1.0 |
1.0 |
| 10.0 |
APP |
99.1 |
98.58 |
98.85 |
99.28 |
Technology |
Software - Application |
76 |
95.14 |
99.93 |
92.14 |
84.59 |
3.0 |
4.0 |
166.18 |
1.0 |
1.0 |
| 11.0 |
IGMS |
99.01 |
97.87 |
97.13 |
14.29 |
Healthcare |
Biotechnology |
19 |
43.36 |
97.94 |
40.94 |
22.18 |
16.0 |
20.0 |
17.82 |
1.0 |
1.0 |
| 12.0 |
CAVA |
98.92 |
99.19 |
99.38 |
0.0 |
Consumer Cyclical |
Restaurants |
82 |
0.0 |
98.71 |
83.3 |
0.0 |
1.0 |
4.0 |
138.47 |
1.0 |
1.0 |
| 13.0 |
BMA |
98.86 |
98.98 |
98.7 |
98.63 |
Financial |
Banks - Regional |
22 |
84.93 |
92.01 |
49.8 |
66.9 |
3.0 |
5.0 |
79.11 |
1.0 |
1.0 |
| 14.0 |
GATO |
98.52 |
98.18 |
97.87 |
83.02 |
Basic Materials |
Other Precious Metals & Mining |
13 |
93.53 |
21.88 |
95.24 |
27.34 |
1.0 |
3.0 |
19.3 |
1.0 |
1.0 |
| 15.0 |
PRCT |
97.72 |
96.52 |
96.97 |
91.63 |
Healthcare |
Medical Devices |
95 |
21.09 |
91.97 |
49.8 |
69.57 |
3.0 |
37.0 |
91.0 |
1.0 |
1.0 |
| 16.0 |
PTGX |
97.47 |
97.5 |
97.56 |
40.56 |
Healthcare |
Biotechnology |
19 |
75.4 |
0.0 |
8.37 |
0.0 |
29.0 |
42.0 |
48.2 |
1.0 |
1.0 |
| 17.0 |
VHI |
97.25 |
96.64 |
94.66 |
32.82 |
Basic Materials |
Chemicals |
81 |
68.07 |
80.87 |
57.04 |
47.28 |
2.0 |
5.0 |
36.2 |
1.0 |
1.0 |
| 18.0 |
HOOD |
96.85 |
96.98 |
95.71 |
94.09 |
Financial |
Capital Markets |
6 |
86.82 |
93.16 |
94.42 |
42.57 |
3.0 |
10.0 |
27.87 |
1.0 |
1.0 |
| 19.0 |
PLTR |
96.79 |
95.56 |
97.03 |
98.29 |
Technology |
Software - Infrastructure |
55 |
0.0 |
0.0 |
97.16 |
0.0 |
2.0 |
14.0 |
44.97 |
1.0 |
1.0 |
| 20.0 |
CLS |
96.76 |
93.81 |
94.78 |
99.19 |
Technology |
Electronic Components |
39 |
99.22 |
96.63 |
80.3 |
68.67 |
1.0 |
15.0 |
70.3 |
1.0 |
1.0 |
| 21.0 |
FLXS |
96.73 |
94.18 |
95.24 |
94.65 |
Consumer Cyclical |
Furnishings, Fixtures & Appliances |
32 |
0.0 |
0.0 |
94.42 |
0.0 |
1.0 |
9.0 |
58.02 |
1.0 |
1.0 |
| 22.0 |
EAT |
96.33 |
97.32 |
96.48 |
76.06 |
Consumer Cyclical |
Restaurants |
82 |
30.34 |
24.18 |
98.21 |
72.41 |
3.0 |
12.0 |
97.73 |
1.0 |
1.0 |
| 23.0 |
AGX |
96.27 |
95.41 |
94.1 |
82.0 |
Industrials |
Engineering & Construction |
21 |
82.74 |
57.0 |
85.73 |
82.06 |
3.0 |
14.0 |
131.19 |
1.0 |
1.0 |
| 24.0 |
SFM |
96.24 |
97.04 |
97.46 |
91.98 |
Consumer Defensive |
Grocery Stores |
37 |
0.0 |
0.0 |
64.39 |
0.0 |
1.0 |
4.0 |
120.18 |
1.0 |
1.0 |
| 25.0 |
CRDO |
96.21 |
93.71 |
91.85 |
97.04 |
Technology |
Semiconductors |
79 |
45.37 |
59.67 |
47.94 |
48.59 |
4.0 |
16.0 |
40.13 |
1.0 |
1.0 |
| 26.0 |
QTWO |
96.15 |
96.08 |
96.69 |
96.54 |
Technology |
Software - Application |
76 |
40.33 |
70.0 |
40.94 |
69.4 |
5.0 |
18.0 |
84.5 |
1.0 |
1.0 |
| 27.0 |
TARS |
96.02 |
93.96 |
92.13 |
95.21 |
Healthcare |
Biotechnology |
19 |
10.42 |
56.36 |
78.57 |
47.62 |
41.0 |
59.0 |
39.66 |
1.0 |
1.0 |
| 28.0 |
JXN |
95.96 |
96.49 |
95.52 |
94.56 |
Financial |
Insurance - Life |
50 |
78.1 |
63.23 |
8.37 |
74.45 |
1.0 |
12.0 |
101.36 |
1.0 |
1.0 |
| 29.0 |
USLM |
95.44 |
94.98 |
95.83 |
94.03 |
Basic Materials |
Building Materials |
63 |
89.01 |
89.86 |
77.07 |
79.09 |
1.0 |
12.0 |
106.41 |
1.0 |
1.0 |
| 30.0 |
SN |
95.28 |
96.45 |
96.42 |
0.0 |
Consumer Cyclical |
Furnishings, Fixtures & Appliances |
32 |
46.08 |
95.5 |
78.57 |
78.95 |
2.0 |
15.0 |
111.12 |
1.0 |
1.0 |
| 31.0 |
CRS |
95.22 |
95.38 |
94.84 |
88.18 |
Industrials |
Metal Fabrication |
26 |
89.29 |
93.71 |
92.61 |
88.43 |
1.0 |
17.0 |
166.03 |
1.0 |
1.0 |
| 32.0 |
WLDN |
95.1 |
93.99 |
92.65 |
93.5 |
Industrials |
Engineering & Construction |
21 |
99.13 |
89.95 |
85.81 |
60.15 |
4.0 |
18.0 |
46.27 |
1.0 |
1.0 |
| 33.0 |
EDN |
94.91 |
89.37 |
93.24 |
92.04 |
Utilities |
Utilities - Regulated Electric |
59 |
97.4 |
99.42 |
90.06 |
46.24 |
1.0 |
3.0 |
26.47 |
1.0 |
1.0 |
| 34.0 |
CMPO |
94.88 |
95.32 |
91.79 |
28.9 |
Industrials |
Metal Fabrication |
26 |
48.65 |
26.72 |
83.3 |
23.64 |
2.0 |
20.0 |
15.56 |
1.0 |
1.0 |
| 35.0 |
KKR |
94.76 |
93.59 |
94.19 |
91.57 |
Financial |
Asset Management |
61 |
0.0 |
0.0 |
86.83 |
0.0 |
1.0 |
17.0 |
140.75 |
1.0 |
1.0 |
| 36.0 |
QTTB |
94.64 |
95.35 |
96.01 |
85.73 |
Healthcare |
Biotechnology |
19 |
56.72 |
0.0 |
74.48 |
0.0 |
50.0 |
71.0 |
46.74 |
1.0 |
1.0 |
| 37.0 |
DBD |
94.51 |
95.62 |
96.51 |
0.0 |
Technology |
Software - Application |
76 |
85.92 |
53.99 |
74.48 |
58.46 |
6.0 |
22.0 |
47.0 |
1.0 |
1.0 |
| 38.0 |
TPG |
94.42 |
90.97 |
92.37 |
86.07 |
Financial |
Asset Management |
61 |
39.8 |
93.64 |
79.65 |
68.15 |
2.0 |
18.0 |
68.26 |
1.0 |
1.0 |
| 39.0 |
RCL |
93.93 |
93.25 |
90.06 |
95.24 |
Consumer Cyclical |
Travel Services |
16 |
98.7 |
92.23 |
98.21 |
91.72 |
2.0 |
20.0 |
203.52 |
1.0 |
1.0 |
| 40.0 |
SE |
93.78 |
94.33 |
95.18 |
19.36 |
Consumer Cyclical |
Internet Retail |
47 |
27.03 |
36.41 |
83.3 |
74.76 |
2.0 |
21.0 |
99.26 |
1.0 |
1.0 |
| 41.0 |
OKLO |
93.75 |
23.7 |
5.15 |
73.82 |
Utilities |
Utilities - Regulated Electric |
59 |
0.0 |
0.0 |
29.38 |
0.0 |
2.0 |
4.0 |
24.5 |
1.0 |
1.0 |
| 42.0 |
QFIN |
93.68 |
90.36 |
87.16 |
47.9 |
Financial |
Credit Services |
17 |
22.45 |
36.99 |
46.84 |
44.4 |
4.0 |
21.0 |
34.97 |
1.0 |
1.0 |
| 43.0 |
TRU |
93.62 |
76.97 |
66.18 |
52.19 |
Financial |
Financial Data & Stock Exchanges |
33 |
29.5 |
13.85 |
51.0 |
73.34 |
2.0 |
22.0 |
103.68 |
1.0 |
1.0 |
| 44.0 |
SPOT |
93.38 |
95.84 |
95.12 |
94.8 |
Communication Services |
Internet Content & Information |
103 |
56.41 |
90.95 |
94.42 |
96.81 |
3.0 |
6.0 |
384.35 |
1.0 |
1.0 |
| 45.0 |
TPB |
93.31 |
89.56 |
85.68 |
68.41 |
Consumer Defensive |
Tobacco |
43 |
81.34 |
87.16 |
93.24 |
61.92 |
1.0 |
7.0 |
46.72 |
1.0 |
1.0 |
| 46.0 |
SLNO |
93.22 |
93.31 |
99.96 |
99.9 |
Healthcare |
Biotechnology |
19 |
63.59 |
0.0 |
40.94 |
0.0 |
61.0 |
84.0 |
55.31 |
1.0 |
1.0 |
| 47.0 |
MNDY |
93.13 |
90.73 |
86.48 |
89.77 |
Technology |
Software - Application |
76 |
95.23 |
96.98 |
83.3 |
95.77 |
9.0 |
31.0 |
297.35 |
1.0 |
1.0 |
| 48.0 |
VNO |
92.94 |
88.48 |
80.0 |
93.65 |
Real Estate |
REIT - Office |
25 |
52.83 |
47.93 |
68.27 |
56.1 |
2.0 |
4.0 |
43.31 |
1.0 |
1.0 |
| 49.0 |
B |
92.82 |
71.05 |
36.65 |
18.18 |
Industrials |
Specialty Industrial Machinery |
40 |
6.43 |
34.9 |
77.07 |
54.48 |
3.0 |
27.0 |
46.77 |
1.0 |
1.0 |
| 50.0 |
AAON |
92.64 |
90.17 |
83.86 |
80.1 |
Industrials |
Building Products & Equipment |
58 |
75.22 |
82.16 |
88.99 |
83.86 |
4.0 |
29.0 |
121.33 |
1.0 |
1.0 |
| 51.0 |
MLI |
92.33 |
91.37 |
93.36 |
84.33 |
Industrials |
Metal Fabrication |
26 |
63.13 |
12.25 |
17.46 |
68.53 |
3.0 |
32.0 |
83.05 |
1.0 |
1.0 |
| 52.0 |
ENVA |
92.08 |
83.8 |
88.61 |
77.89 |
Financial |
Credit Services |
17 |
25.11 |
41.7 |
68.27 |
72.34 |
5.0 |
27.0 |
86.97 |
1.0 |
1.0 |
| 53.0 |
STEP |
92.05 |
91.81 |
89.69 |
89.02 |
Financial |
Asset Management |
61 |
17.63 |
80.39 |
97.76 |
66.83 |
3.0 |
28.0 |
61.58 |
1.0 |
1.0 |
| 54.0 |
AXON |
91.99 |
91.77 |
92.5 |
78.55 |
Industrials |
Aerospace & Defense |
29 |
85.7 |
81.0 |
77.07 |
97.85 |
7.0 |
33.0 |
444.76 |
1.0 |
1.0 |
| 55.0 |
UAL |
91.96 |
75.92 |
53.19 |
57.1 |
Industrials |
Airlines |
68 |
95.97 |
52.83 |
96.11 |
73.55 |
1.0 |
34.0 |
76.08 |
1.0 |
1.0 |
| 56.0 |
HLNE |
91.93 |
92.11 |
89.44 |
86.66 |
Financial |
Asset Management |
61 |
30.28 |
52.19 |
98.52 |
88.68 |
4.0 |
29.0 |
182.61 |
1.0 |
1.0 |
| 57.0 |
TGS |
91.9 |
83.55 |
92.1 |
87.19 |
Energy |
Oil & Gas Integrated |
132 |
100.0 |
84.08 |
40.94 |
40.32 |
2.0 |
2.0 |
22.15 |
1.0 |
1.0 |
| 58.0 |
IRM |
91.87 |
92.02 |
91.57 |
77.49 |
Real Estate |
REIT - Specialty |
53 |
61.76 |
32.4 |
94.42 |
83.1 |
1.0 |
7.0 |
128.13 |
1.0 |
1.0 |
| 59.0 |
LGND |
91.81 |
87.93 |
88.89 |
27.19 |
Healthcare |
Biotechnology |
19 |
76.12 |
66.66 |
98.9 |
81.96 |
67.0 |
94.0 |
113.37 |
1.0 |
1.0 |
| 60.0 |
ALKT |
91.68 |
91.56 |
87.87 |
95.89 |
Technology |
Software - Application |
76 |
43.39 |
83.28 |
78.57 |
55.41 |
12.0 |
40.0 |
38.77 |
1.0 |
1.0 |
| 61.0 |
PTCT |
91.65 |
90.02 |
71.61 |
5.4 |
Healthcare |
Biotechnology |
19 |
45.71 |
27.14 |
34.72 |
49.84 |
68.0 |
96.0 |
40.47 |
1.0 |
1.0 |
| 62.0 |
JLL |
91.28 |
90.85 |
87.22 |
73.98 |
Real Estate |
Real Estate Services |
15 |
75.19 |
80.94 |
15.85 |
93.8 |
5.0 |
8.0 |
273.07 |
1.0 |
1.0 |
| 63.0 |
UI |
91.22 |
91.68 |
73.27 |
2.82 |
Technology |
Communication Equipment |
1 |
10.67 |
8.82 |
97.52 |
91.62 |
6.0 |
42.0 |
258.6 |
1.0 |
1.0 |
| 64.0 |
TCBX |
91.0 |
77.21 |
79.94 |
81.87 |
Financial |
Banks - Regional |
22 |
82.8 |
60.92 |
83.3 |
50.74 |
9.0 |
34.0 |
32.79 |
1.0 |
1.0 |
| 65.0 |
PRIM |
90.97 |
91.28 |
87.5 |
93.16 |
Industrials |
Engineering & Construction |
21 |
68.2 |
78.44 |
90.06 |
69.26 |
7.0 |
38.0 |
63.56 |
1.0 |
1.0 |
| 66.0 |
PRMW |
90.54 |
90.88 |
89.41 |
65.27 |
Consumer Defensive |
Beverages - Non-Alcoholic |
107 |
92.08 |
65.12 |
79.65 |
45.79 |
1.0 |
11.0 |
27.09 |
1.0 |
1.0 |
| 67.0 |
TECX |
90.39 |
85.46 |
31.44 |
91.1 |
Healthcare |
Biotechnology |
19 |
52.27 |
0.0 |
87.62 |
0.0 |
75.0 |
106.0 |
39.45 |
1.0 |
1.0 |
**** FONDAMENTALE ****NVDA
***************************
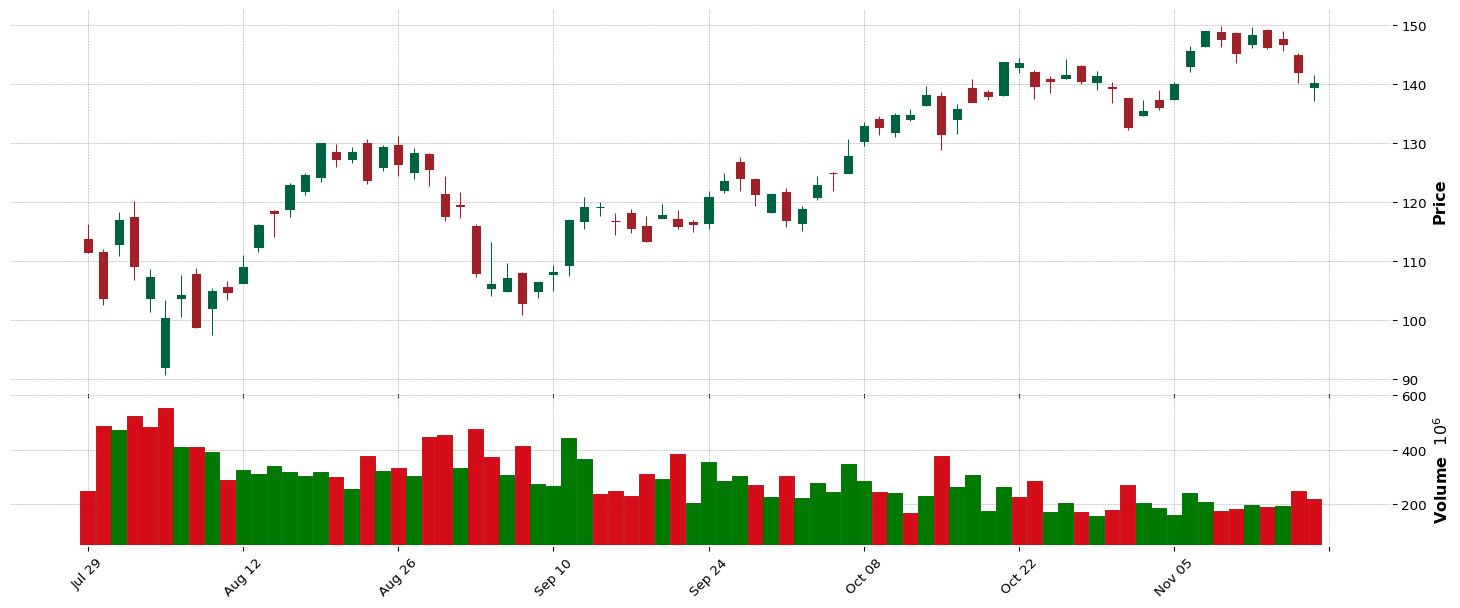
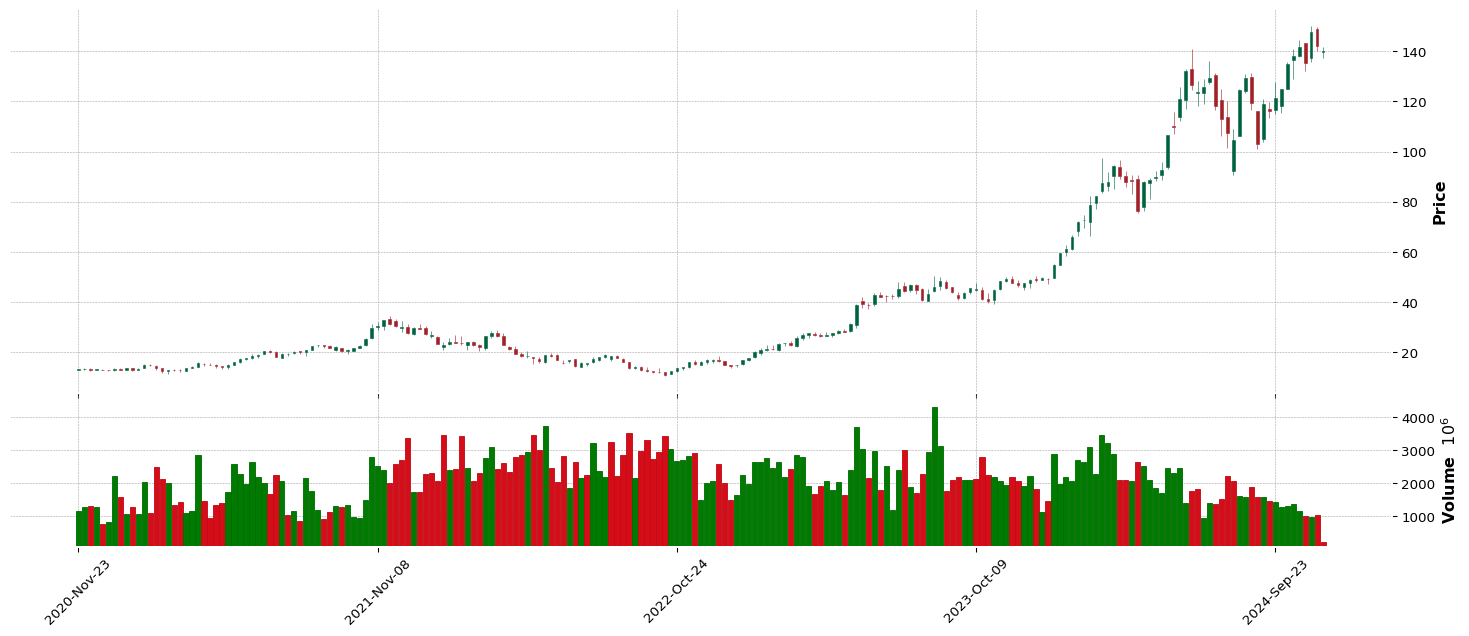
--> GENERAL INFORMATION NVDA :
| Total stock number: | 23.54B |
| Market Cap: | 3469.438905487B |
| Namee: | NVIDIA Corporation |
| IPO date: | 1999-01-22 |
| Type of Sector: | Technology |
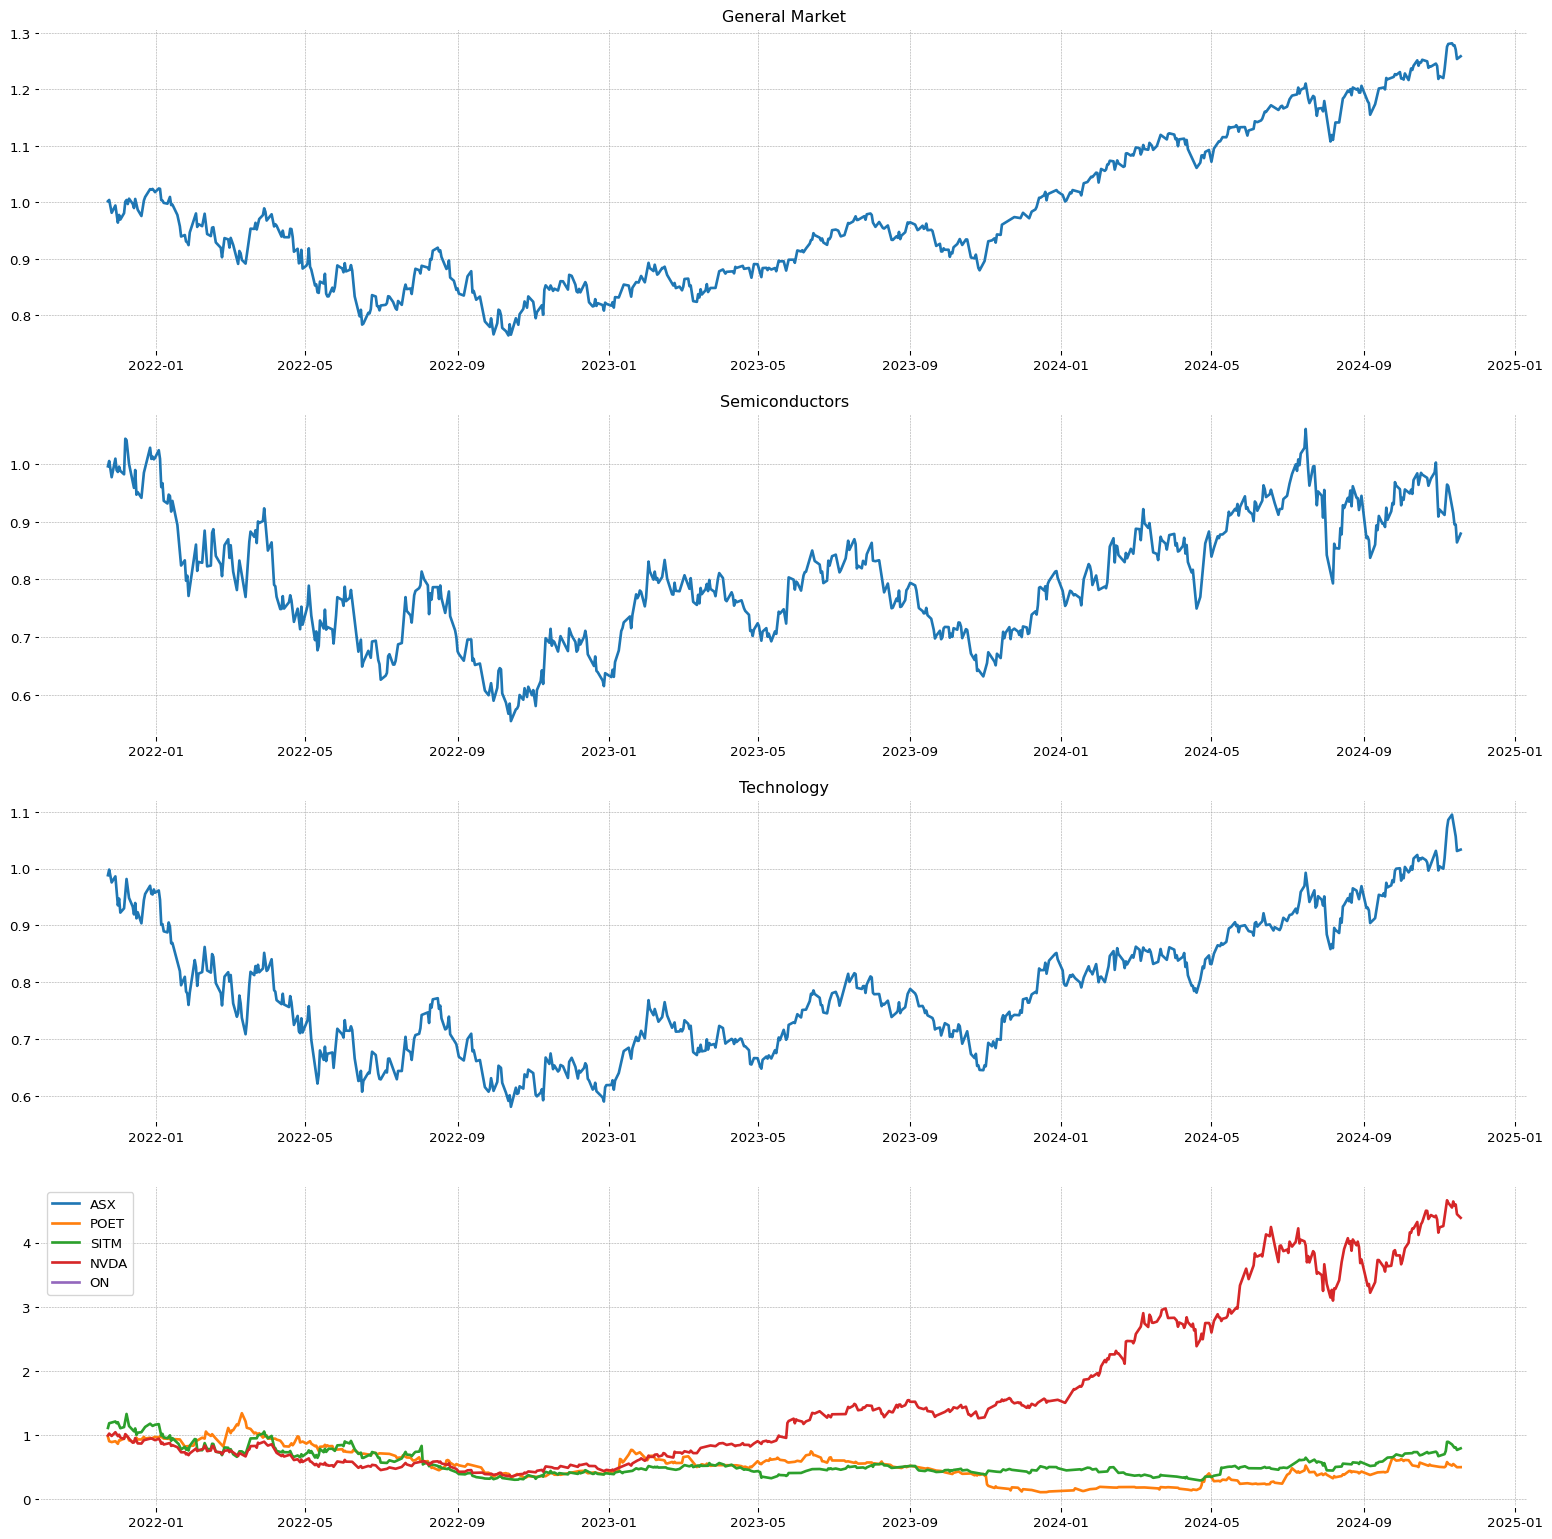
| Sector Position: | 2/11 |
| RSI Sector: | 30/445 |
| Type of industry: | Semiconductors |
| Industry stock position: | 79/147 |
| Industry stock position: | 1/47 |
| RS Rating: | 97.84 |
| EPS Rating: | 98.76 |
| SMR Rating: | 99.9 |
| 1 year return: | 244.58 |
| Stability Value of Earnigs: | 61.75 |

Top competitor on same industry:
| Stock: | RS | EPS | SMR | 2Q | 1Q |
| NVDA | 97 | 98 | 99 | 622 | 172 |
| SMTC | 97 | 35 | 19 | 21 | 56 |
| CRDO | 96 | 45 | 59 | 41 | 26 |
| ARM | 96 | 68 | 0 | 7486 | 110 |
| SKYT | 92 | 44 | 43 | -23 | 78 |
| TSM | 92 | 67 | 38 | 9 | 36 |
| AVGO | 89 | 0 | 0 | 0 | 0 |
| MPWR | 89 | 52 | 24 | -18 | -1 |
| TSEM | 88 | 71 | 23 | -38 | 2 |
| CRUS | 85 | 87 | 88 | 185 | 182 |
--->QUARTER
| 3Q | 2Q | 1Q |
| Increase Earnings of last quarters: | 777.19 | 622.89 | 172.0% |
| Quarter maggiori 20% / 50% / 100% in 20: | 7 | 5 | 5 |
| Percentage surprise: | 13.04 | 8.92 | 6.25% |
| 2Q Increase Earnings: | 1042.3 | 700.04 | 397.44% |
| 5/3/1 anno di Earnigs: | 0.16 | 0.24 | 0.54 |
| Perc. increase 3/1 Earnigs Vs 5/3: | | 45.36 | 124.45% |
| Revenue increase: | 265.27 | 262.12 | 122.4% |
| 2Q Revenue increase: | 235.39 | 263.7 | 192.26% |
| NeT income Ratio: | 55.58 | 57.13 | 55.25% |
| NeT income Increase: | 137.84 | 101.14 | 20.61% |
| EARNINGS | This Q | Next Q |
| this and next q growth: | 94.73 | 62.0% |
| Revision % of extimate growth | 0.0 | 0.0% |
| This Quarter / Next Quarter | 0.74 | 0.81 |
| last 7 | 0.74 | 0.81 |
| last 30 | 0.74 | 0.81 |
| last 60 | 0.64 | 0.71 |
| last 90 | 0.7 | 0.77 |
| REVENUE | This Q | Next Q |
| Growth sales extimation: | -- | 65.30% |
--->ANNUAL
| 2022 | 2023 | 2024 | ttm |
| Earnings A/A increase: | 116.66 | -53.84 | 572.22% |
| Earnings 2 A/A increase: | 83.33 | 31.41 | 259.18% |
| ROE value: | 44.83 | 17.93 | 91.45 | 98.8% |
| Net income Increase: | 125.11 | -55.2 | 581.31% |
--> Annual breakout:
2015/0.028
2016/0.028
2017/0.077
2018/0.13
2019/0.17
2020/0.12
2021/0.18
2022/0.39
2023/0.18
2024/1.21
2025/2.84
2026/4.06 |
| Current Year | Next Year |
| Sales Improve: | 125.60% | 42.60% |
| |
| EPS Growth Estimates |
|
| Current Qtr. | 100.00% |
| Next Qtr. | 72.30% |
| Current Year | 138.70% |
| Next Year | 43.00% |
| Next 5 Years (per annum) | 57.38% |
| Past 5 Years (per annum) | 66.59% |
--> Fincancial Situation yaer/year
| 2021 | 2022 | 2024 | ttm |
| Current Liabilities/Current Asset: | 15.03 | 28.44 | 23.97% |
| Non Current Liabilities/Non current Asset: | 86.2 | 69.12 | 56.67% |
| Total Liabilities/Current Asset: | 60.96 | 82.69 | 51.3% |
| Y/Y short debt situation: | 10.44 | 51.39 | 61.98% |
| Y/Y long debt situation: | 66.06 | -5.45 | -3.18% |
--> 2Q average 3I
| 3Q | 2Q | 1Q |
| 2Q Increase Earnings: | 1042.3 | 700.04 | 397.44% |
| 2Q Revenue increase: | 235.39 | 263.7 | 192.26% |
| 2Q NeT income Ratio: | 53.29 | 56.35 | 56.19% |

**** FONDAMENTALE ****CLS
***************************
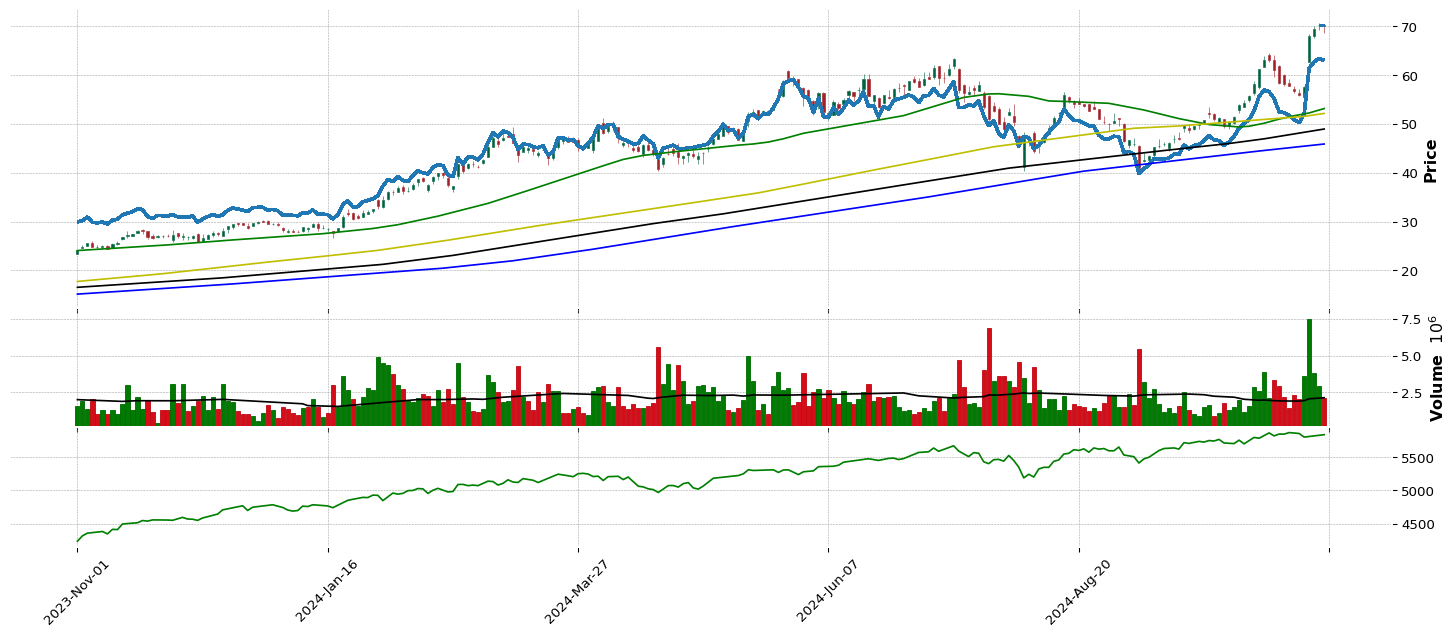
--> GENERAL INFORMATION CLS :
| Total stock number: | 116.94M |
| Market Cap: | 8.443030366B |
| Namee: | Celestica Inc. |
| IPO date: | 1998-06-30 |
| Type of Sector: | Technology |
| Sector Position: | 2/11 |
| RSI Sector: | 38/445 |
| Type of industry: | Electronic Components |
| Industry stock position: | 39/147 |
| Industry stock position: | 1/22 |
| RS Rating: | 96.76 |
| EPS Rating: | 99.22 |
| SMR Rating: | 96.63 |
| 1 year return: | 201.07 |
| Stability Value of Earnigs: | 24.65 |

Top competitor on same industry:
| Stock: | RS | EPS | SMR | 2Q | 1Q |
| CLS | 96 | 99 | 96 | 324 | 78 |
| OUST | 88 | 0 | 0 | 0 | 0 |
| BHE | 86 | 86 | 52 | 11 | 10 |
| FLEX | 85 | 44 | 46 | 16 | -42 |
| GLW | 83 | 36 | 16 | 19 | -80 |
| TTMI | 82 | 96 | 46 | 276 | 291 |
| APH | 81 | 66 | 68 | 24 | 12 |
| FN | 75 | 0 | 0 | 0 | 0 |
| OLED | 68 | 64 | 39 | 43 | 5 |
| PLXS | 67 | 32 | 23 | -60 | 61 |
--->QUARTER
| 3Q | 2Q | 1Q |
| Increase Earnings of last quarters: | 324.99 | 78.72 | 18.18% |
| Quarter maggiori 20% / 50% / 100% in 20: | 1 | 0 | 0 |
| Percentage surprise: | 19.44 | 12.34 | 10.63% |
| 2Q Increase Earnings: | 216.78 | 201.86 | 48.45% |
| 5/3/1 anno di Earnigs: | 0.34 | 0.49 | 0.8 |
| Perc. increase 3/1 Earnigs Vs 5/3: | | 42.95 | 60.8% |
| Revenue increase: | 19.65 | 23.3 | 23.31% |
| 2Q Revenue increase: | 13.67 | 21.48 | 23.3% |
| NeT income Ratio: | 4.62 | 4.16 | 3.66% |
| NeT income Increase: | 244.1 | 45.53 | -6.52% |
| EARNINGS | This Q | Next Q |
| this and next q growth: | 42.46 | 17.64% |
| Revision % of extimate growth | 10.63 | 7.52% |
| This Quarter / Next Quarter | 1.04 | 1.0 |
| last 7 | 0.95 | 0.94 |
| last 30 | 0.94 | 0.93 |
| last 60 | 0.94 | 0.93 |
| last 90 | 0.94 | 0.93 |
| REVENUE | This Q | Next Q |
| Growth sales extimation: | 17.10% | 8.90% |
--->ANNUAL
| 2021 | 2022 | 2023 | ttm |
| Earnings A/A increase: | 65.3 | 39.5 | 83.18% |
| Earnings 2 A/A increase: | 27.19 | 52.4 | 61.34% |
| ROE value: | 7.23 | 9.26 | 14.23 | 20.88% |
| Net income Increase: | 71.45 | 40.03 | 68.1% |
--> Annual breakout:
2014/0.61
2015/0.43
2016/0.98
2017/0.74
2018/0.71
2019/0.55
2020/0.49
2021/0.81
2022/1.13
2023/2.07
2024/3.85
2025/4.44 |
| Current Year | Next Year |
| Sales Improve: | 20.70% | 9.90% |
| |
| EPS Growth Estimates |
|
| Current Qtr. | 36.80% |
| Next Qtr. | 16.30% |
| Current Year | 58.40% |
| Next Year | 15.30% |
| Next 5 Years (per annum) | 28.00% |
| Past 5 Years (per annum) | 44.09% |
--> Fincancial Situation yaer/year
| 2020 | 2021 | 2023 | ttm |
| Current Liabilities/Current Asset: | 65.59 | 70.6 | 71.34% |
| Non Current Liabilities/Non current Asset: | 77.16 | 68.8 | 65.5% |
| Total Liabilities/Current Asset: | 93.26 | 91.29 | 91.34% |
| Y/Y short debt situation: | 42.78 | 35.57 | 4.83% |
| Y/Y long debt situation: | 40.4 | -5.81 | 0.33% |
--> 2Q average 3I
| 3Q | 2Q | 1Q |
| 2Q Increase Earnings: | 216.78 | 201.86 | 48.45% |
| 2Q Revenue increase: | 13.67 | 21.48 | 23.3% |
| 2Q NeT income Ratio: | 4.22 | 4.39 | 3.91% |
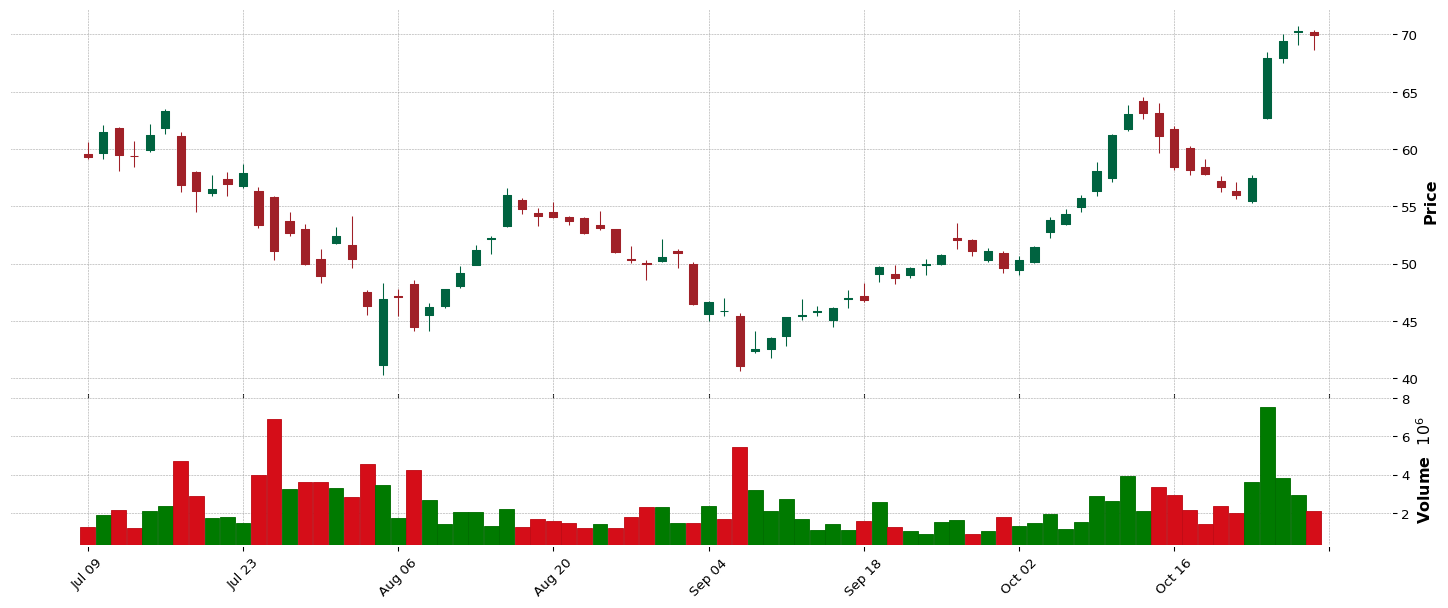
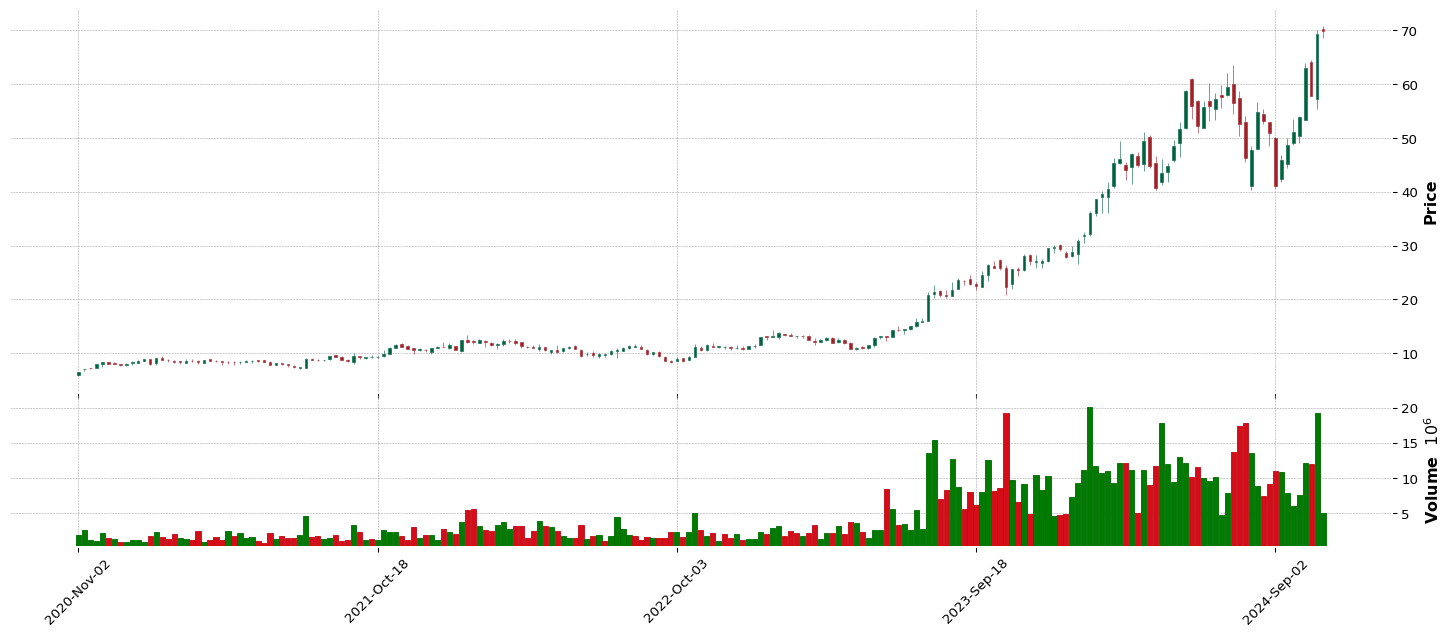
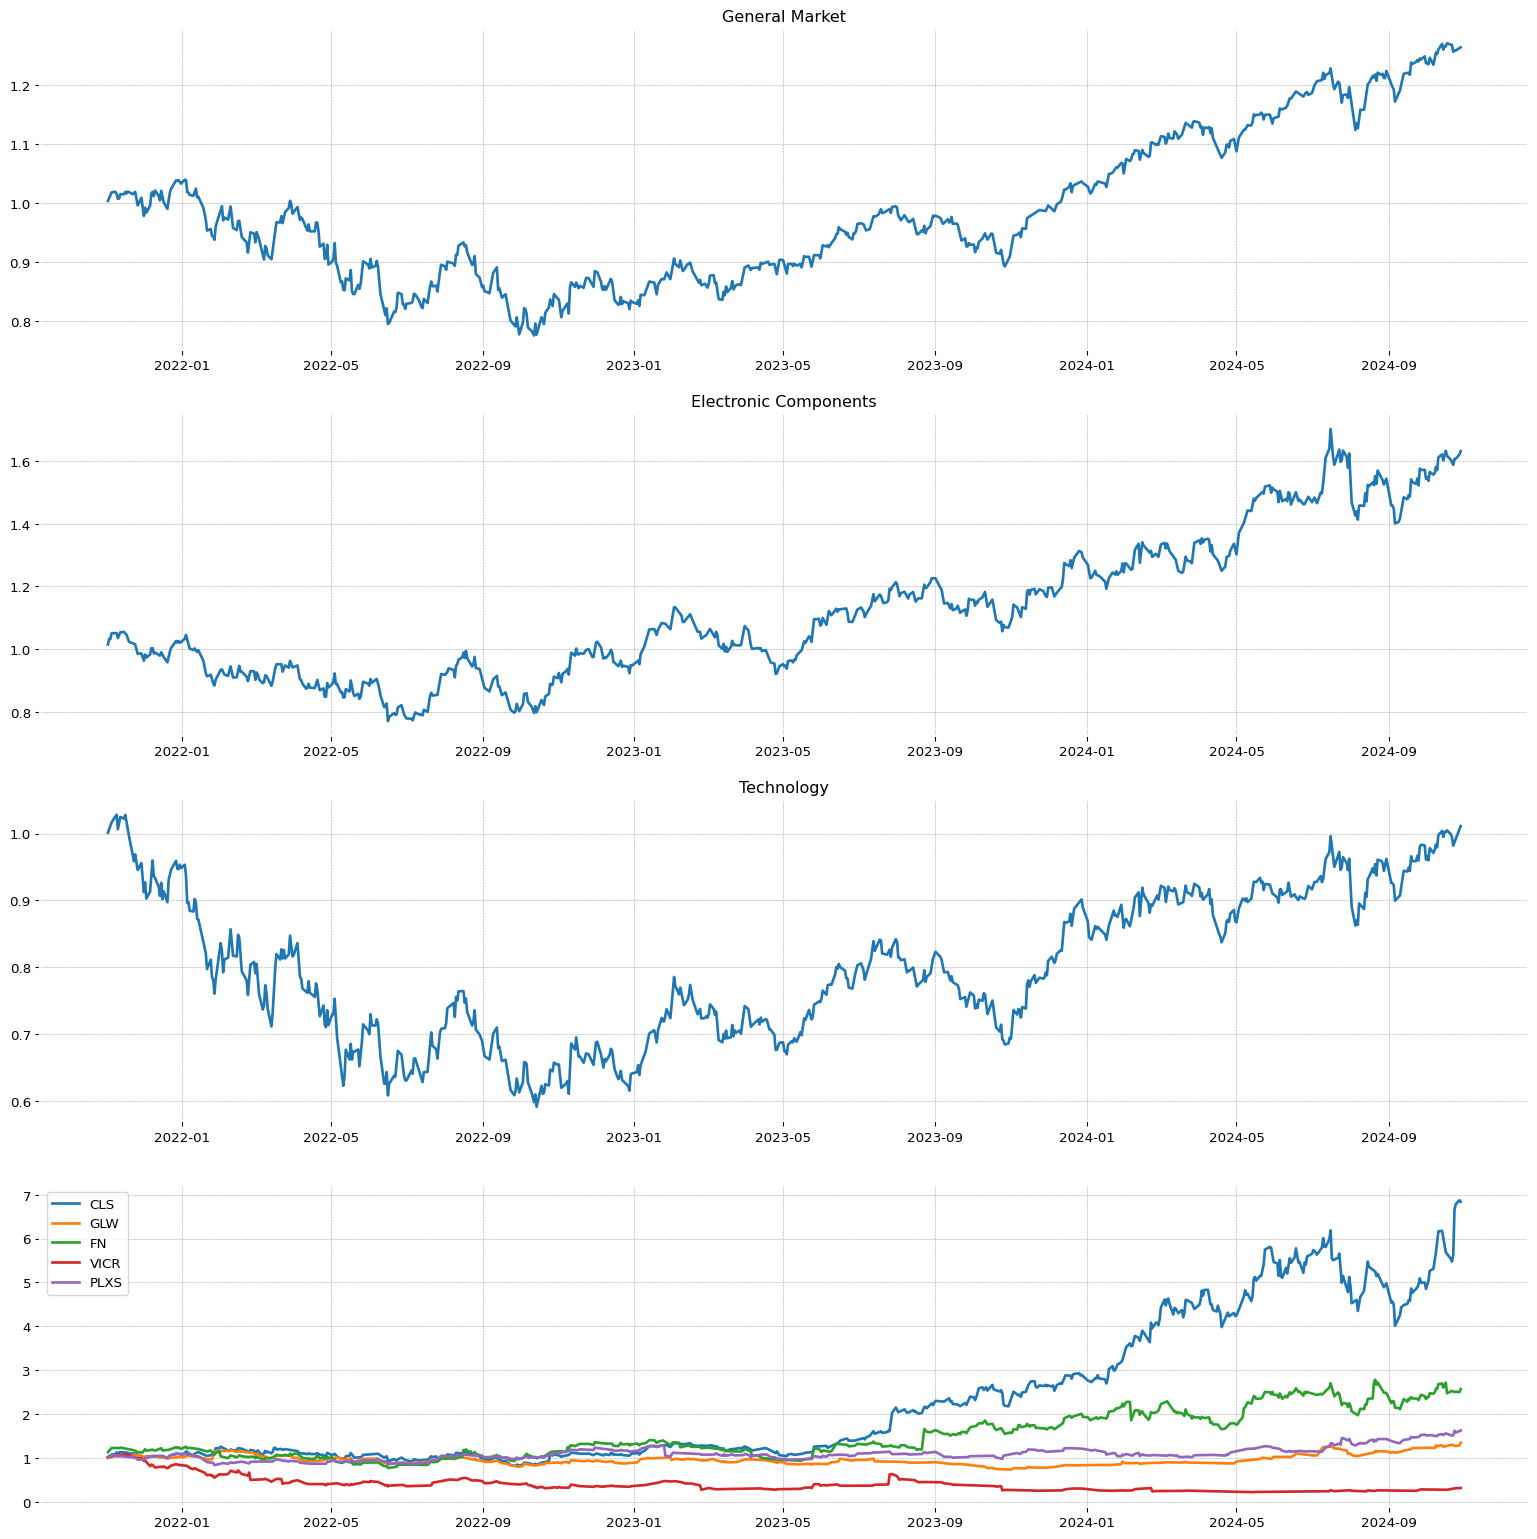
**** 8585 ****
**** 8585 ****HIMS
***************************
--> GENERAL INFORMATION HIMS :
| Total stock number: | 187.39M |
| Market Cap: | 4.831675936B |
| Namee: | Hims & Hers Health, Inc. |
| IPO date: | 2019-09-13 |
| Type of Sector: | Consumer Defensive |
| Sector Position: | 10/11 |
| RSI Sector: | 4/147 |
| Type of industry: | Household & Personal Products |
| Industry stock position: | 123/147 |
| Industry stock position: | 1/19 |
| RS Rating: | 98.27 |
| EPS Rating: | 95.08 |
| SMR Rating: | 94.38 |
| 1 year return: | 285.95 |
| Stability Value of Earnigs: | 50.63 |

Top competitor on same industry:
| Stock: | RS | EPS | SMR | 2Q | 1Q |
| HIMS | 98 | 95 | 94 | 202 | 280 |
| HNST | 97 | 57 | 90 | 92 | 70 |
| NWL | 64 | 55 | 50 | 91 | 152 |
| CLX | 57 | 50 | 84 | 75 | 22 |
| UL | 55 | 48 | 42 | 2 | 28 |
| CL | 50 | 59 | 90 | 84 | 45 |
| KVUE | 45 | 35 | 42 | -11 | -86 |
| SPB | 40 | 24 | 90 | 210 | -99 |
| ELF | 39 | 88 | 80 | 36 | -16 |
| KMB | 33 | 53 | 64 | 14 | 1363 |
--->QUARTER
| 3Q | 2Q | 1Q |
| Increase Earnings of last quarters: | 111.15 | 202.88 | 280.75% |
| Quarter maggiori 20% / 50% / 100% in 20: | 8 | 5 | 3 |
| Percentage surprise: | 150.0 | 316.66 | 40.41% |
| 2Q Increase Earnings: | 85.96 | 157.01 | 241.81% |
| 5/3/1 anno di Earnigs: | -0.09 | -0.04 | 0.02 |
| Perc. increase 3/1 Earnigs Vs 5/3: | | 53.11 | 144.47% |
| Revenue increase: | 47.49 | 45.81 | 51.81% |
| 2Q Revenue increase: | 52.0 | 46.65 | 48.81% |
| NeT income Ratio: | 0.5 | 4.0 | 4.21% |
| NeT income Increase: | 107.73 | 175.8 | 222.37% |
| EARNINGS | This Q | Next Q |
| this and next q growth: | 211.11 | 1086.44% |
| Revision % of extimate growth | 0.0 | 0.0% |
| This Quarter / Next Quarter | 0.04 | 0.07 |
| last 7 | 0.04 | 0.07 |
| last 30 | 0.04 | 0.07 |
| last 60 | 0.05 | 0.08 |
| last 90 | 0.04 | 0.04 |
| REVENUE | This Q | Next Q |
| Growth sales extimation: | 68.30% | 70.50% |
--->ANNUAL
| 2021 | 2022 | 2023 | ttm |
| Earnings A/A increase: | -13.72 | 44.82 | 65.62% |
| Earnings 2 A/A increase: | 34.22 | 15.55 | 55.22% |
| ROE value: | -114.68 | -20.32 | -7.18 | 5.12% |
| Net income Increase: | -494.34 | 38.99 | 64.14% |
--> Annual breakout:
2018/-1.12
2019/-2.86
2020/-0.51
2021/-0.58
2022/-0.32
2023/-0.11
2024/0.23
2025/0.36 |
| Current Year | Next Year |
| Sales Improve: | 58.70% | 34.20% |
| |
| EPS Growth Estimates |
|
| Current Qtr. | 200.00% |
| Next Qtr. | 600.00% |
| Current Year | 309.10% |
| Next Year | 56.50% |
| Next 5 Years (per annum) | 94.90% |
| Past 5 Years (per annum) | -- |
--> Fincancial Situation yaer/year
| 2020 | 2021 | 2023 | ttm |
| Current Liabilities/Current Asset: | 29.35 | 22.13 | 33.37% |
| Non Current Liabilities/Non current Asset: | 4.47 | 4.44 | 4.93% |
| Total Liabilities/Current Asset: | 31.85 | 25.2 | 36.65% |
| Y/Y short debt situation: | 420.23 | -39.48 | 84.53% |
| Y/Y long debt situation: | -97.3 | -1.27 | 30.48% |
--> 2Q average 3I
| 3Q | 2Q | 1Q |
| 2Q Increase Earnings: | 85.96 | 157.01 | 241.81% |
| 2Q Revenue increase: | 52.0 | 46.65 | 48.81% |
| 2Q NeT income Ratio: | -1.41 | 2.25 | 4.1% |
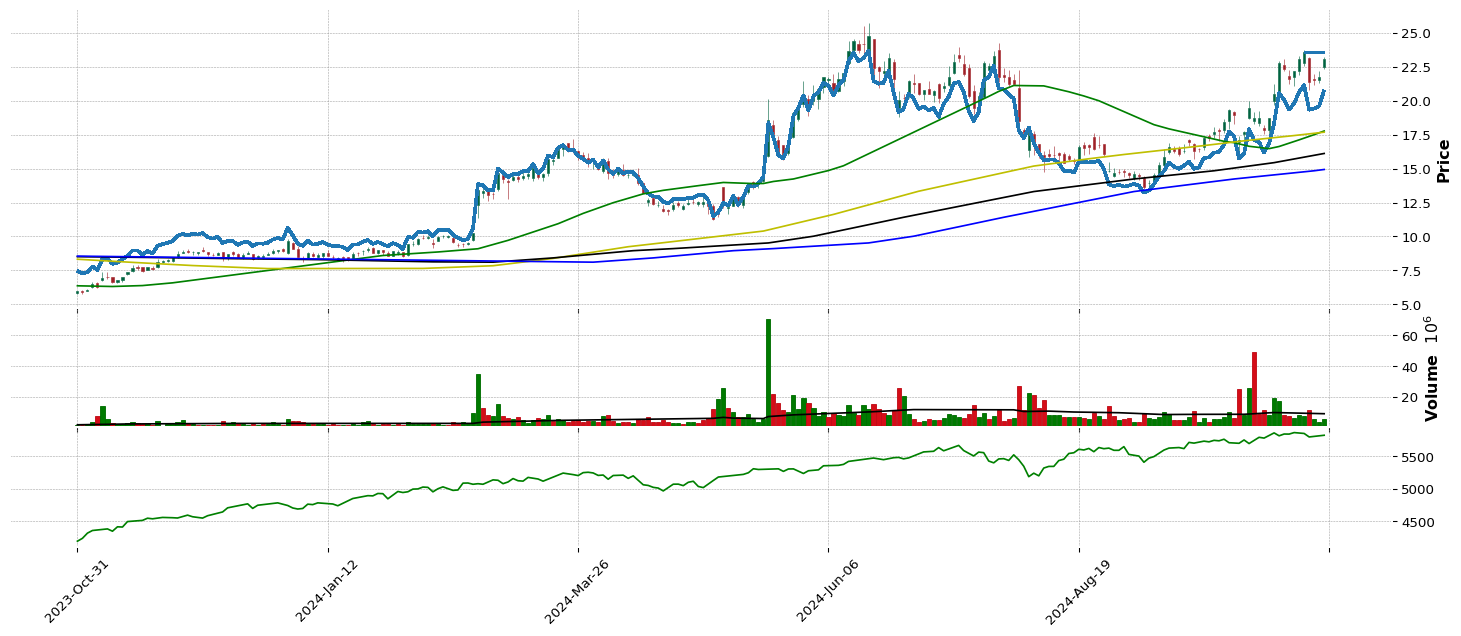
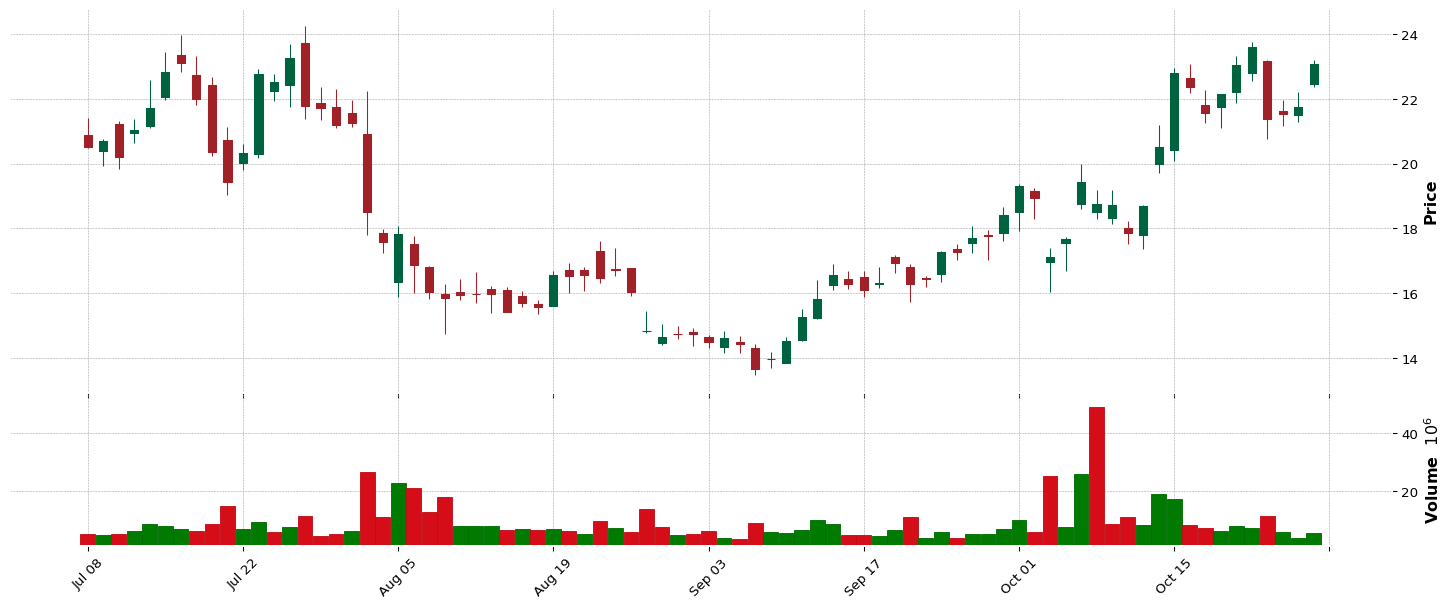
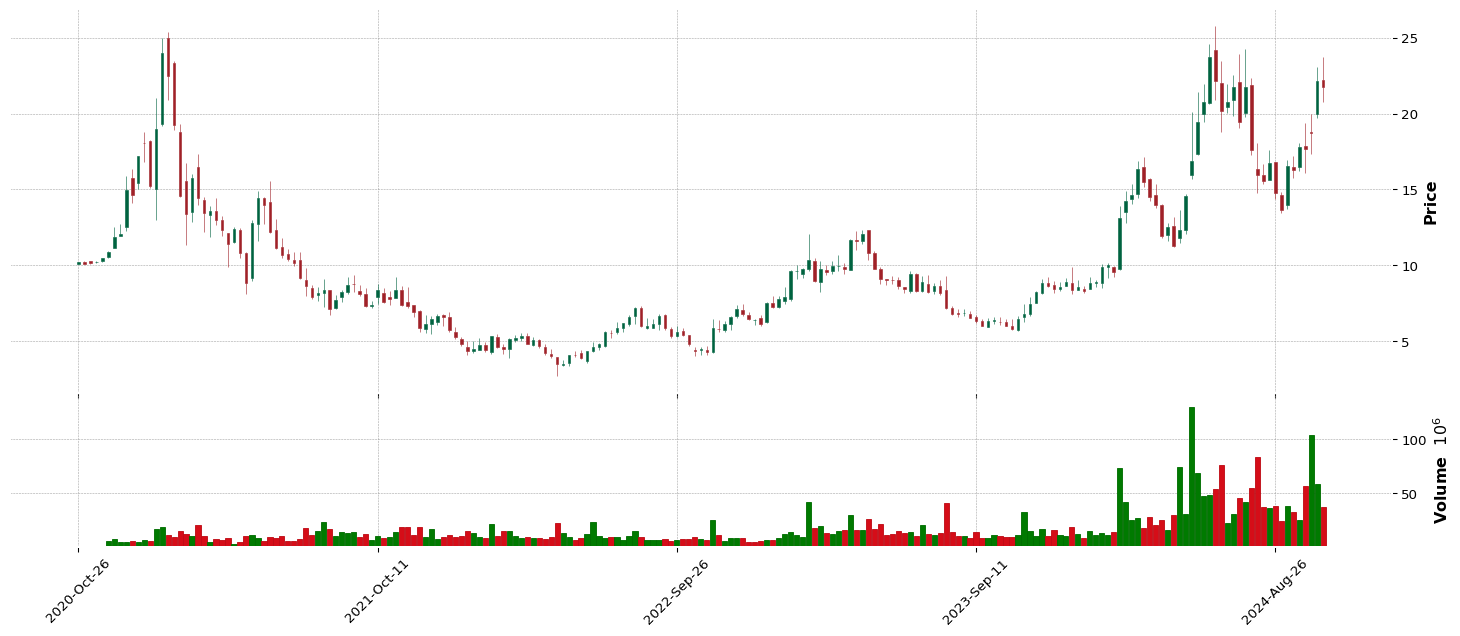
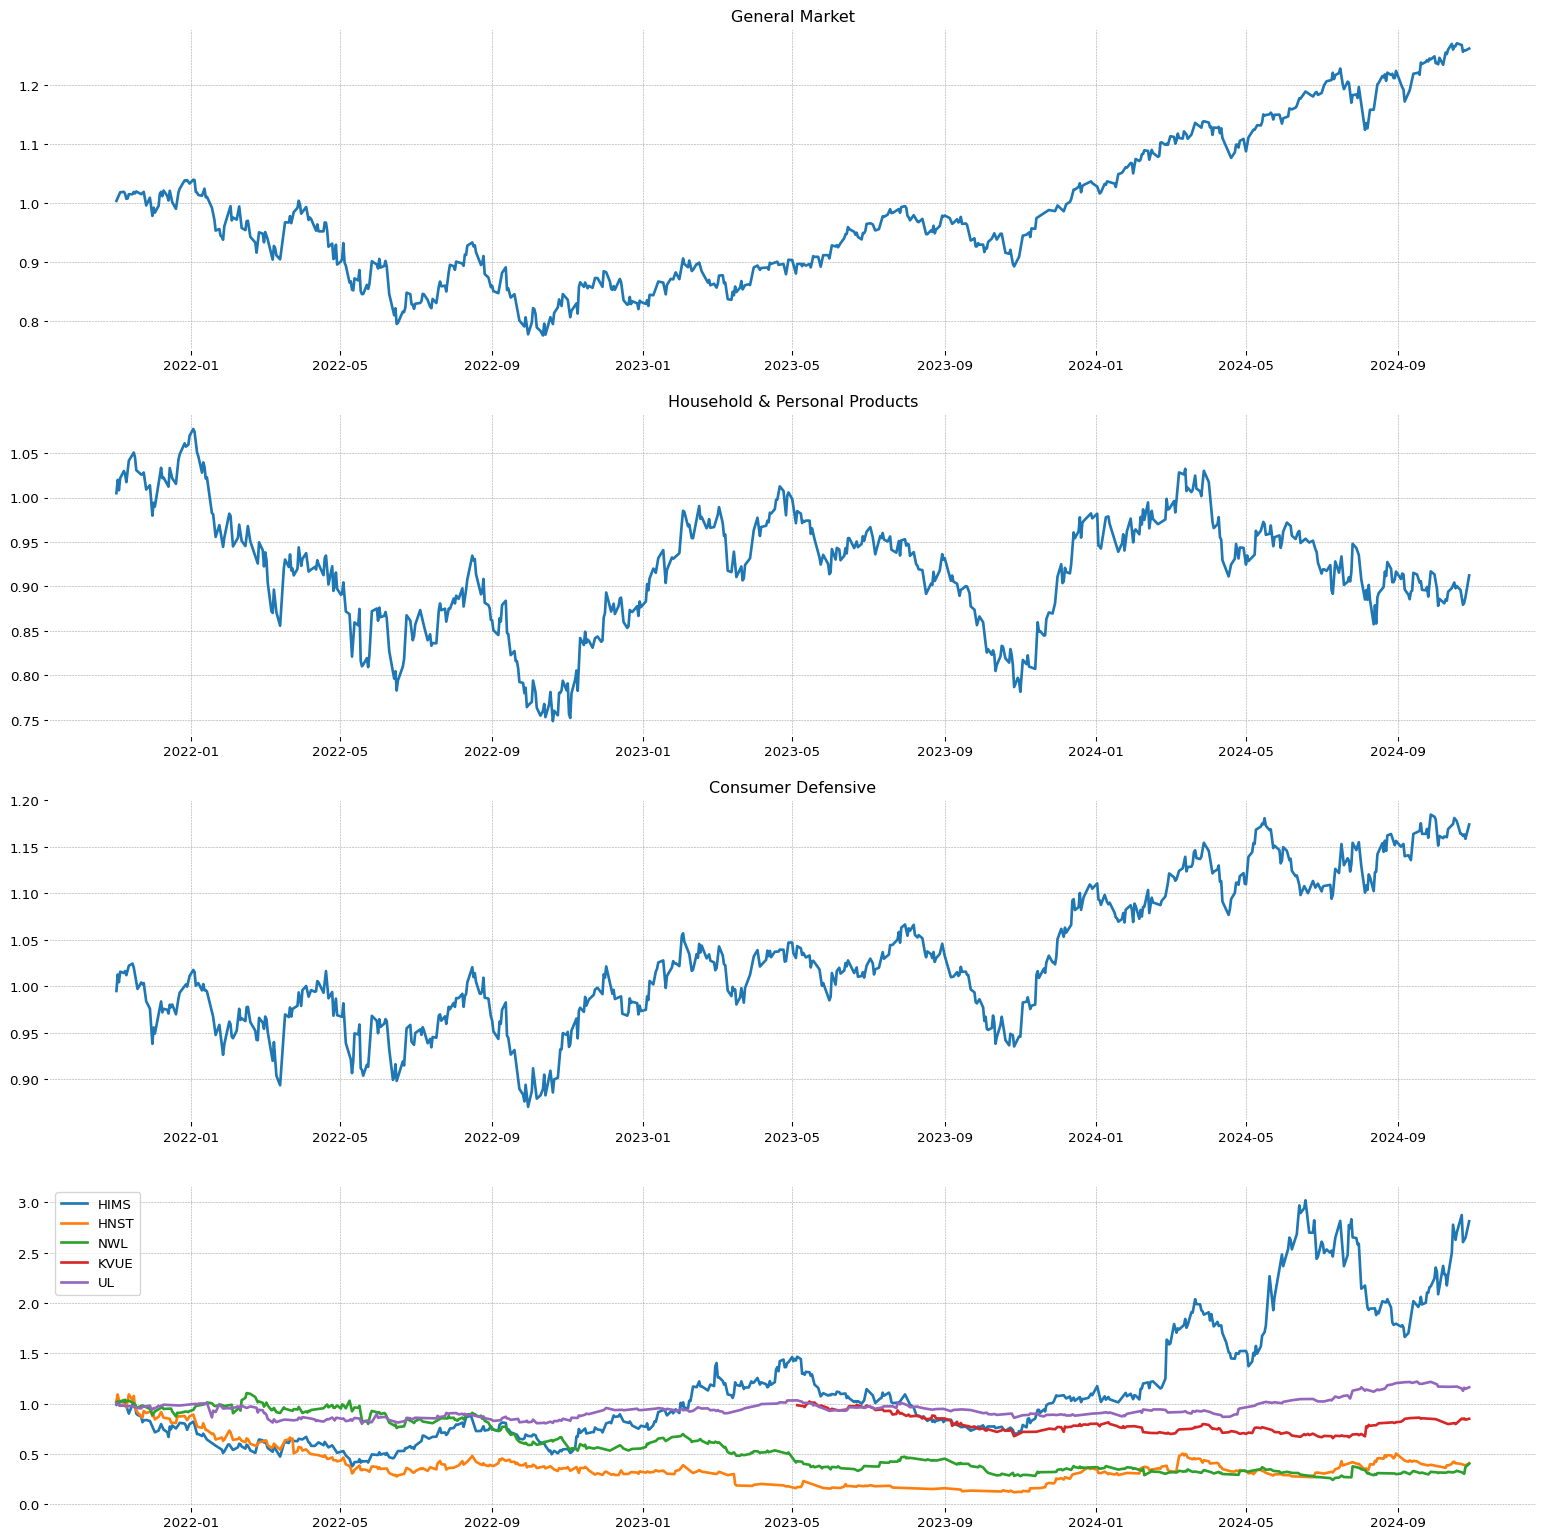
**** 8585 ****IESC
***************************
--> GENERAL INFORMATION IESC :
| Total stock number: | 8.76M |
| Market Cap: | 4.267796324B |
| Namee: | IES Holdings, Inc. |
| IPO date: | 1998-01-28 |
| Type of Sector: | Industrials |
| Sector Position: | 7/11 |
| RSI Sector: | 22/402 |
| Type of industry: | Engineering & Construction |
| Industry stock position: | 21/147 |
| Industry stock position: | 2/31 |
| RS Rating: | 97.69 |
| EPS Rating: | 94.77 |
| SMR Rating: | 99.0 |
| 1 year return: | 239.56 |
| Stability Value of Earnigs: | 40.3 |

Top competitor on same industry:
| Stock: | RS | EPS | SMR | 2Q | 1Q |
| TPC | 98 | 0 | 0 | 0 | 0 |
| IESC | 97 | 94 | 99 | 181 | 274 |
| AGX | 96 | 82 | 57 | 268 | 43 |
| WLDN | 95 | 99 | 89 | 212 | 1007 |
| DY | 92 | 91 | 42 | 22 | 14 |
| FIX | 91 | 90 | 92 | 68 | 93 |
| ROAD | 90 | 81 | 98 | 80 | 42 |
| STRL | 90 | 93 | 87 | 56 | 31 |
| EME | 90 | 98 | 96 | 79 | 77 |
| MTZ | 90 | 36 | 15 | 49 | 120 |
--->QUARTER
| 3Q | 2Q | 1Q |
| Increase Earnings of last quarters: | 64.34 | 181.72 | 274.39% |
| Quarter maggiori 20% / 50% / 100% in 20: | 8 | 7 | 2 |
| Percentage surprise: | 76.92 | -1940.0 | -1830.5% |
| 2Q Increase Earnings: | 88.5 | 123.03 | 228.05% |
| 5/3/1 anno di Earnigs: | 0.97 | 1.25 | 2.31 |
| Perc. increase 3/1 Earnigs Vs 5/3: | | 27.94 | 85.2% |
| Revenue increase: | 10.36 | 24.05 | 31.47% |
| 2Q Revenue increase: | 7.74 | 17.2 | 27.76% |
| NeT income Ratio: | 6.45 | 7.49 | 8.08% |
| NeT income Increase: | 40.55 | 97.9 | 109.49% |
| EARNINGS | This Q | Next Q |
| this and next q growth: | -100.0 | -100.0% |
| Revision % of extimate growth | 100.0 | 100.0% |
| This Quarter / Next Quarter | 0.0 | 0.0 |
| last 7 | -0.44 | -0.09 |
| last 30 | -0.44 | -0.09 |
| last 60 | -0.44 | -0.09 |
| last 90 | -0.44 | -0.09 |
| REVENUE | This Q | Next Q |
| Growth sales extimation: | -- | -- |
--->ANNUAL
| 2021 | 2022 | 2023 | ttm |
| Earnings A/A increase: | 60.5 | -54.82 | 215.86% |
| Earnings 2 A/A increase: | 43.54 | 2.83 | 80.51% |
| ROE value: | 20.33 | 9.13 | 24.32 | 32.25% |
| Net income Increase: | 60.23 | -47.85 | 211.51% |
--> Annual breakout:
2014/0.29
2015/0.77
2016/5.63
2017/0.62
2018/-0.67
2019/1.58
2020/2.0
2021/3.21
2022/1.45
2023/4.58
2024/0
2025/0 |
| Current Year | Next Year |
| Sales Improve: | -- | -- |
| |
| EPS Growth Estimates |
|
| Current Qtr. | -- |
| Next Qtr. | -- |
| Current Year | -- |
| Next Year | -- |
| Next 5 Years (per annum) | -- |
| Past 5 Years (per annum) | -31.42% |
--> Fincancial Situation yaer/year
| 2020 | 2021 | 2023 | ttm |
| Current Liabilities/Current Asset: | 64.35 | 64.36 | 59.67% |
| Non Current Liabilities/Non current Asset: | 29.92 | 45.87 | 26.13% |
| Total Liabilities/Current Asset: | 81.8 | 87.15 | 71.75% |
| Y/Y short debt situation: | 28.54 | 28.97 | -0.33% |
| Y/Y long debt situation: | 156.06 | 68.4 | -43.01% |
--> 2Q average 3I
| 3Q | 2Q | 1Q |
| 2Q Increase Earnings: | 88.5 | 123.03 | 228.05% |
| 2Q Revenue increase: | 7.74 | 17.2 | 27.76% |
| 2Q NeT income Ratio: | 6.13 | 6.97 | 7.78% |
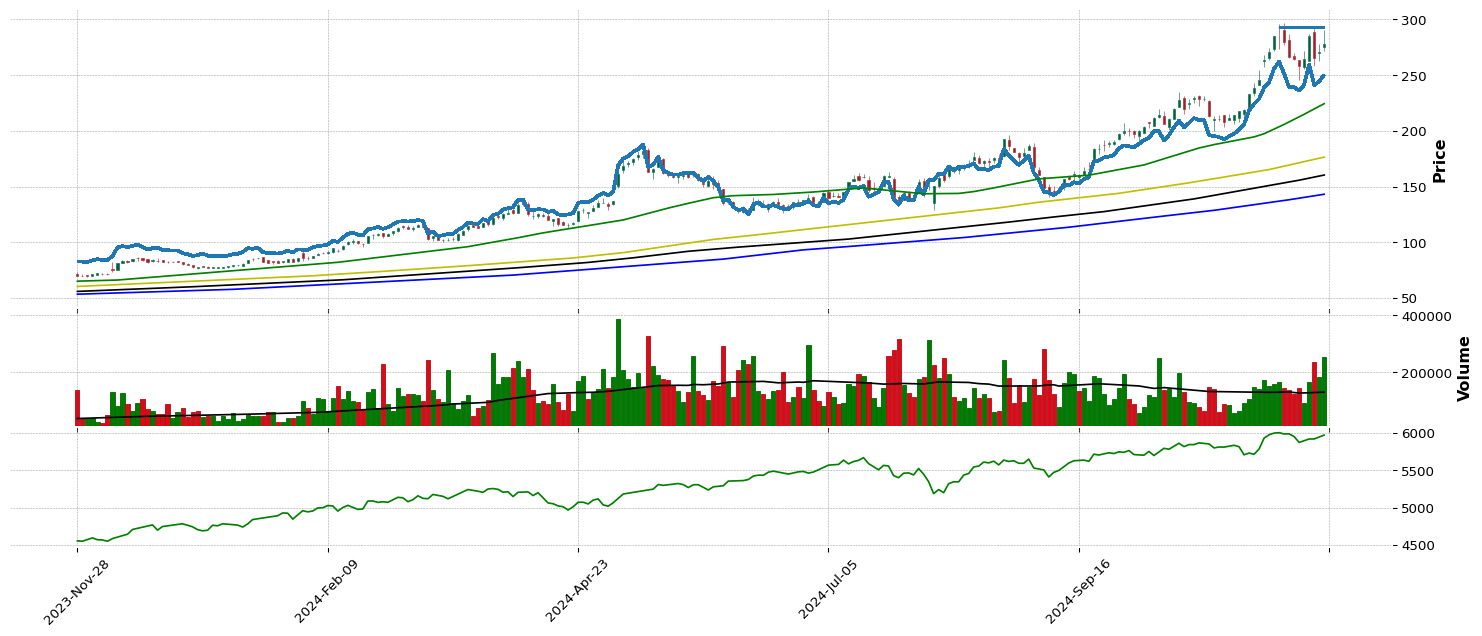
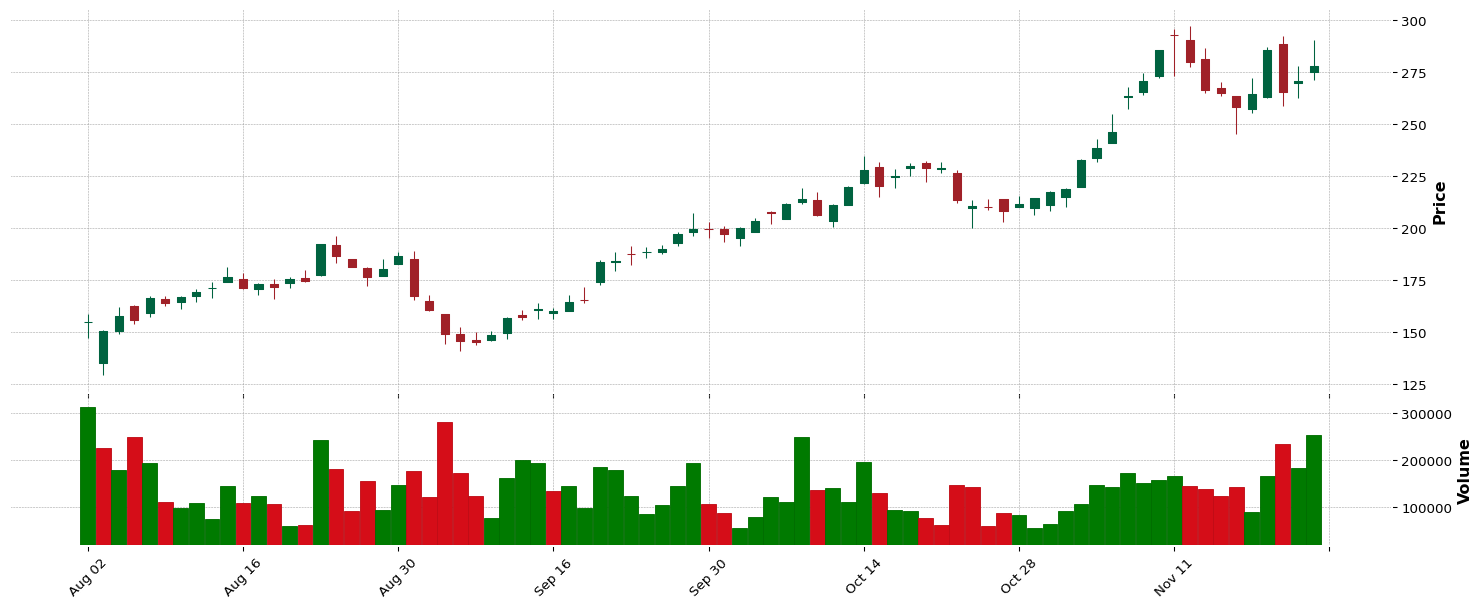
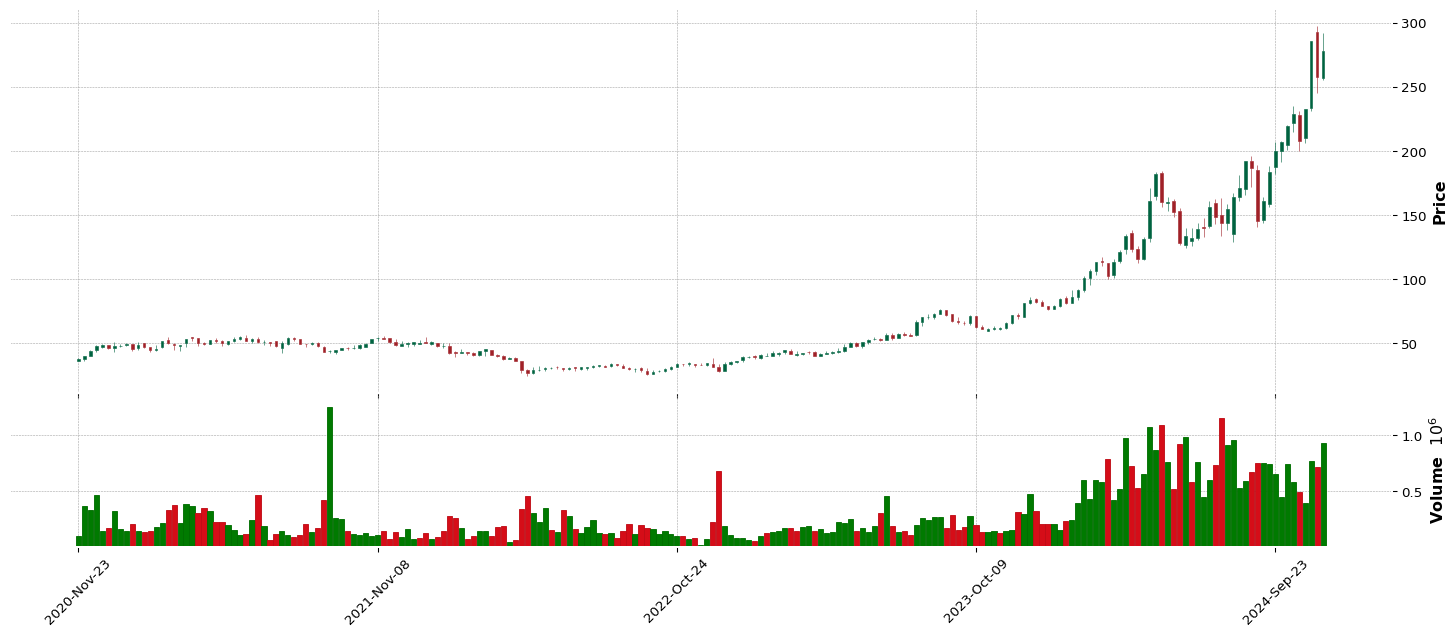
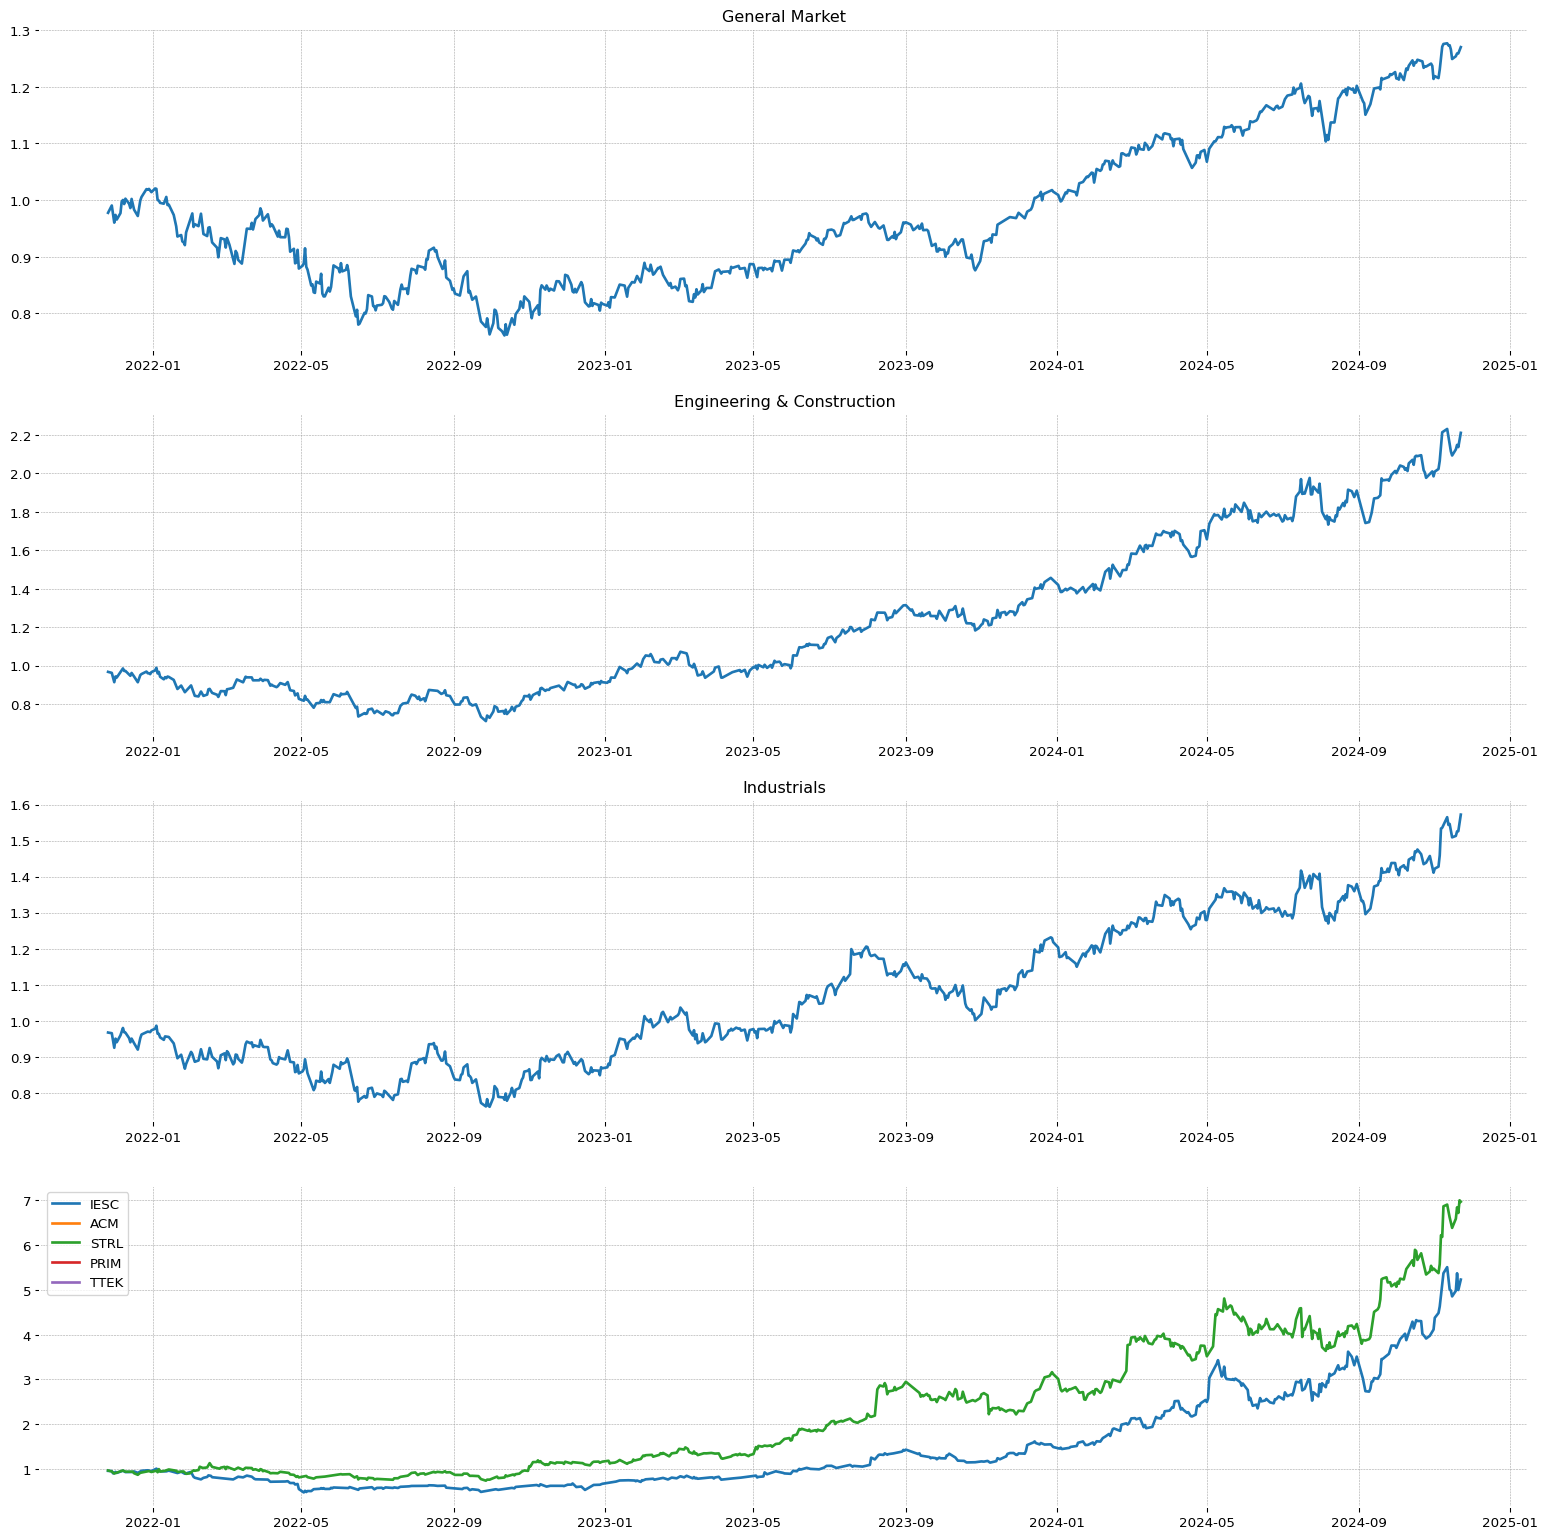
**** 8585 ****TOL
***************************
--> GENERAL INFORMATION TOL :
| Total stock number: | 100.31M |
| Market Cap: | 16.577812794B |
| Namee: | Toll Brothers, Inc. |
| IPO date: | 1986-07-08 |
| Type of Sector: | Consumer Cyclical |
| Sector Position: | 6/11 |
| RSI Sector: | 86/351 |
| Type of industry: | Residential Construction |
| Industry stock position: | 42/147 |
| Industry stock position: | 2/19 |
| RS Rating: | 91.25 |
| EPS Rating: | 89.48 |
| SMR Rating: | 72.31 |
| 1 year return: | 113.09 |
| Stability Value of Earnigs: | 30.76 |

Top competitor on same industry:
| Stock: | RS | EPS | SMR | 2Q | 1Q |
| HOV | 94 | 79 | 54 | 59 | 33 |
| TOL | 91 | 89 | 72 | 59 | -3 |
| IBP | 90 | 74 | 50 | 12 | 5 |
| GRBK | 88 | 90 | 77 | 33 | 42 |
| MHO | 88 | 80 | 64 | 31 | 23 |
| PHM | 85 | 84 | 54 | 33 | 19 |
| TMHC | 85 | 68 | 22 | 1 | -12 |
| KBH | 84 | 75 | 53 | 10 | 13 |
| NVR | 82 | 67 | 25 | 16 | 3 |
| DHI | 82 | 75 | 42 | 28 | 4 |
--->QUARTER
| 3Q | 2Q | 1Q |
| Increase Earnings of last quarters: | 32.55 | 59.72 | -3.44% |
| Quarter maggiori 20% / 50% / 100% in 20: | 1 | 0 | 0 |
| Percentage surprise: | 26.4 | -18.75 | 8.76% |
| 2Q Increase Earnings: | 2.87 | 46.14 | 28.13% |
| 5/3/1 anno di Earnigs: | 2.29 | 3.1 | 3.66 |
| Perc. increase 3/1 Earnigs Vs 5/3: | | 35.38 | 18.08% |
| Revenue increase: | 9.41 | 13.18 | 1.49% |
| 2Q Revenue increase: | -4.61 | 11.3 | 7.34% |
| NeT income Ratio: | 12.29 | 16.97 | 13.73% |
| NeT income Increase: | 14.3 | 32.88 | -11.02% |
| EARNINGS | This Q | Next Q |
| this and next q growth: | 4.57 | 2.19% |
| Revision % of extimate growth | 0.0 | 0.86% |
| This Quarter / Next Quarter | 4.34 | 2.33 |
| last 7 | 4.33 | 2.31 |
| last 30 | 4.34 | 2.31 |
| last 60 | 4.27 | 2.32 |
| last 90 | 4.03 | 2.25 |
| REVENUE | This Q | Next Q |
| Growth sales extimation: | 7.40% | 10.80% |
--->ANNUAL
| 2021 | 2022 | 2023 | ttm |
| Earnings A/A increase: | 95.91 | 63.98 | 13.15% |
| Earnings 2 A/A increase: | 40.09 | 79.95 | 38.57% |
| ROE value: | 16.23 | 22.64 | 21.38 | 20.89% |
| Net income Increase: | 86.65 | 54.32 | 6.65% |
--> Annual breakout:
2014/1.91
2015/2.06
2016/2.27
2017/3.3
2018/4.92
2019/4.07
2020/3.43
2021/6.72
2022/11.02
2023/12.47
2024/14.72
2025/14.64 |
| Current Year | Next Year |
| Sales Improve: | 7.50% | 3.40% |
| |
| EPS Growth Estimates |
|
| Current Qtr. | 5.60% |
| Next Qtr. | 3.60% |
| Current Year | 19.10% |
| Next Year | -0.50% |
| Next 5 Years (per annum) | 7.40% |
| Past 5 Years (per annum) | 41.82% |
--> Fincancial Situation yaer/year
| 2020 | 2021 | 2023 | ttm |
| Current Liabilities/Current Asset: | 24.78 | 26.34 | 25.37% |
| Non Current Liabilities/Non current Asset: | 391.73 | 292.01 | 222.94% |
| Total Liabilities/Current Asset: | 58.31 | 56.21 | 50.81% |
| Y/Y short debt situation: | 20.84 | 11.5 | -2.86% |
| Y/Y long debt situation: | -9.98 | -6.55 | -14.08% |
--> 2Q average 3I
| 3Q | 2Q | 1Q |
| 2Q Increase Earnings: | 2.87 | 46.14 | 28.13% |
| 2Q Revenue increase: | -4.61 | 11.3 | 7.34% |
| 2Q NeT income Ratio: | 13.52 | 14.63 | 15.35% |
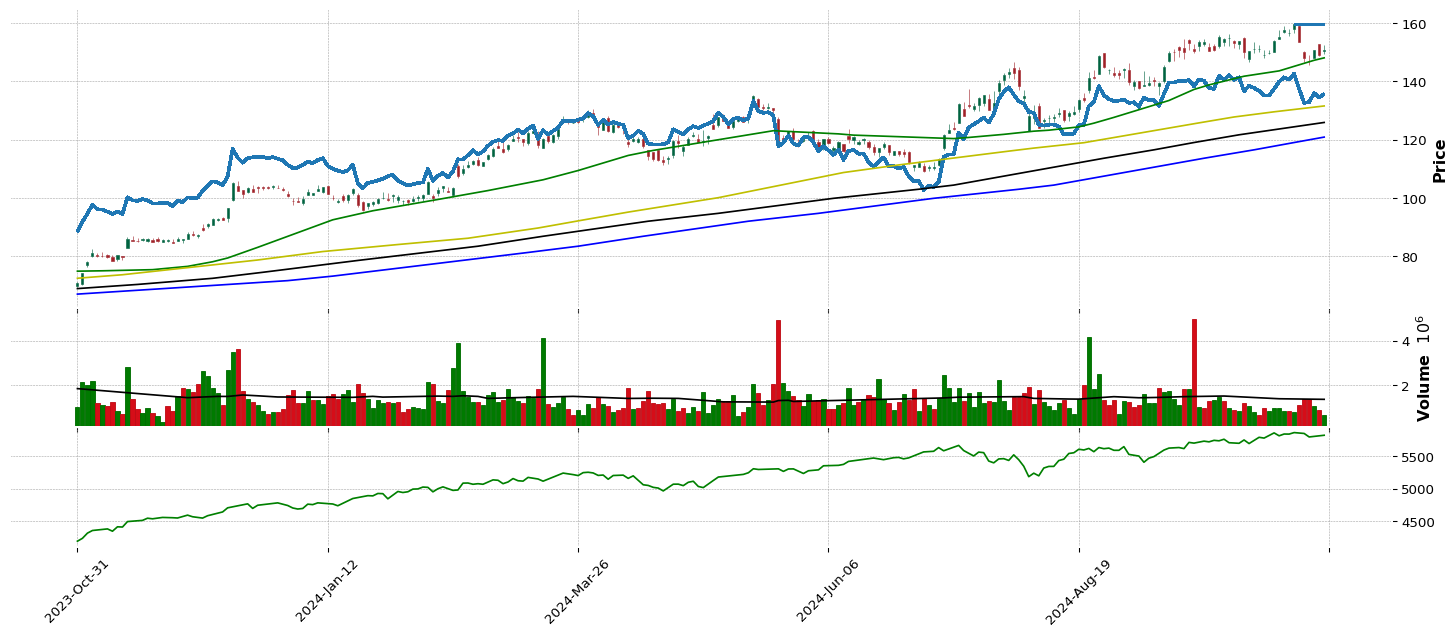
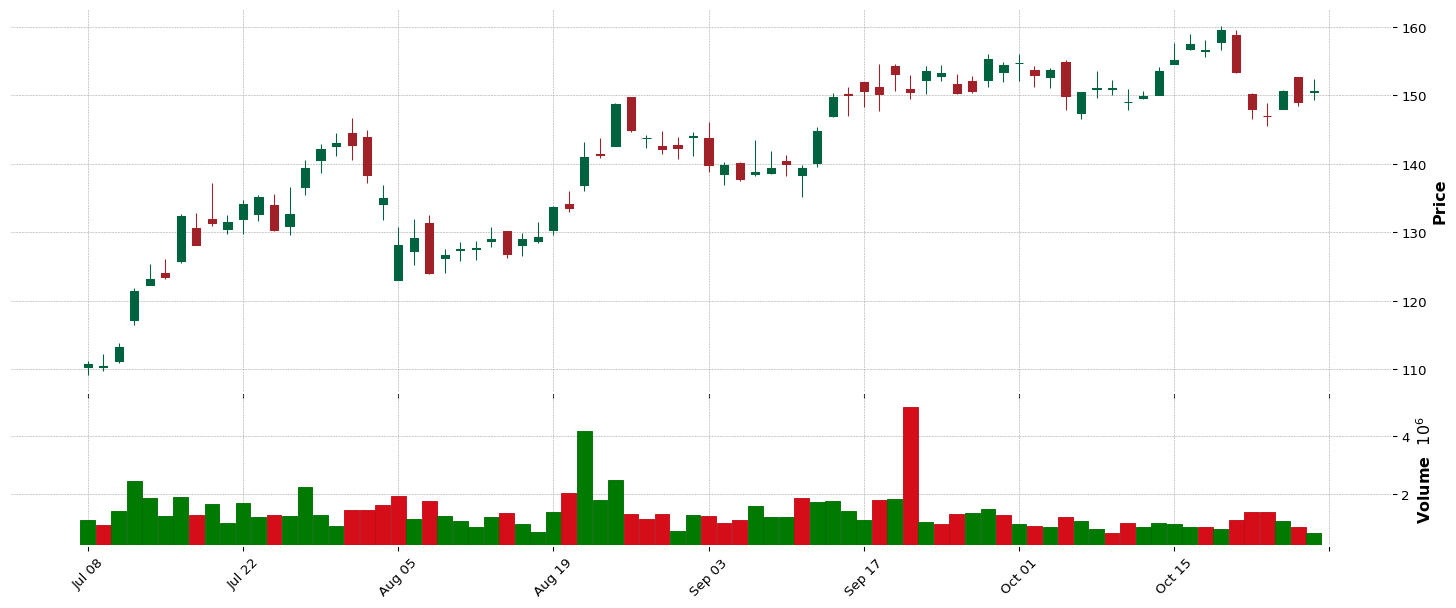
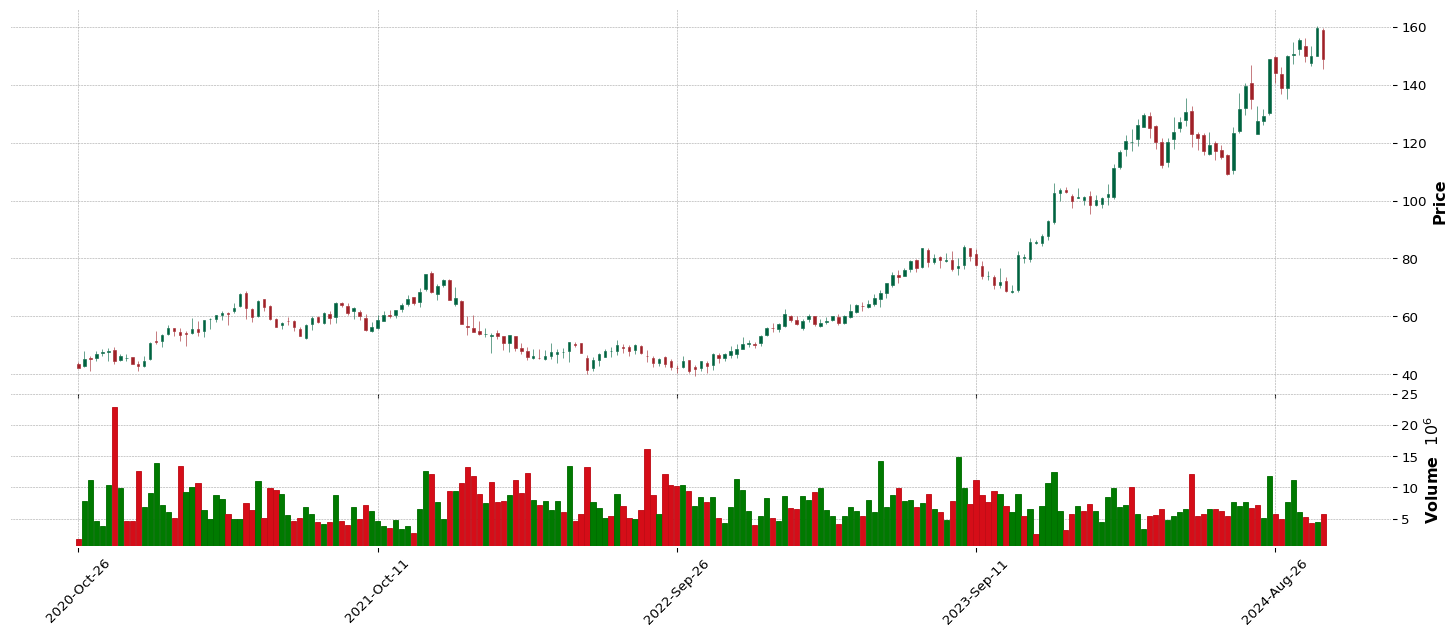
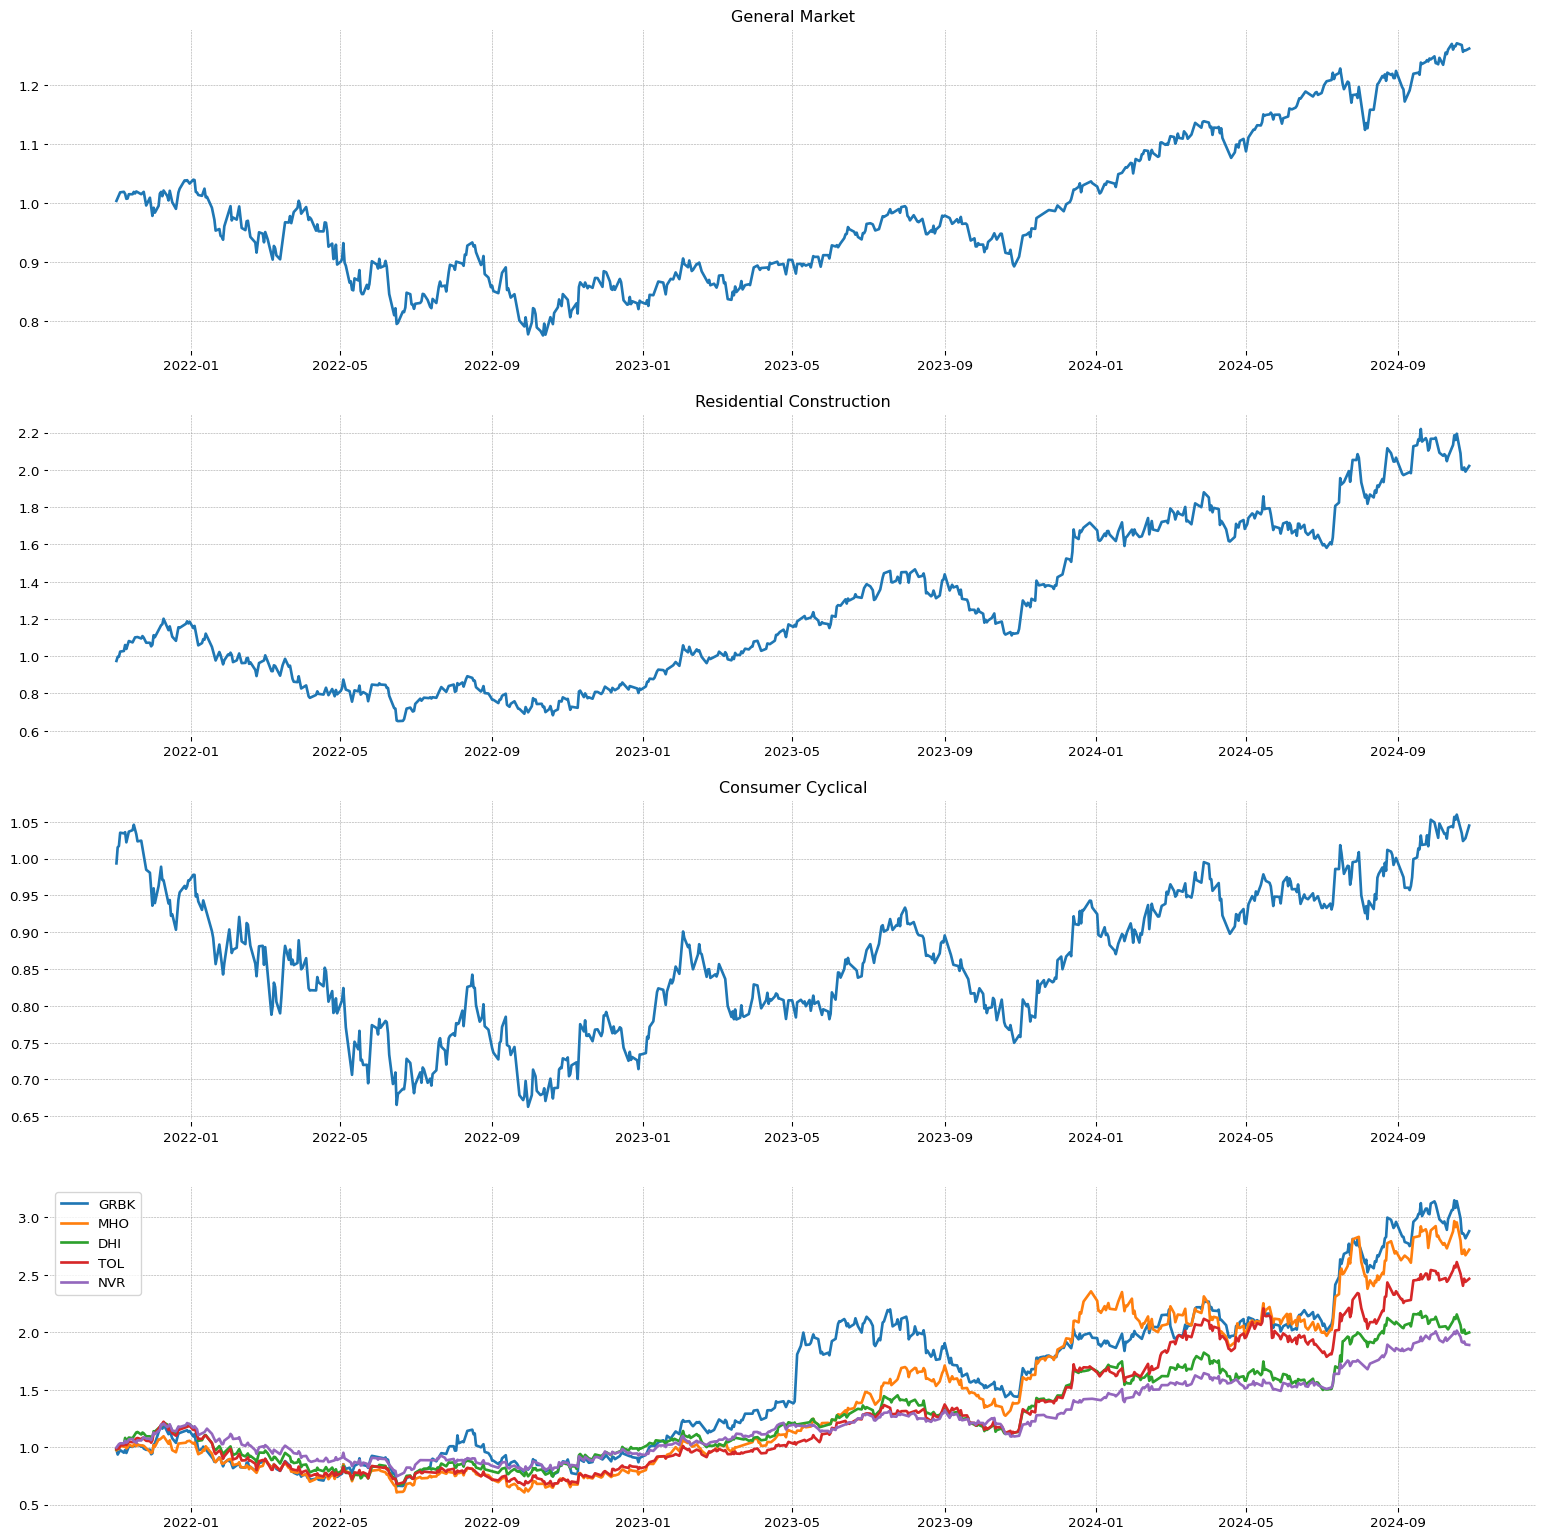
**** 8585 ****TGS
***************************
--> GENERAL INFORMATION TGS :
| Total stock number: | 156.84M |
| Market Cap: | 3.336236972B |
| Namee: | Transportadora de Gas del Sur S.A. |
| IPO date: | 1994-11-17 |
| Type of Sector: | Energy |
| Sector Position: | 11/11 |
| RSI Sector: | 25/182 |
| Type of industry: | Oil & Gas Integrated |
| Industry stock position: | 132/147 |
| Industry stock position: | 2/17 |
| RS Rating: | 91.9 |
| EPS Rating: | 100.0 |
| SMR Rating: | 84.08 |
| 1 year return: | 117.04 |
| Stability Value of Earnigs: | 99.0 |

Top competitor on same industry:
| Stock: | RS | EPS | SMR | 2Q | 1Q |
| YPF | 94 | 30 | 31 | -98 | -99 |
| TGS | 91 | 100 | 84 | 914 | 1042 |
| IMO | 54 | 95 | 44 | 4 | 81 |
| NFG | 41 | 63 | 16 | 18 | -158 |
| SU | 39 | 68 | 19 | -18 | -15 |
| XOM | 32 | 71 | 8 | -26 | 10 |
| CVX | 23 | 64 | 5 | -14 | -24 |
| CRGY | 21 | 62 | 37 | -108 | 209 |
| SHEL | 21 | 78 | 8 | -9 | 20 |
| TTE | 18 | 79 | 20 | 7 | -4 |
--->QUARTER
| 3Q | 2Q | 1Q |
| Increase Earnings of last quarters: | -789.66 | 914.14 | 1042.61% |
| Quarter maggiori 20% / 50% / 100% in 20: | 3 | 2 | 2 |
| Percentage surprise: | -1849.71 | 45.16 | 18.51% |
| 2Q Increase Earnings: | -378.64 | 62.24 | 978.37% |
| 5/3/1 anno di Earnigs: | 79.37 | 120.22 | 263.58 |
| Perc. increase 3/1 Earnigs Vs 5/3: | | 51.46 | 119.23% |
| Revenue increase: | 233.84 | 322.63 | 654.39% |
| 2Q Revenue increase: | 188.82 | 278.24 | 488.51% |
| NeT income Ratio: | -22.89 | 28.74 | 32.94% |
| NeT income Increase: | -238.88 | 133.7 | 51.46% |
| EARNINGS | This Q | Next Q |
| this and next q growth: | -100.0 | 100.22% |
| Revision % of extimate growth | -100.0 | 0.0% |
| This Quarter / Next Quarter | 0.0 | 0.64 |
| last 7 | 0.45 | 0.64 |
| last 30 | 0.45 | 0.64 |
| last 60 | 0.45 | 0.64 |
| last 90 | 0.45 | 0.54 |
| REVENUE | This Q | Next Q |
| Growth sales extimation: | -- | -- |
--->ANNUAL
| 2021 | 2022 | 2023 | ttm |
| Earnings A/A increase: | 545.15 | 54.39 | 99.8% |
| Earnings 2 A/A increase: | 233.1 | 299.77 | 77.1% |
| ROE value: | 22.43 | 16.66 | 11.5 | 7.79% |
| Net income Increase: | 536.94 | 54.4 | 99.8% |
--> Annual breakout:
2014/0.63
2015/-1.04
2016/5.63
2017/16.95
2018/72.4
2019/102.31
2020/21.55
2021/139.03
2022/214.66
2023/428.9
2024/1.87
2025/1.73 |
| Current Year | Next Year |
| Sales Improve: | -22.90% | 9.90% |
| |
| EPS Growth Estimates |
|
| Current Qtr. | -- |
| Next Qtr. | 82.90% |
| Current Year | 252.80% |
| Next Year | -7.50% |
| Next 5 Years (per annum) | -- |
| Past 5 Years (per annum) | -15.06% |
--> Fincancial Situation yaer/year
| 2020 | 2021 | 2023 | ttm |
| Current Liabilities/Current Asset: | 57.08 | 27.43 | 29.74% |
| Non Current Liabilities/Non current Asset: | 38.98 | 36.93 | 50.15% |
| Total Liabilities/Current Asset: | 246.77 | 187.52 | 161.54% |
| Y/Y short debt situation: | 149.82 | 4.6 | 496.77% |
| Y/Y long debt situation: | 23.63 | 83.69 | 353.08% |
--> 2Q average 3I
| 3Q | 2Q | 1Q |
| 2Q Increase Earnings: | -378.64 | 62.24 | 978.37% |
| 2Q Revenue increase: | 188.82 | 278.24 | 488.51% |
| 2Q NeT income Ratio: | -8.07 | 2.92 | 30.84% |
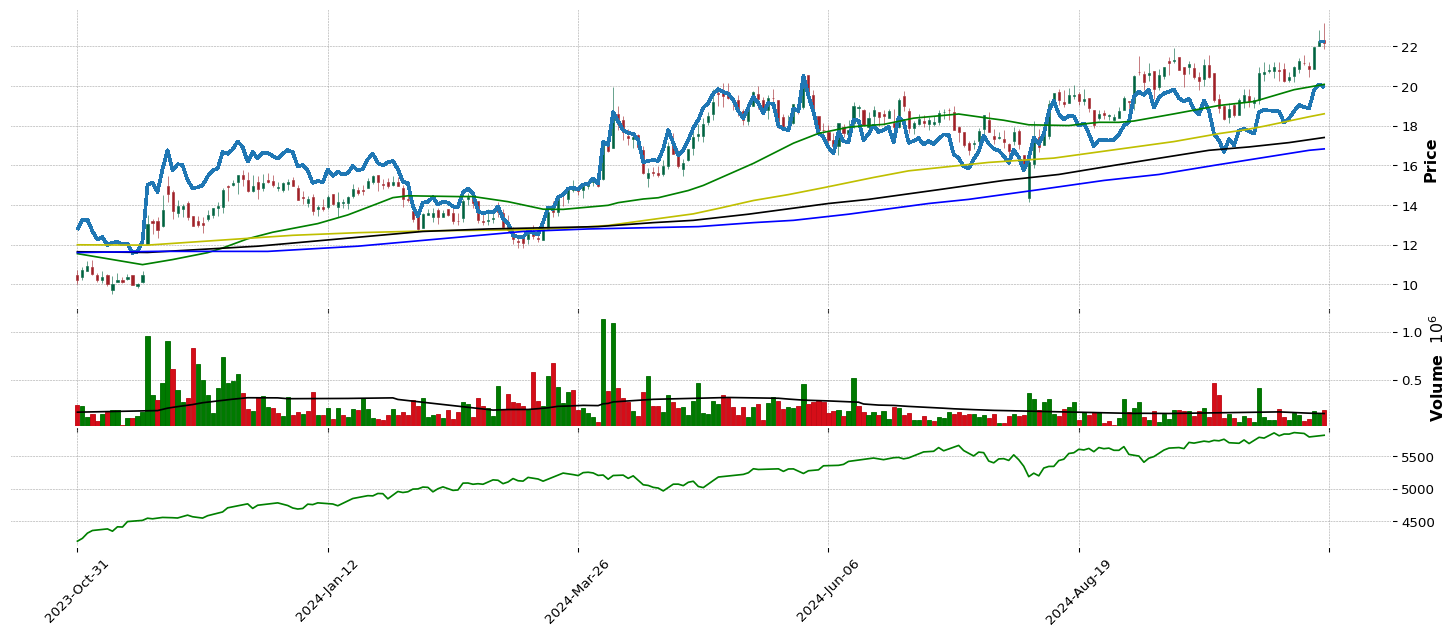
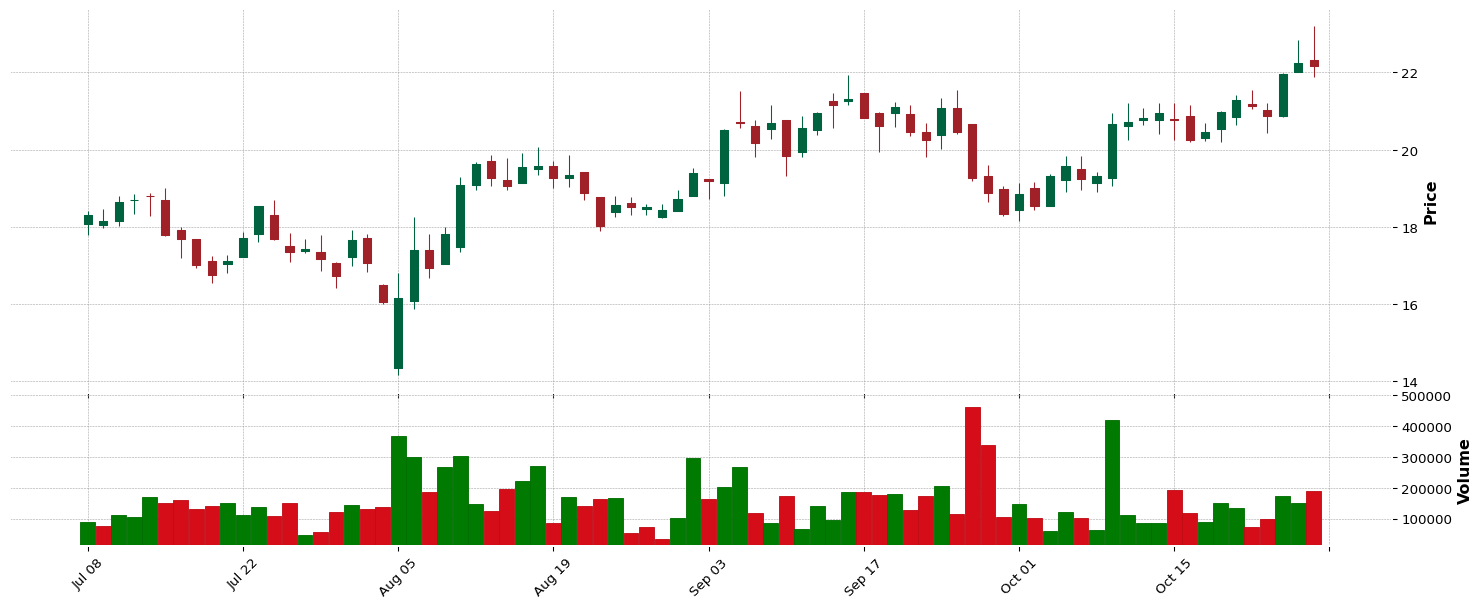
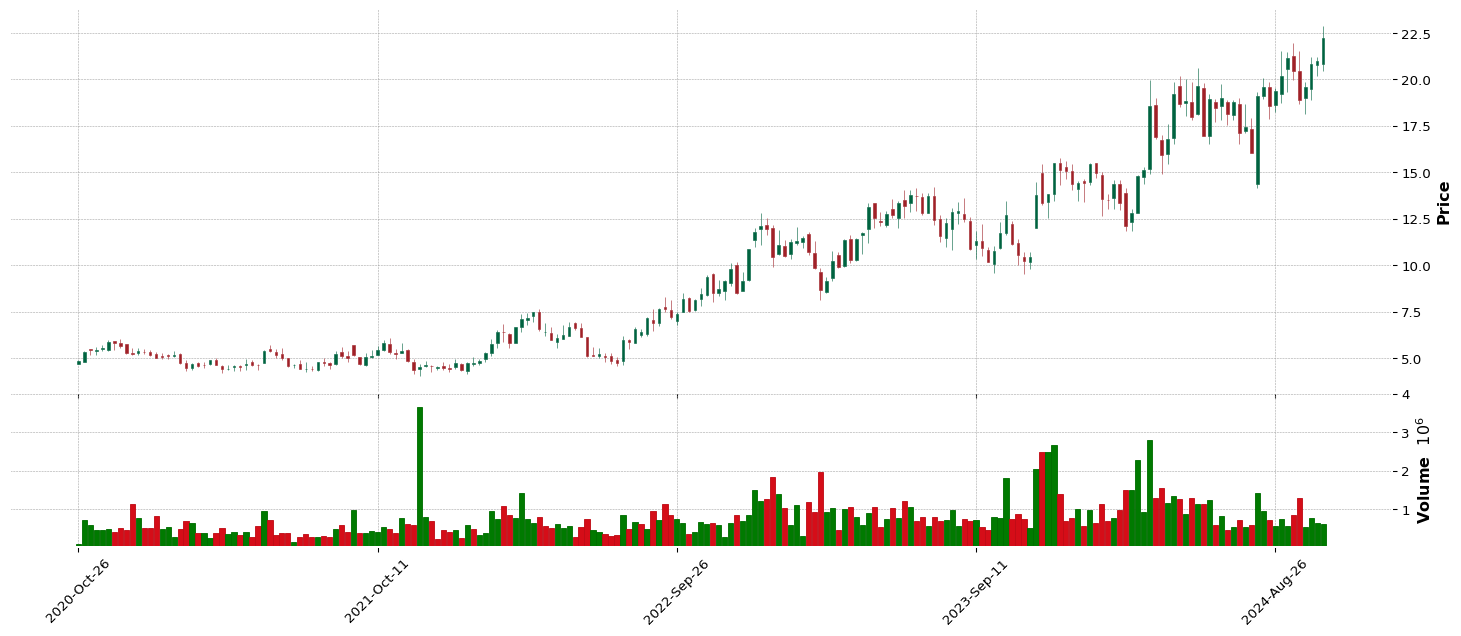
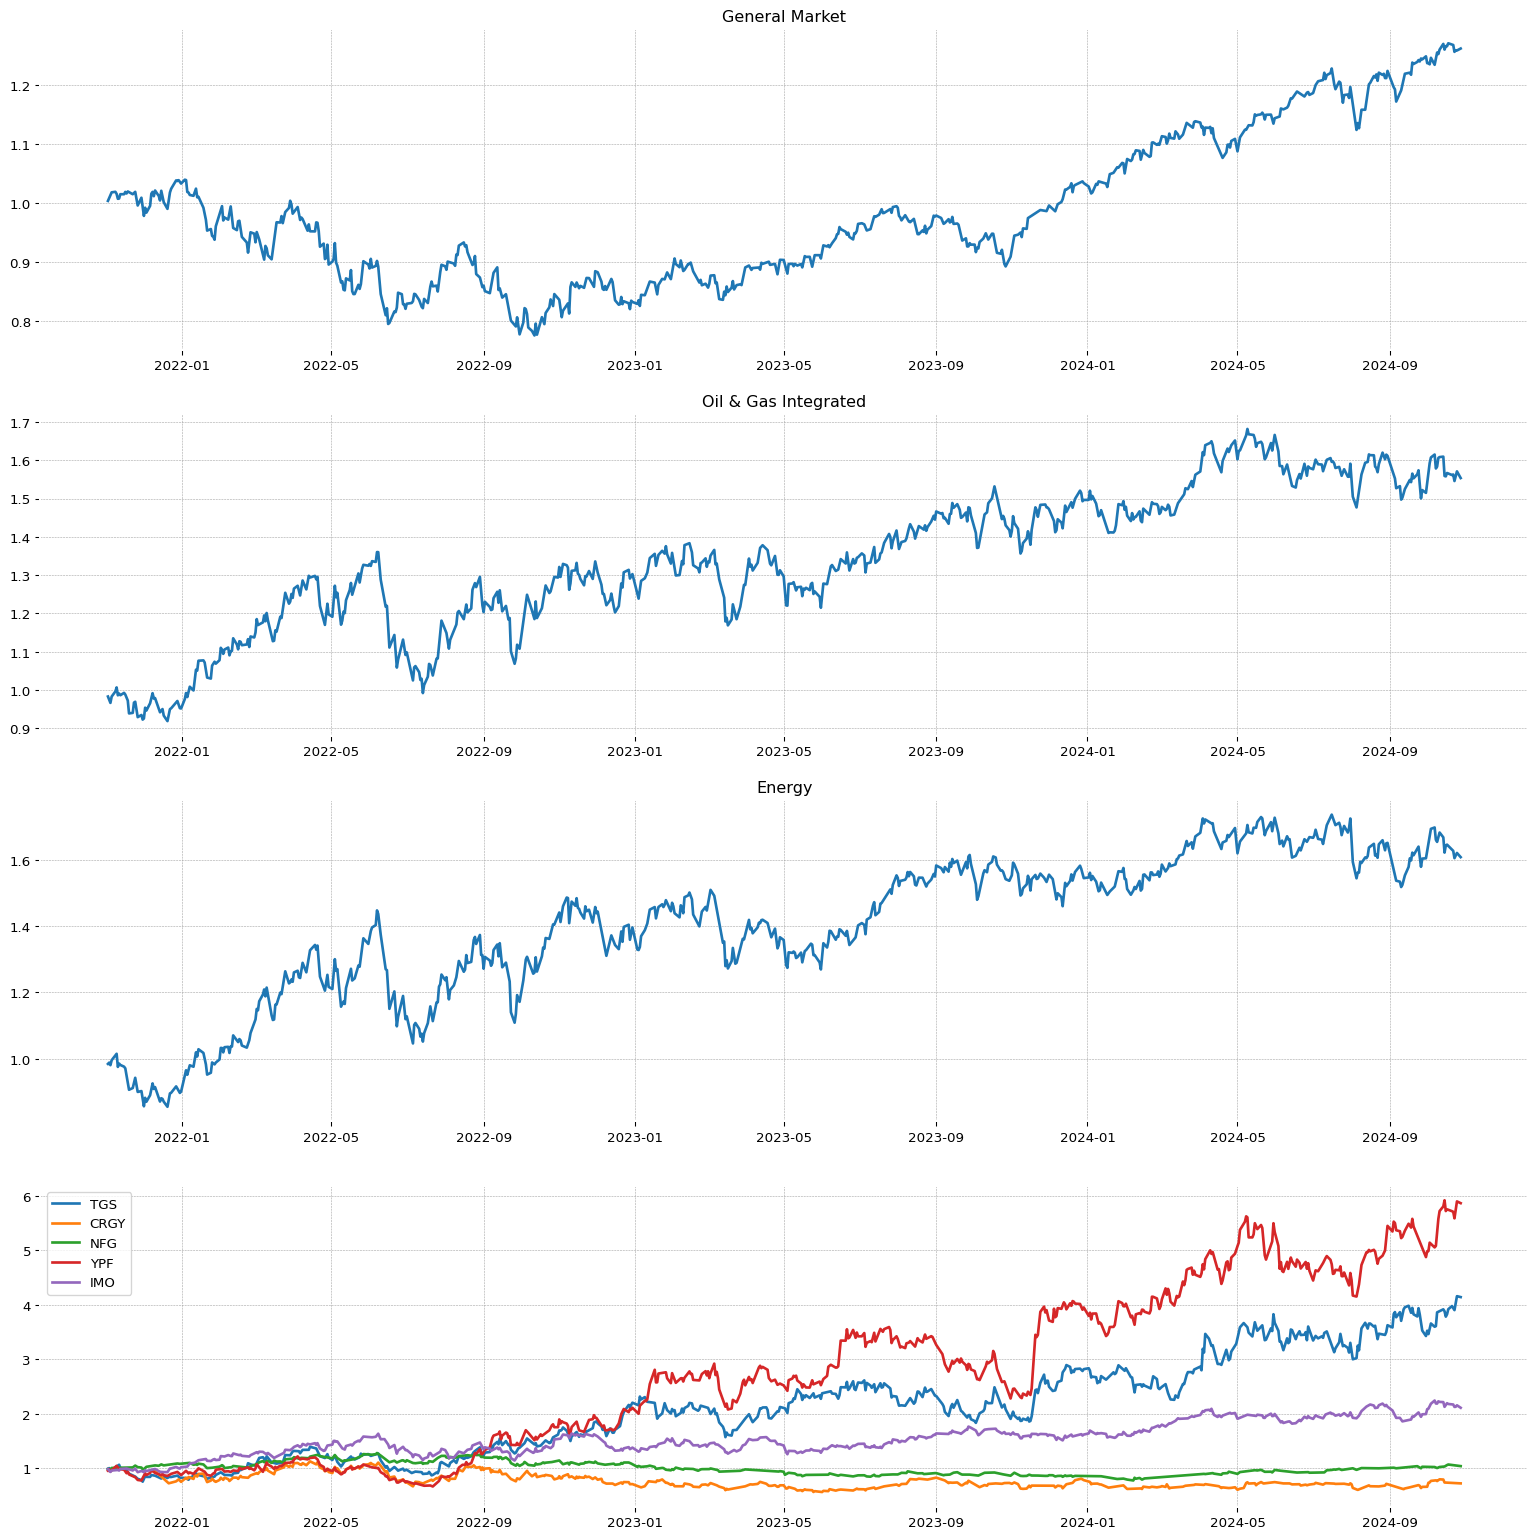
**** 8585 ****TT
***************************
--> GENERAL INFORMATION TT :
| Total stock number: | 224.95M |
| Market Cap: | 89.784938232B |
| Namee: | Trane Technologies plc |
| IPO date: | 1980-03-17 |
| Type of Sector: | Industrials |
| Sector Position: | 7/11 |
| RSI Sector: | 101/402 |
| Type of industry: | Building Products & Equipment |
| Industry stock position: | 58/147 |
| Industry stock position: | 5/27 |
| RS Rating: | 90.27 |
| EPS Rating: | 89.57 |
| SMR Rating: | 86.23 |
| 1 year return: | 106.37 |
| Stability Value of Earnigs: | 26.94 |

Top competitor on same industry:
| Stock: | RS | EPS | SMR | 2Q | 1Q |
| SWIM | 96 | 85 | 52 | 47 | 135 |
| LMB | 95 | 81 | 88 | 134 | 6 |
| ASPN | 94 | 0 | 0 | 0 | 0 |
| AAON | 92 | 75 | 82 | 4 | 14 |
| TT | 90 | 89 | 86 | 43 | 29 |
| SPXC | 89 | 51 | 89 | 24 | 16 |
| LPX | 89 | 79 | 83 | 417 | 892 |
| APOG | 84 | 55 | 52 | 31 | -9 |
| AWI | 84 | 90 | 72 | 31 | 11 |
| BLDR | 81 | 65 | 16 | -13 | -9 |
--->QUARTER
| 3Q | 2Q | 1Q |
| Increase Earnings of last quarters: | 16.23 | 43.28 | 29.57% |
| Quarter maggiori 20% / 50% / 100% in 20: | 3 | 0 | 0 |
| Percentage surprise: | 1.87 | 17.57 | 7.14% |
| 2Q Increase Earnings: | 16.16 | 29.75 | 36.42% |
| 5/3/1 anno di Earnigs: | 1.71 | 2.06 | 2.55 |
| Perc. increase 3/1 Earnigs Vs 5/3: | | 19.95 | 23.85% |
| Revenue increase: | 8.59 | 14.99 | 12.81% |
| 2Q Revenue increase: | 10.14 | 11.79 | 13.9% |
| NeT income Ratio: | 11.39 | 10.34 | 14.23% |
| NeT income Increase: | 5.75 | 23.54 | 14.21% |
| EARNINGS | This Q | Next Q |
| this and next q growth: | 18.24 | 9.45% |
| Revision % of extimate growth | 0.62 | 0.82% |
| This Quarter / Next Quarter | 3.24 | 2.43 |
| last 7 | 3.24 | 2.43 |
| last 30 | 3.22 | 2.41 |
| last 60 | 3.21 | 2.4 |
| last 90 | 3.14 | 2.37 |
| REVENUE | This Q | Next Q |
| Growth sales extimation: | 10.70% | 7.20% |
--->ANNUAL
| 2021 | 2022 | 2023 | ttm |
| Earnings A/A increase: | 67.41 | 26.67 | 17.21% |
| Earnings 2 A/A increase: | 14.18 | 47.04 | 21.94% |
| ROE value: | 22.35 | 28.3 | 30.8 | 33.46% |
| Net income Increase: | 66.49 | 23.4 | 15.22% |
--> Annual breakout:
2014/3.54
2015/2.54
2016/5.7
2017/5.22
2018/5.53
2019/5.84
2020/3.56
2021/5.96
2022/7.55
2023/8.85
2024/10.9
2025/12.44 |
| Current Year | Next Year |
| Sales Improve: | 10.70% | 7.50% |
| |
| EPS Growth Estimates |
|
| Current Qtr. | 16.10% |
| Next Qtr. | 12.00% |
| Current Year | 20.60% |
| Next Year | 14.10% |
| Next 5 Years (per annum) | 13.87% |
| Past 5 Years (per annum) | 16.19% |
--> Fincancial Situation yaer/year
| 2020 | 2021 | 2023 | ttm |
| Current Liabilities/Current Asset: | 69.27 | 89.14 | 88.11% |
| Non Current Liabilities/Non current Asset: | 63.02 | 53.74 | 50.48% |
| Total Liabilities/Current Asset: | 182.14 | 187.74 | 180.13% |
| Y/Y short debt situation: | 3.3 | 26.86 | 6.44% |
| Y/Y long debt situation: | -1.16 | -13.89 | 0.5% |
--> 2Q average 3I
| 3Q | 2Q | 1Q |
| 2Q Increase Earnings: | 16.16 | 29.75 | 36.42% |
| 2Q Revenue increase: | 10.14 | 11.79 | 13.9% |
| 2Q NeT income Ratio: | 12.11 | 10.87 | 12.29% |
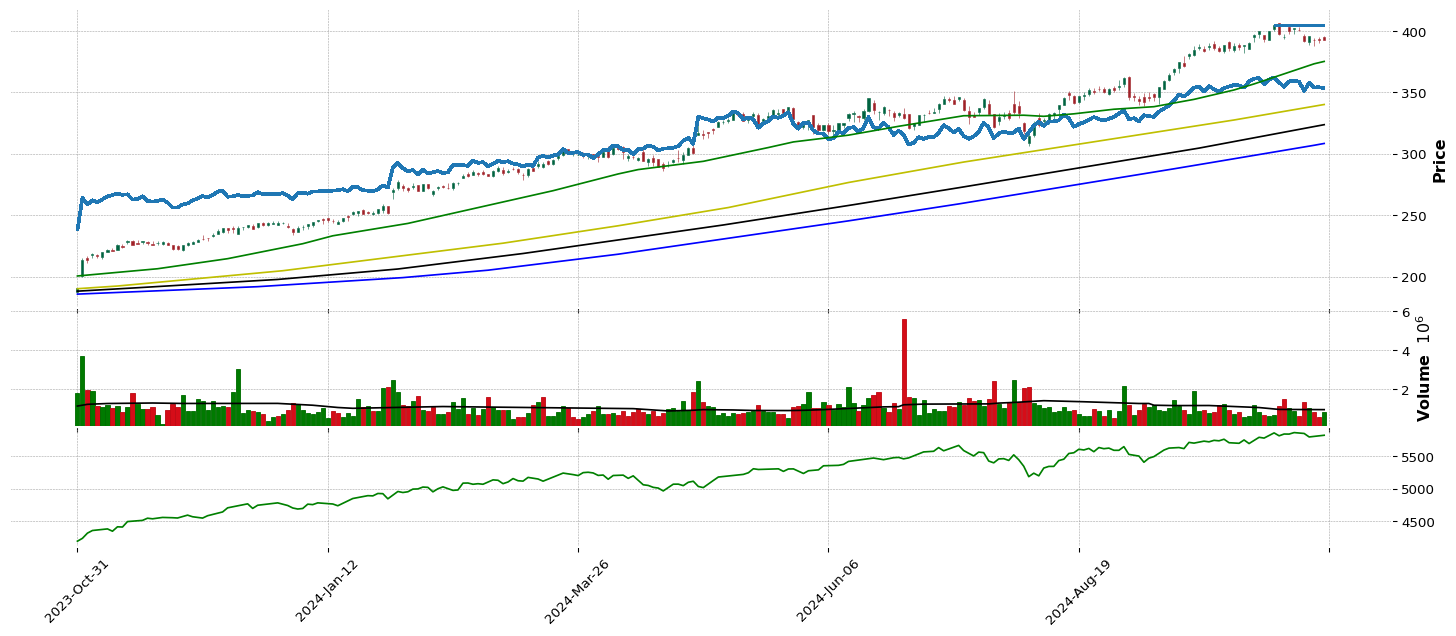
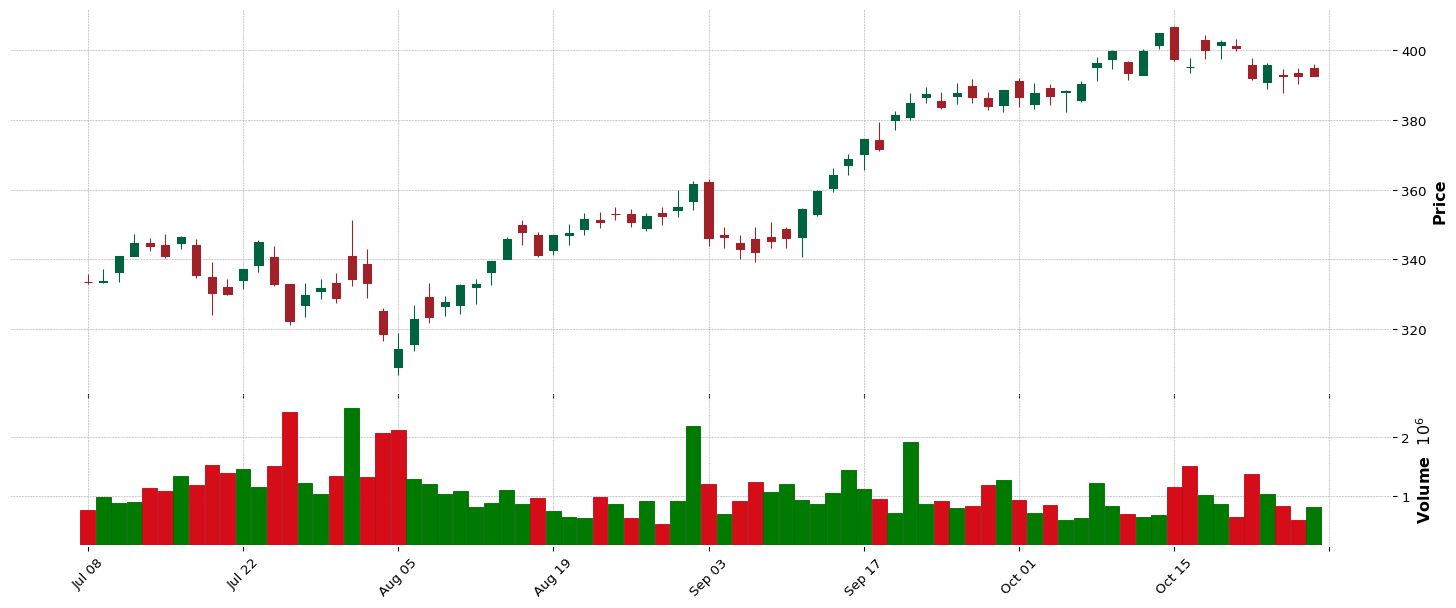
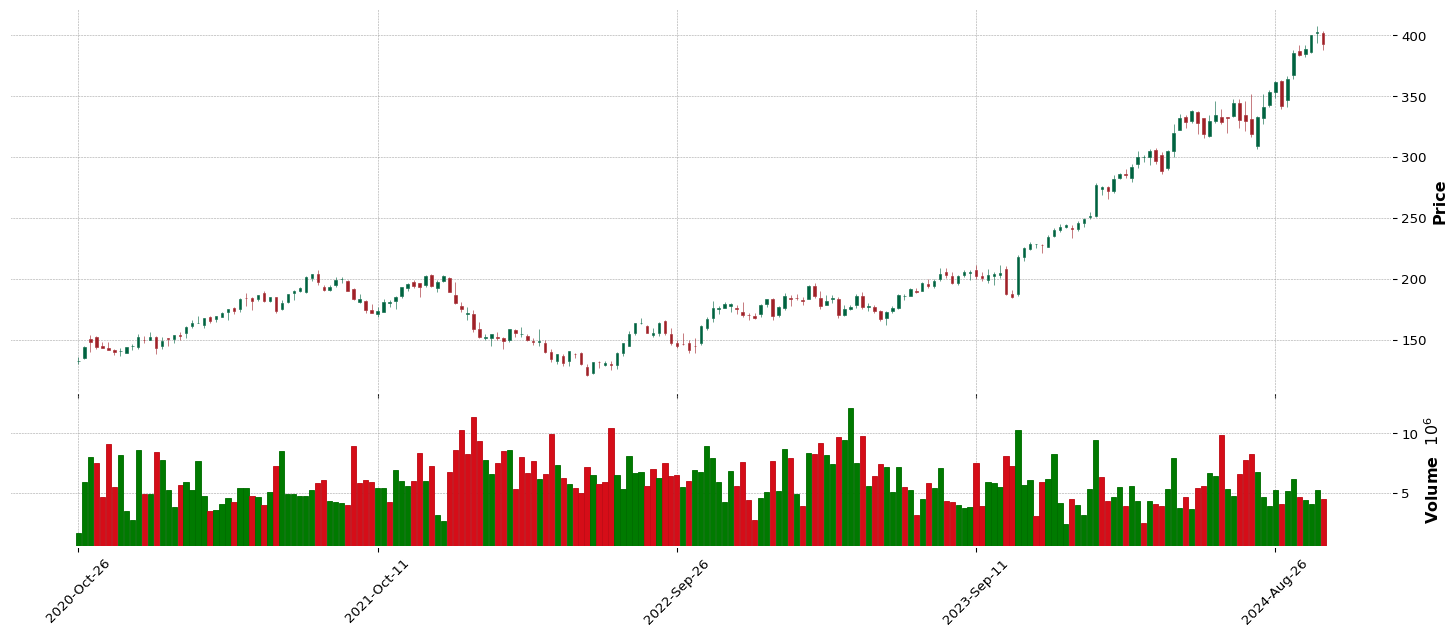
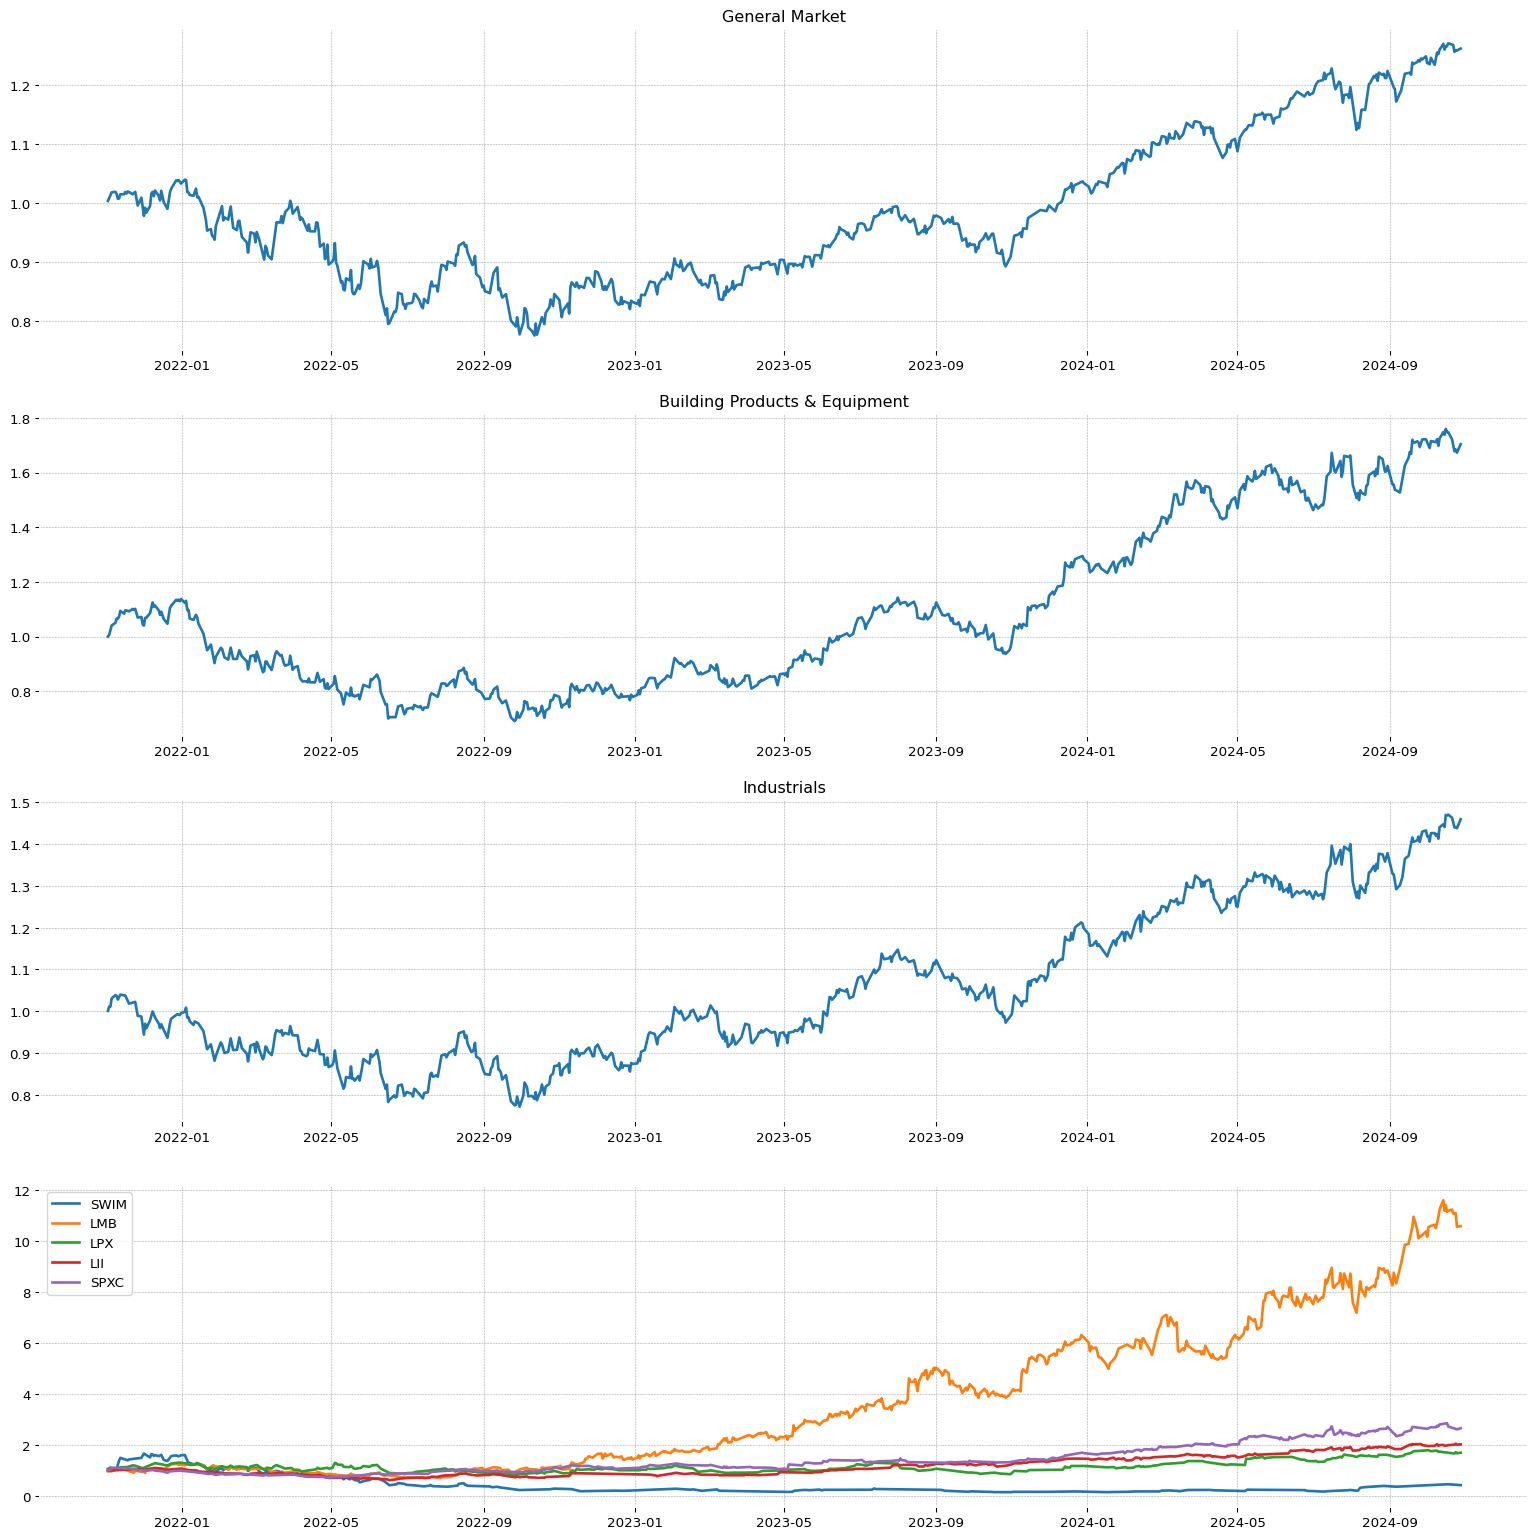
CAVA
**** TECNICO ****
CAVA
| Total stock number: | 88.75M |
| Namee: | CAVA Group, Inc. |
| IPO date: | 2023-06-16 |
| Sector | Sector Position |
| Consumer Cyclical | 6/11 |
| Industry | Industry Position - | Stock on industry - | RSI Sector: |
| Restaurants | 82/147 | 1/32 | 9/351 |
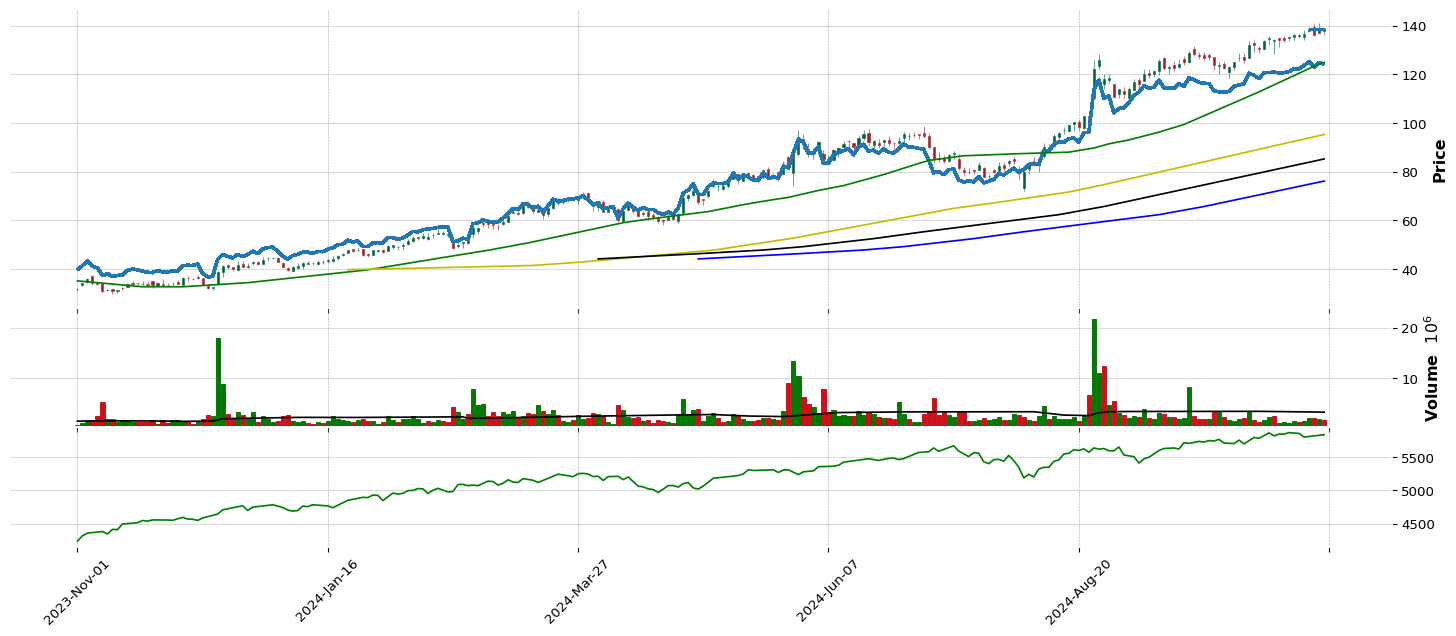
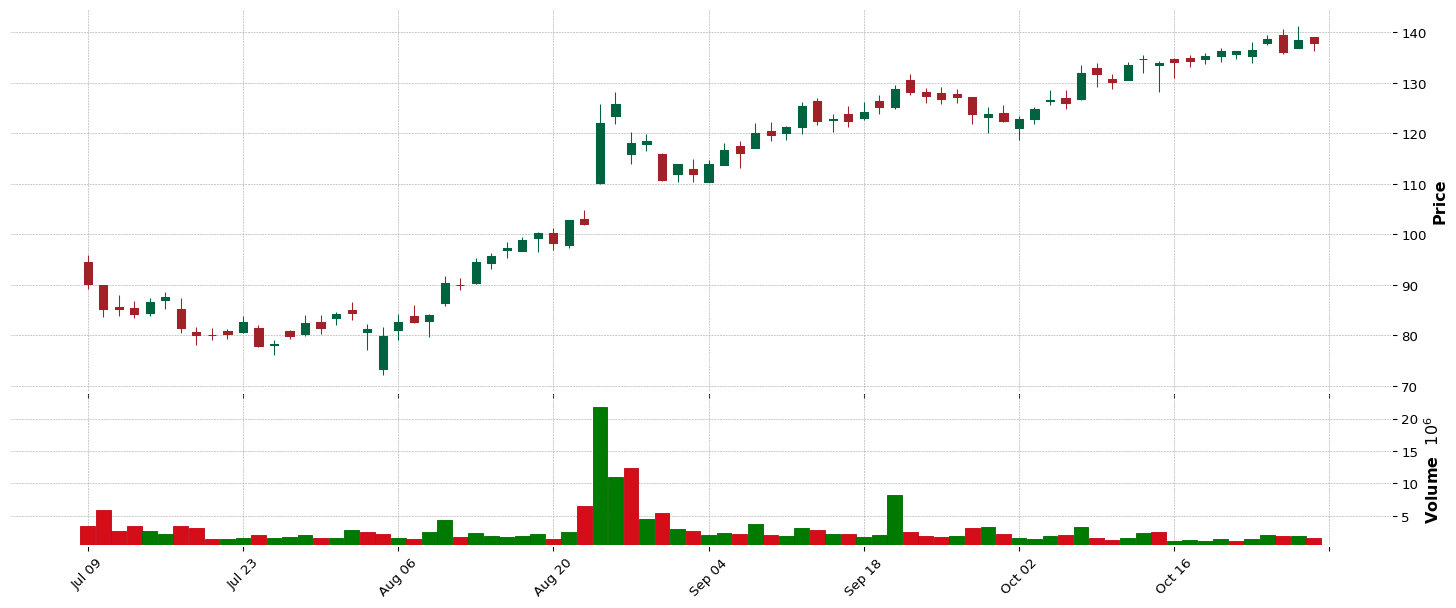
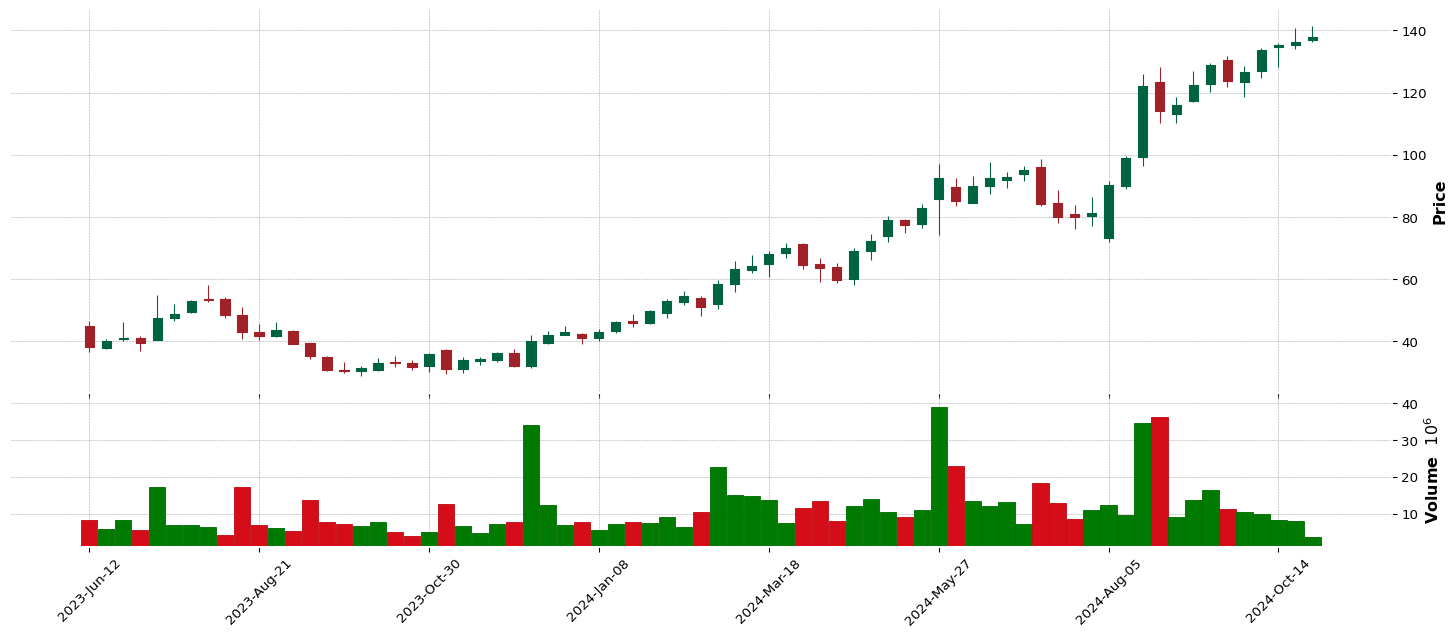
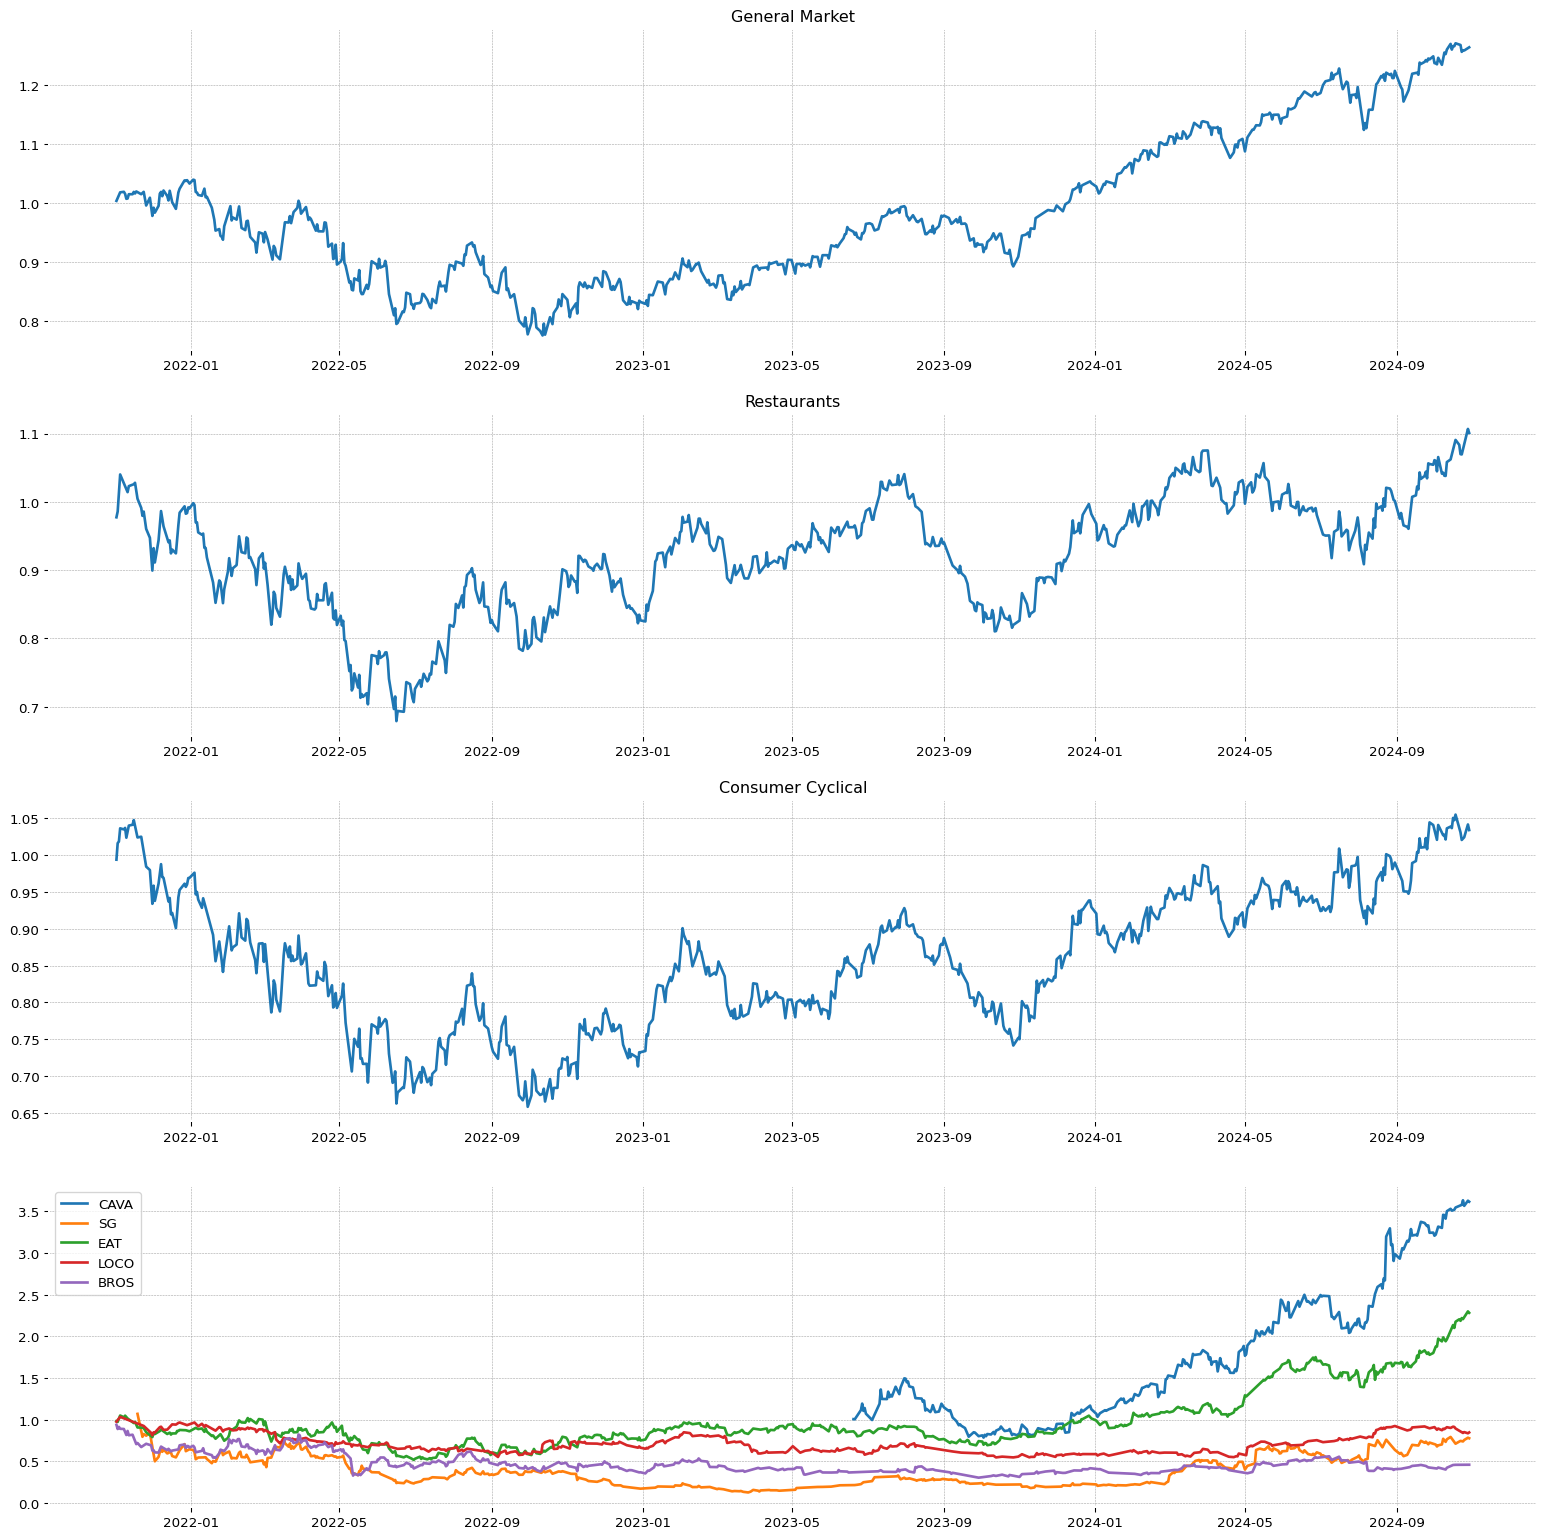 LENZ
LENZ
**** TECNICO ****
LENZ
| Total stock number: | 12.51M |
| Namee: | LENZ Therapeutics, Inc. |
| IPO date: | 2024-03-22 |
| Sector | Sector Position |
| Healthcare | 1/11 |
| Industry | Industry Position - | Stock on industry - | RSI Sector: |
| Biotechnology | 19/147 | 8/232 | 42/487 |
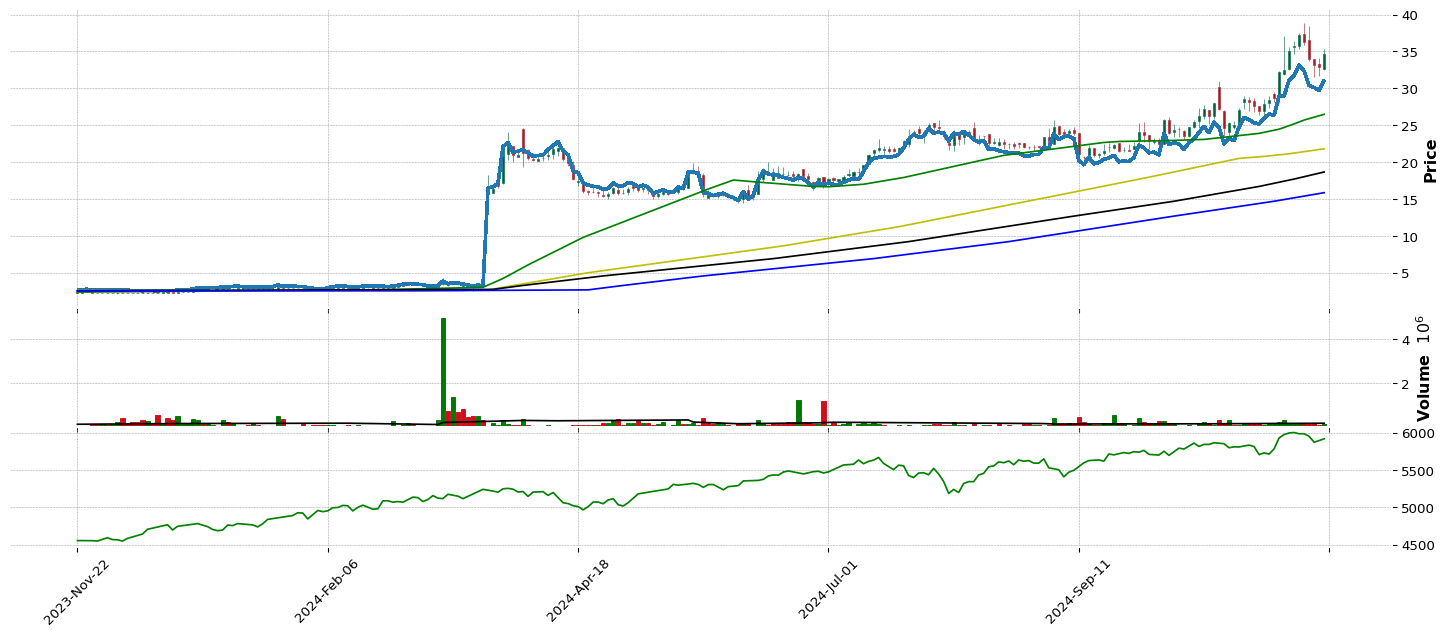
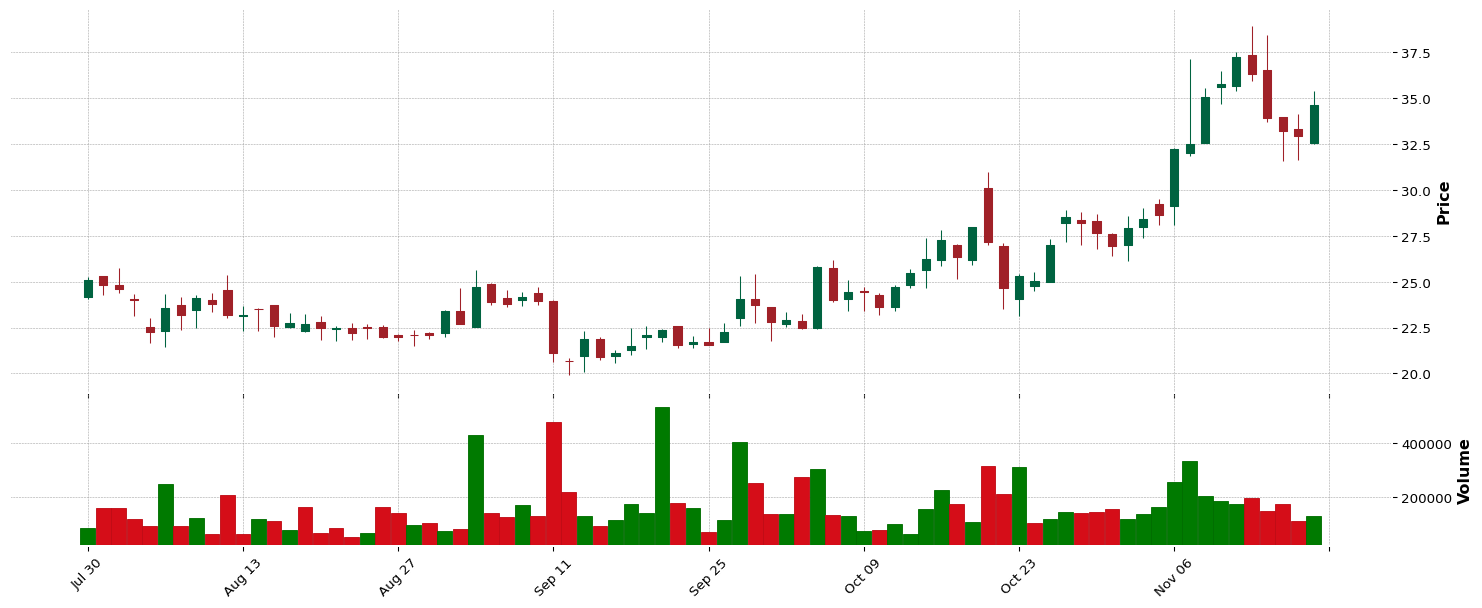
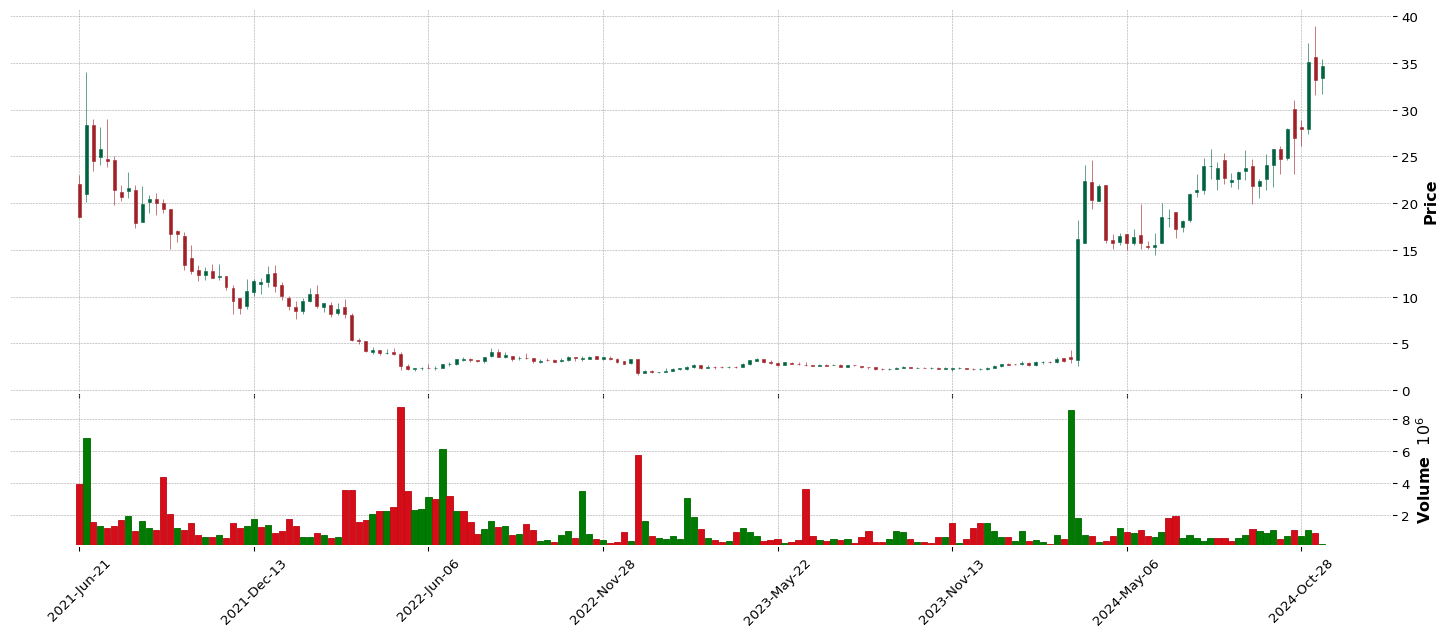
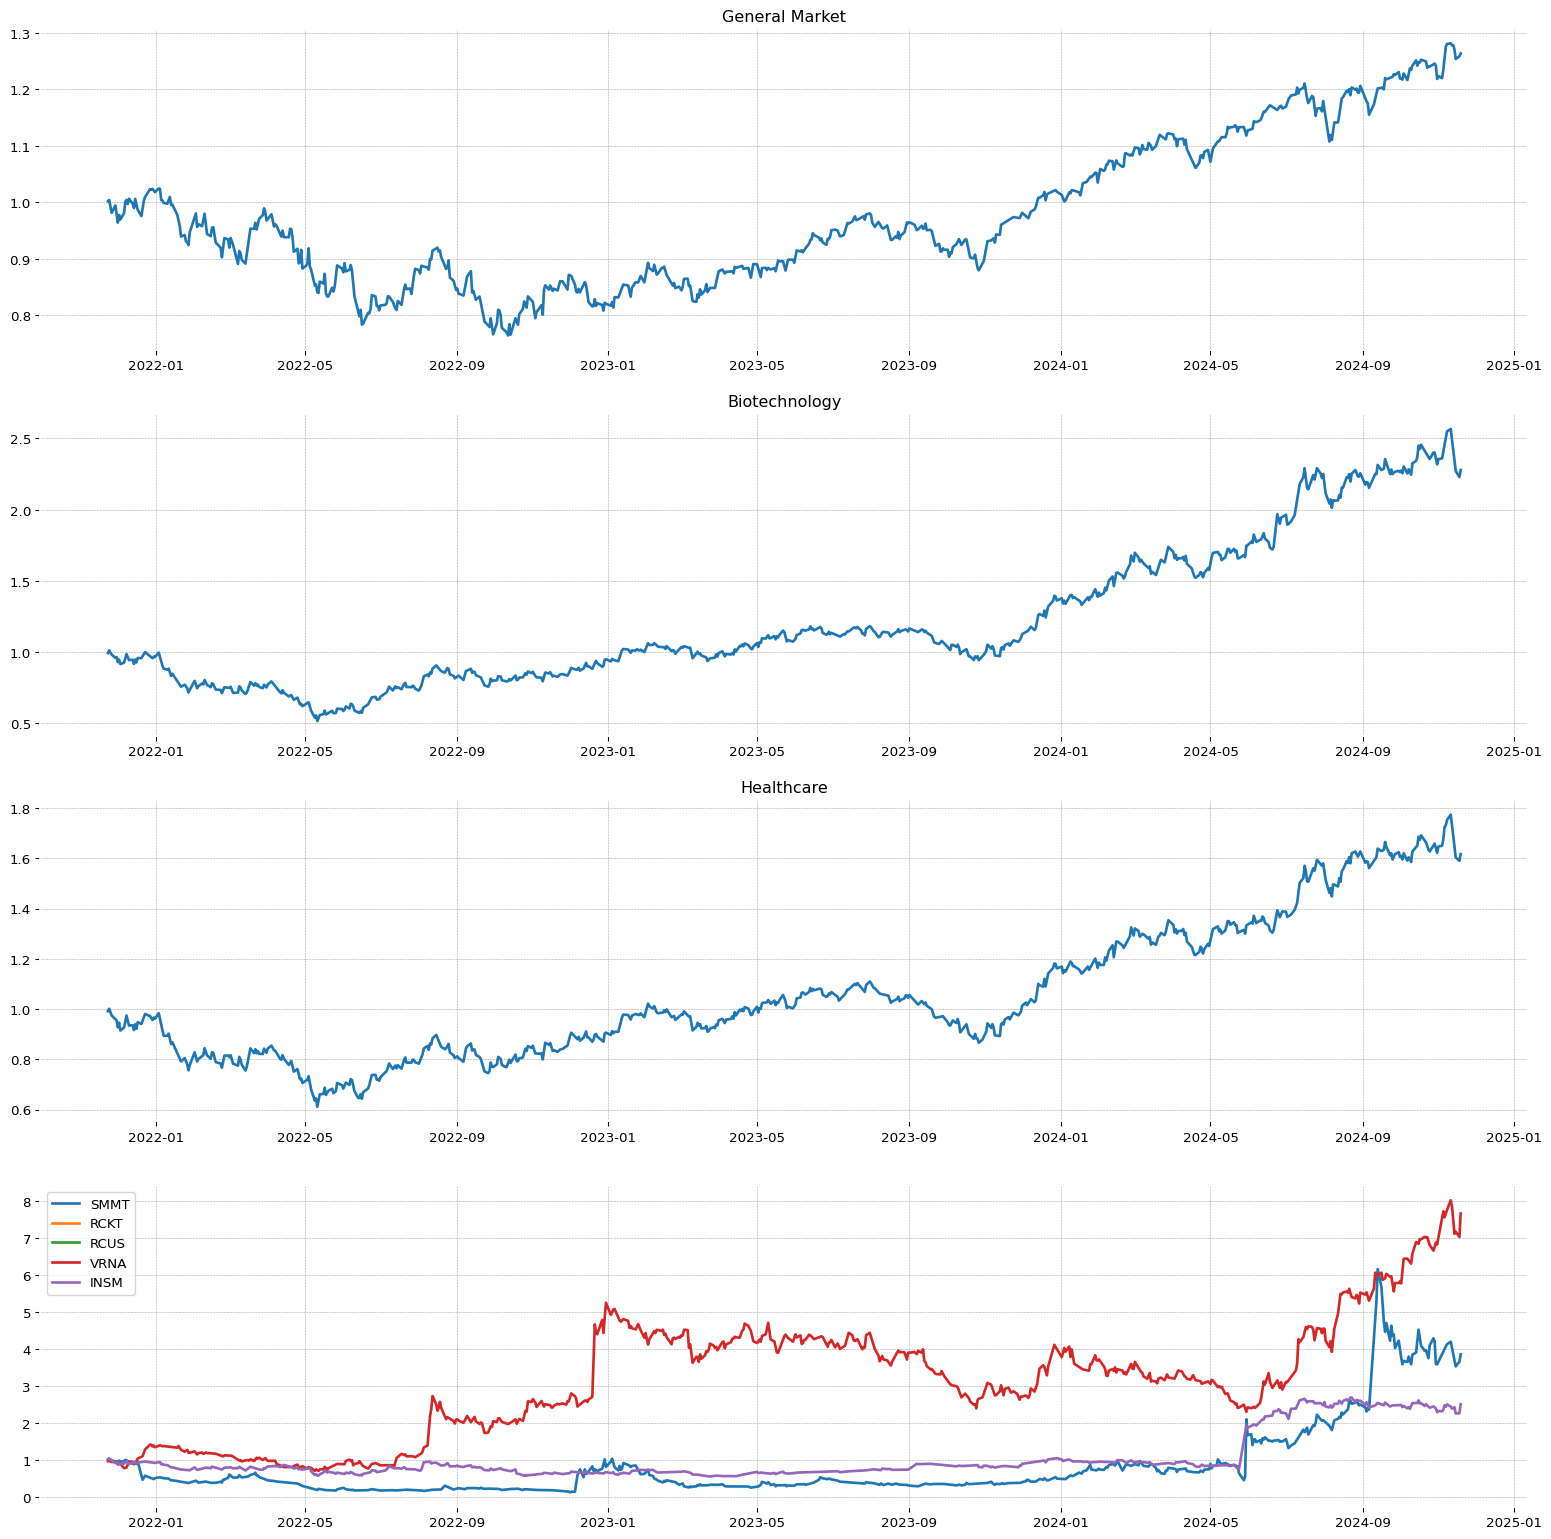 FTAI
FTAI
**** TECNICO ****
FTAI
| Total stock number: | 100.81M |
| Namee: | FTAI Aviation Ltd. |
| IPO date: | 2015-05-14 |
| Sector | Sector Position |
| Industrials | 7/11 |
| Industry | Industry Position - | Stock on industry - | RSI Sector: |
| Rental & Leasing Services | 74/147 | 1/17 | 10/402 |
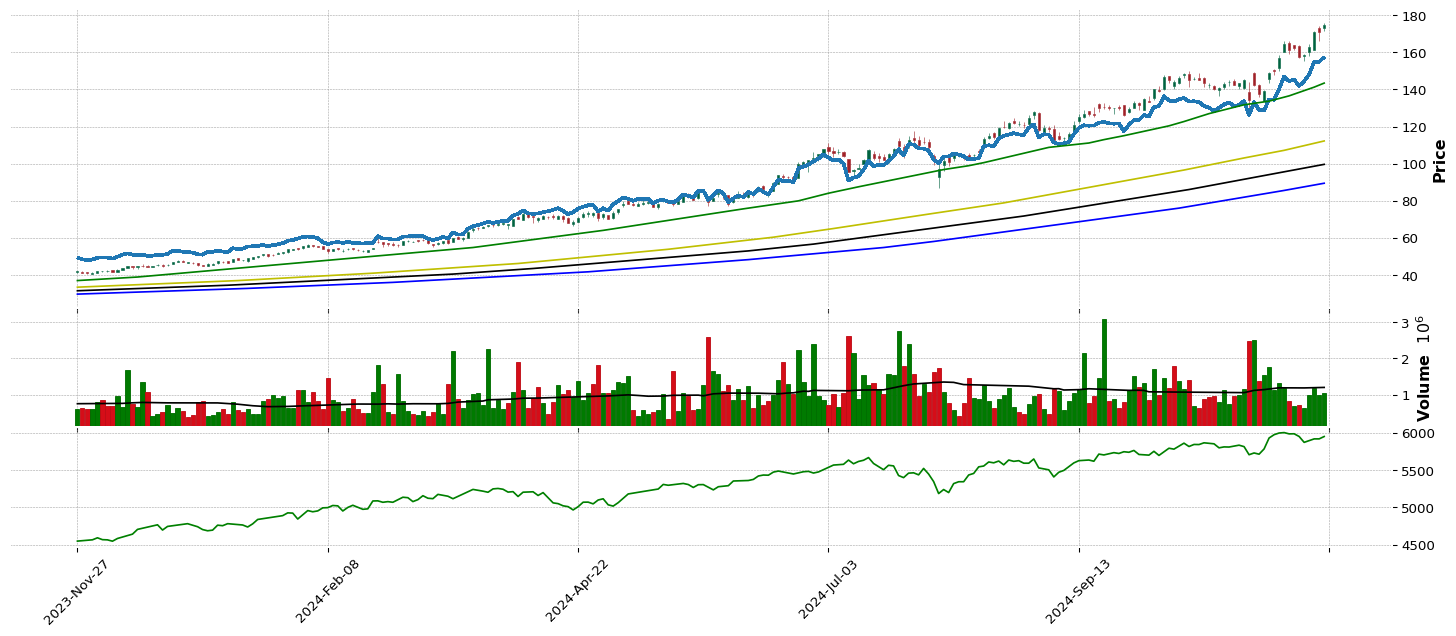
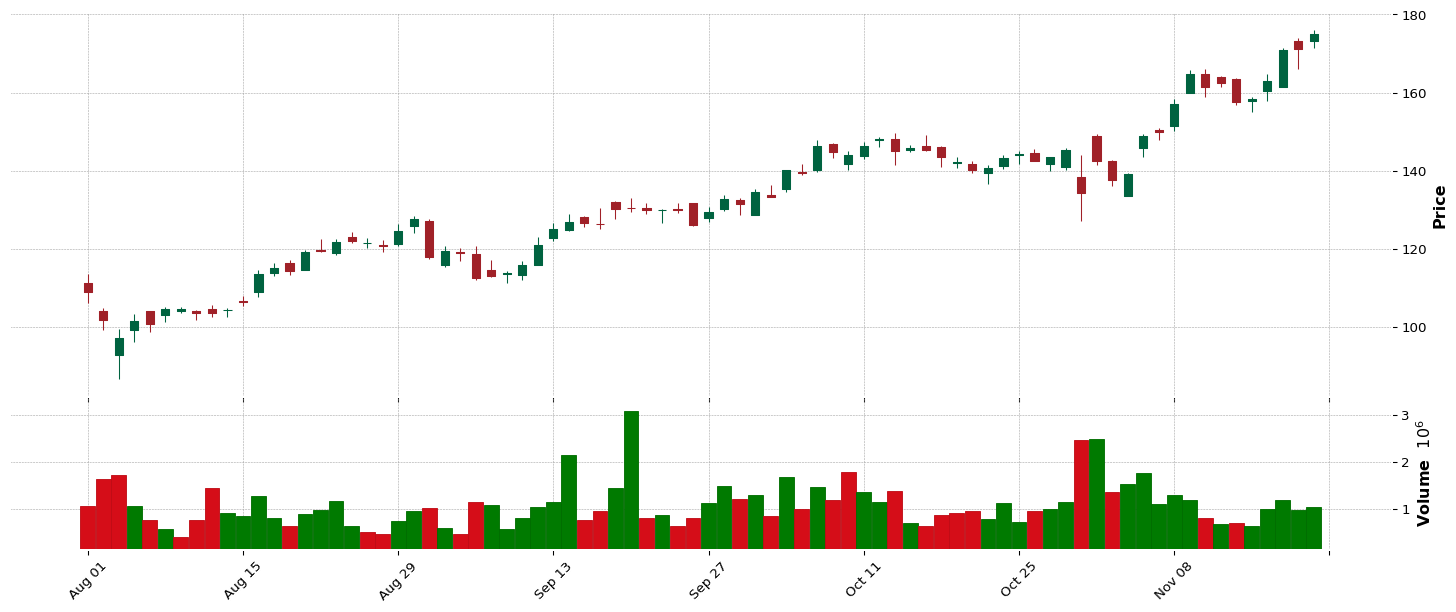
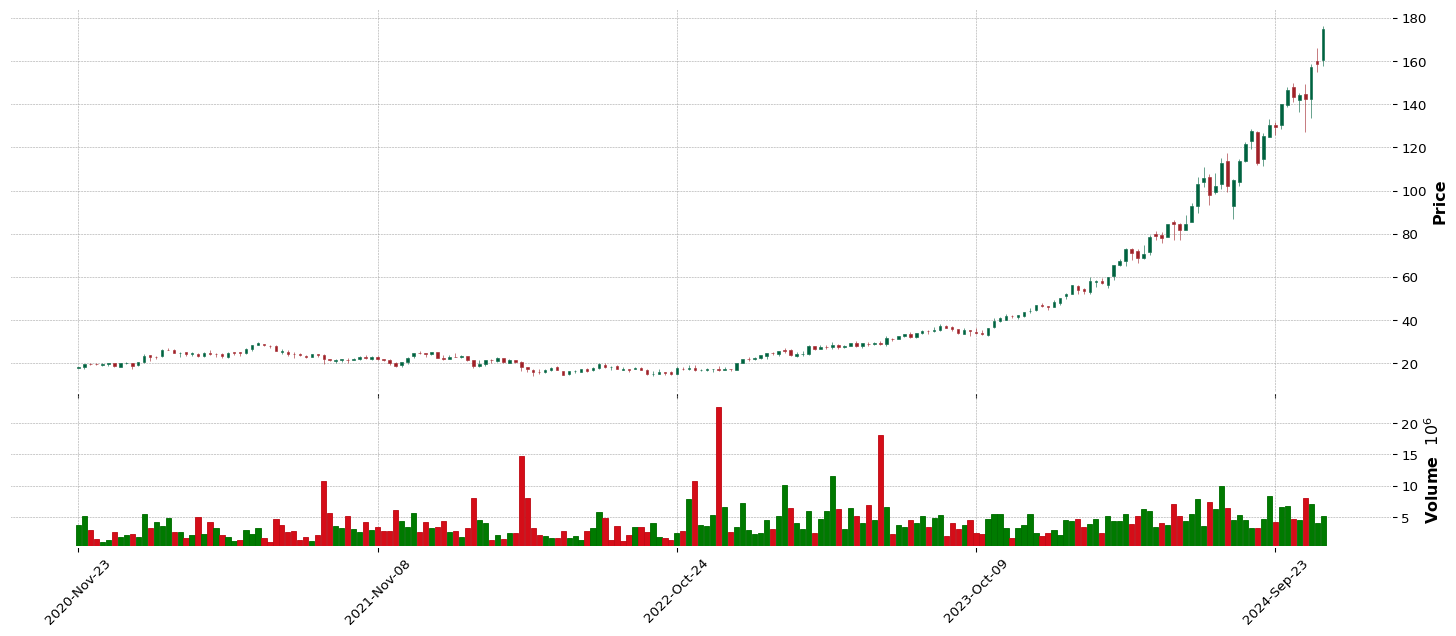
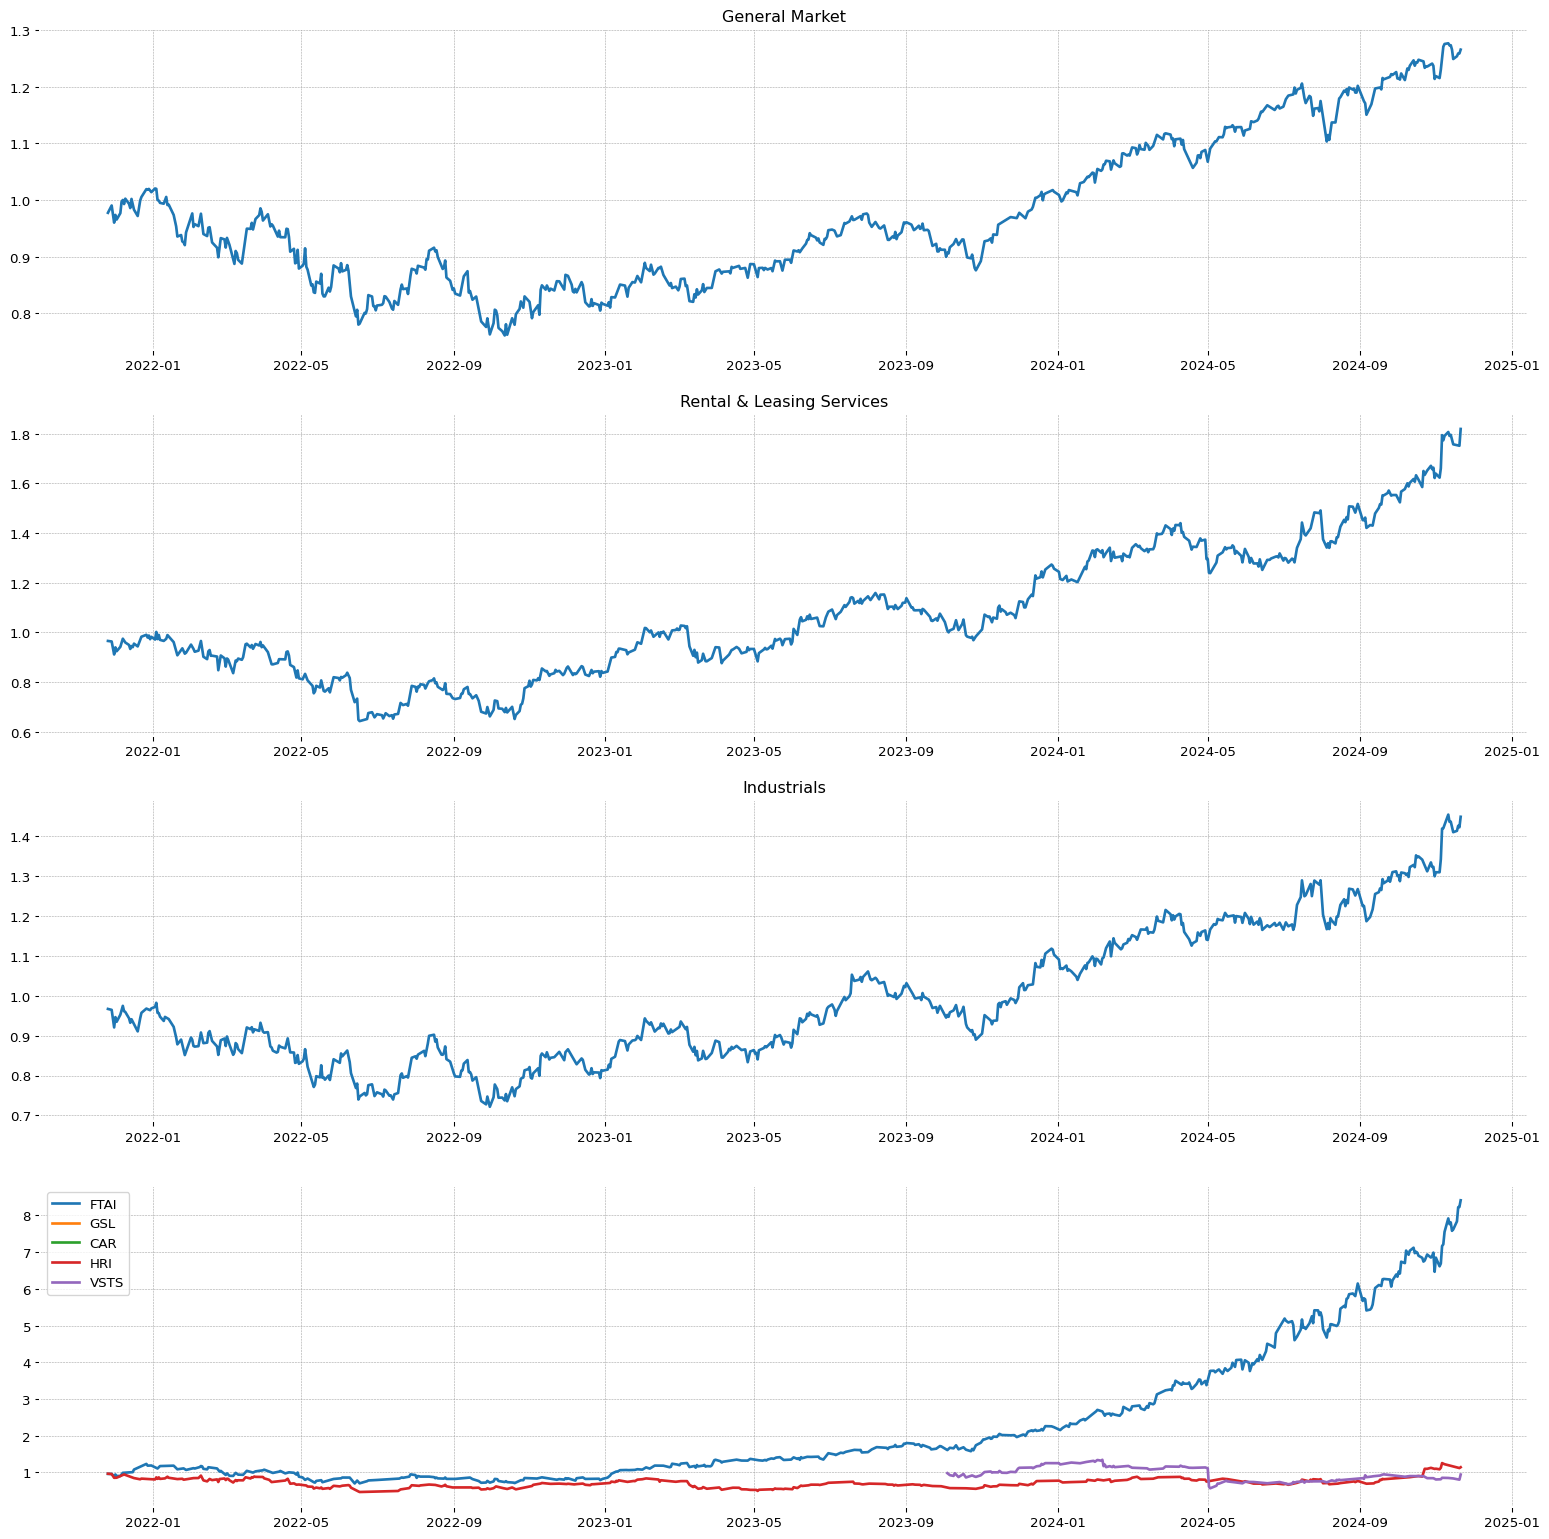 SMR
SMR
**** TECNICO ****
SMR
| Total stock number: | 88.55M |
| Namee: | NuScale Power Corporation |
| IPO date: | 2022-03-01 |
| Sector | Sector Position |
| Industrials | 7/11 |
| Industry | Industry Position - | Stock on industry - | RSI Sector: |
| Specialty Industrial Machinery | 40/147 | 1/53 | 3/402 |
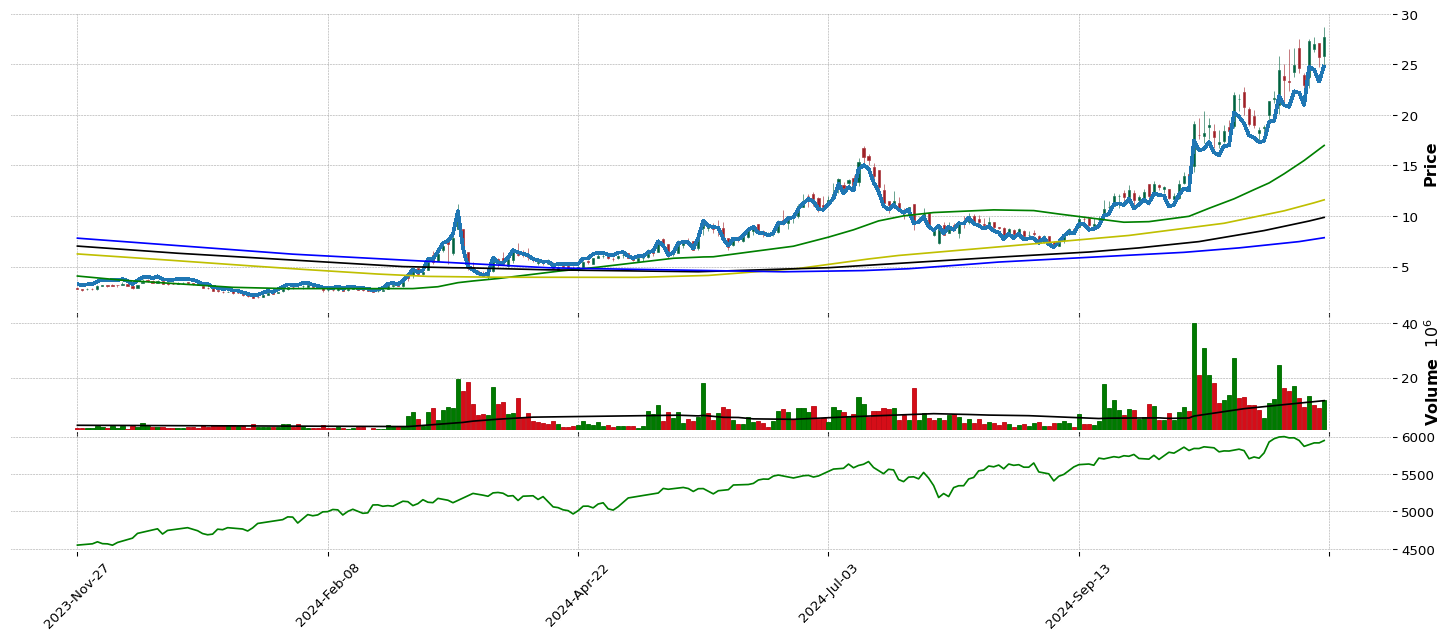
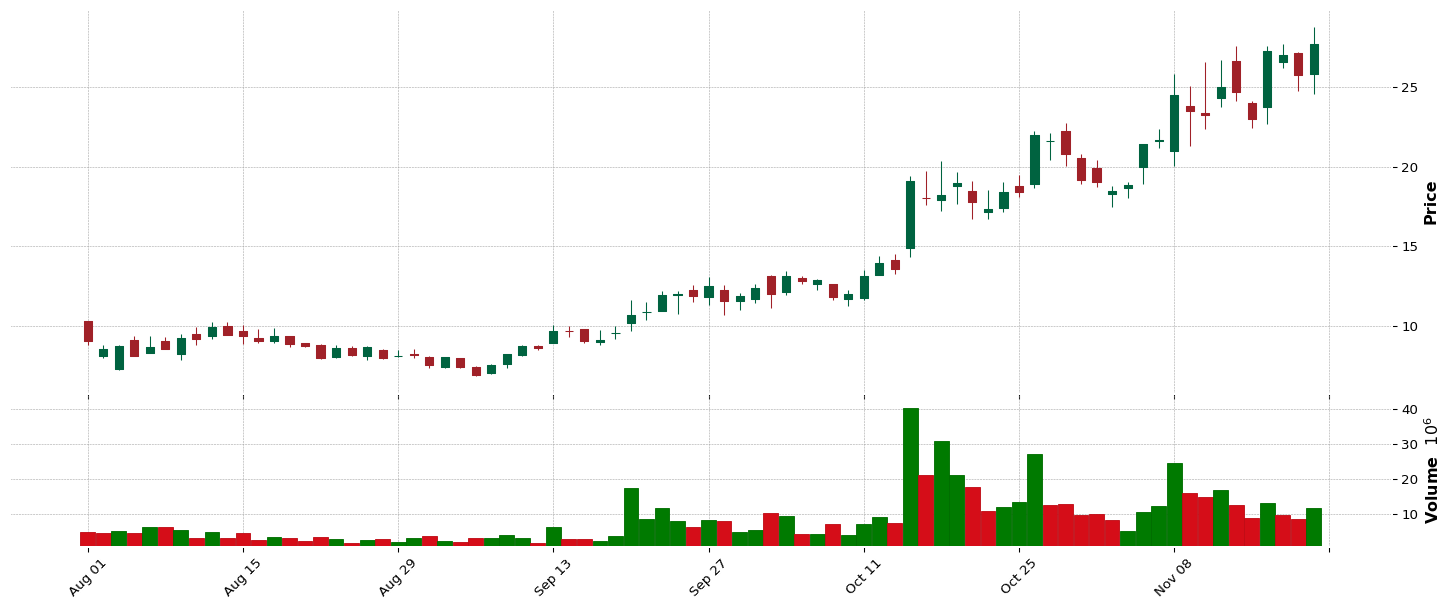
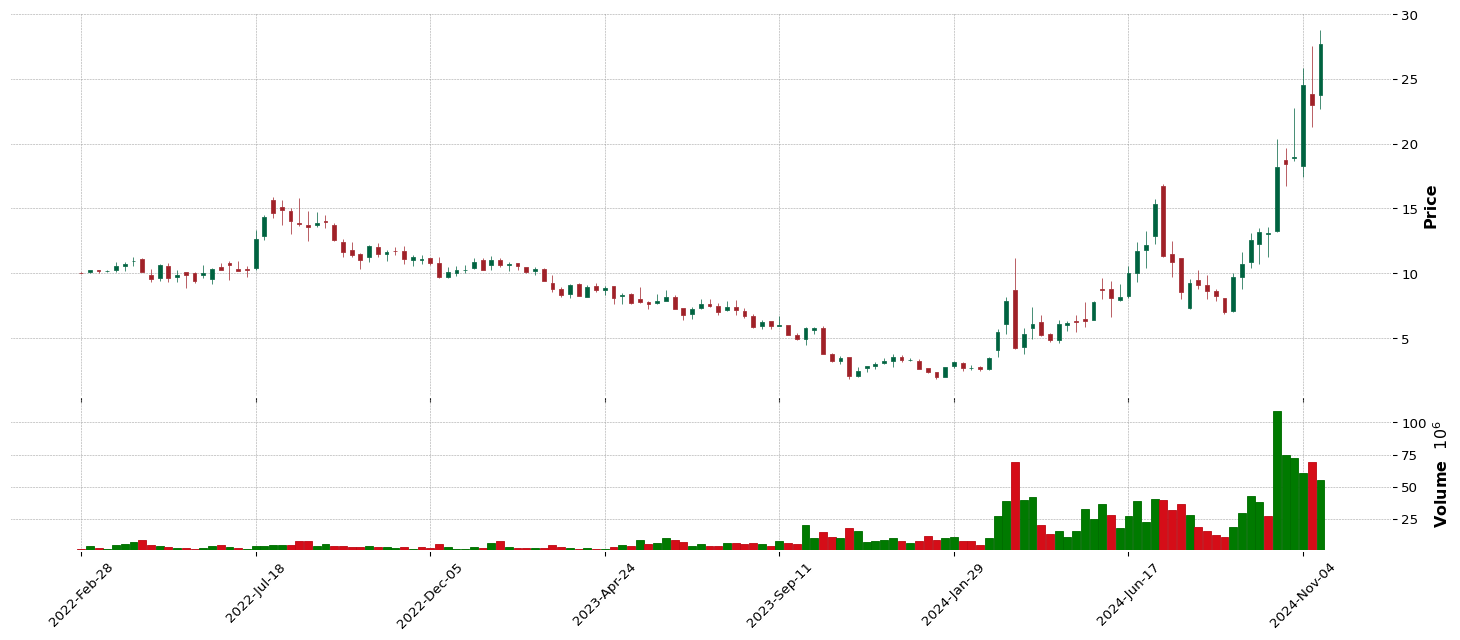
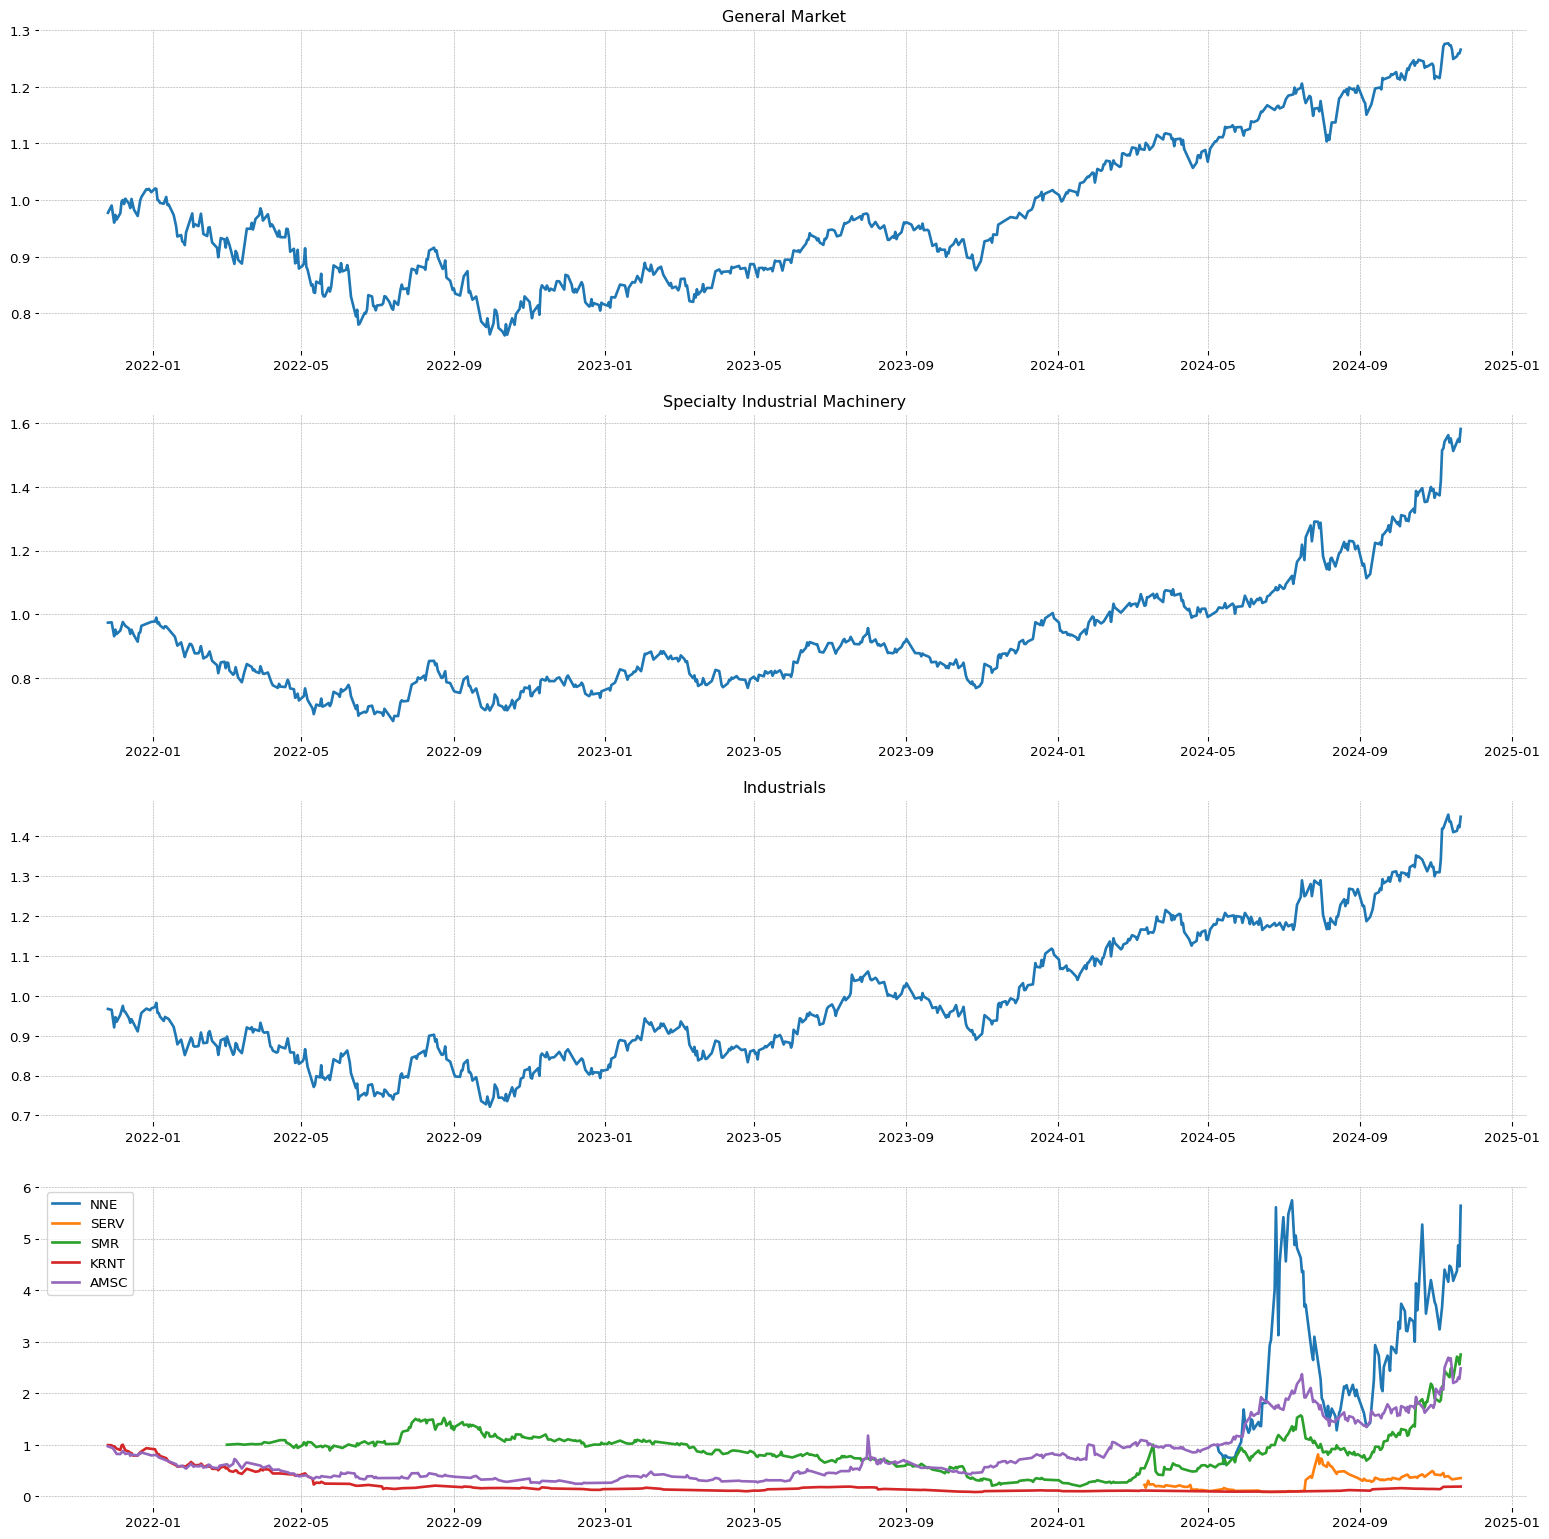 HROW
HROW
**** TECNICO ****
HROW
| Total stock number: | 26.41M |
| Namee: | Harrow Health, Inc. |
| IPO date: | 2007-09-28 |
| Sector | Sector Position |
| Healthcare | 1/11 |
| Industry | Industry Position - | Stock on industry - | RSI Sector: |
| Drug Manufacturers - Specialty & Generic | 30/147 | 4/44 | 6/487 |
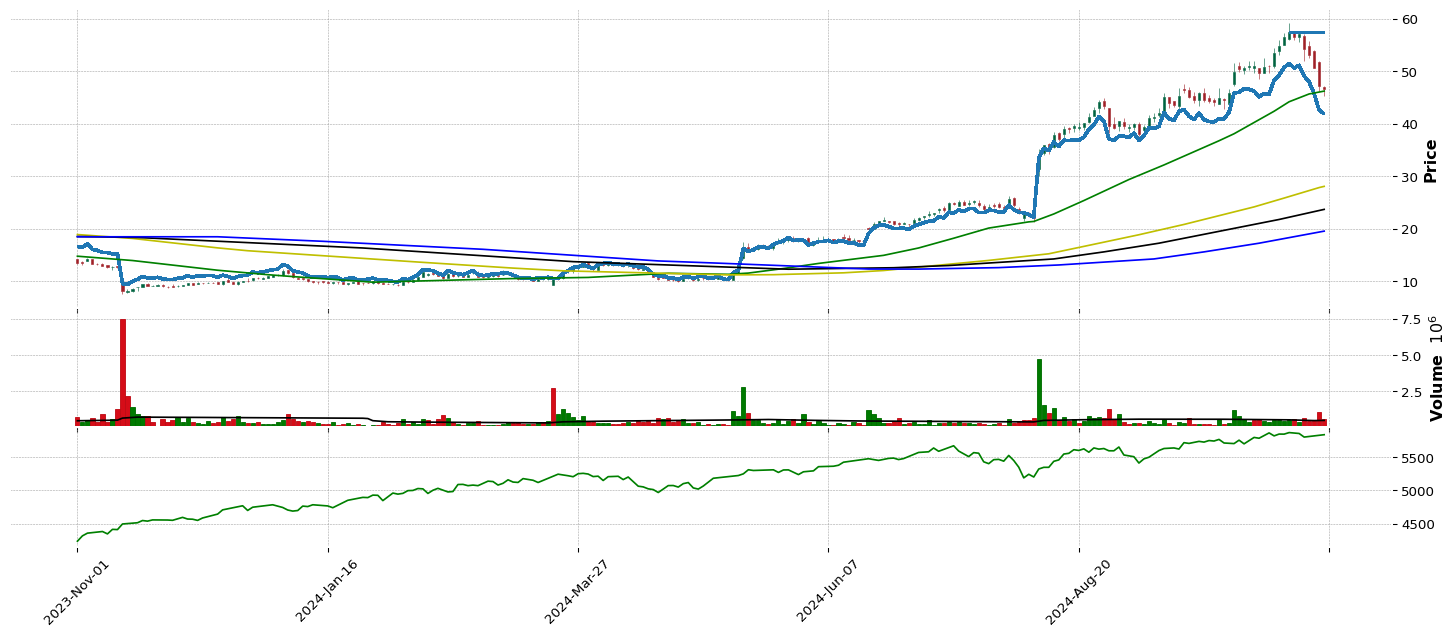
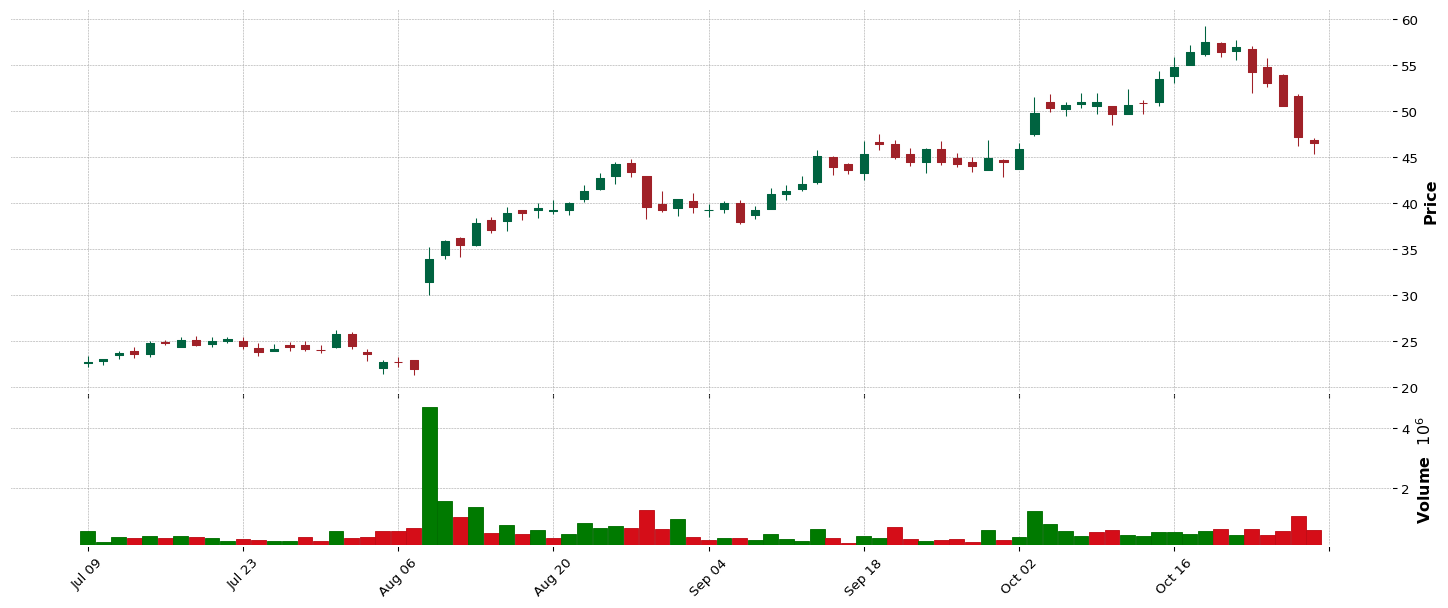
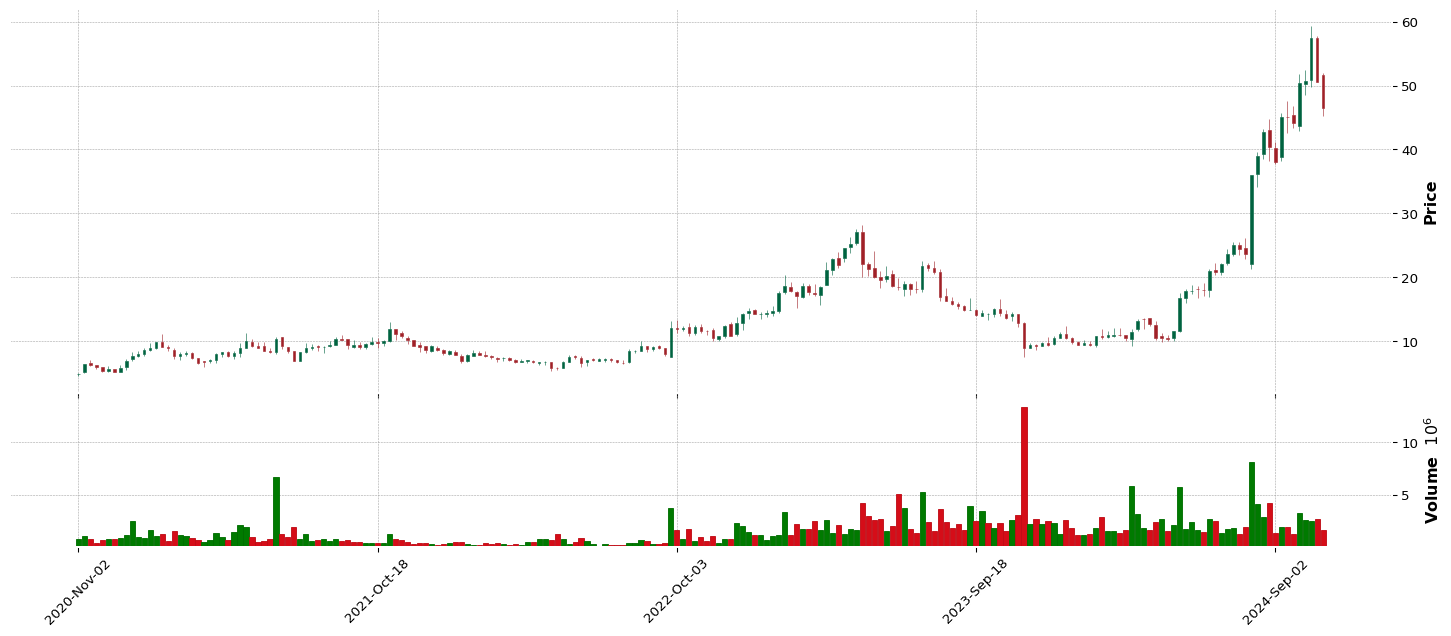
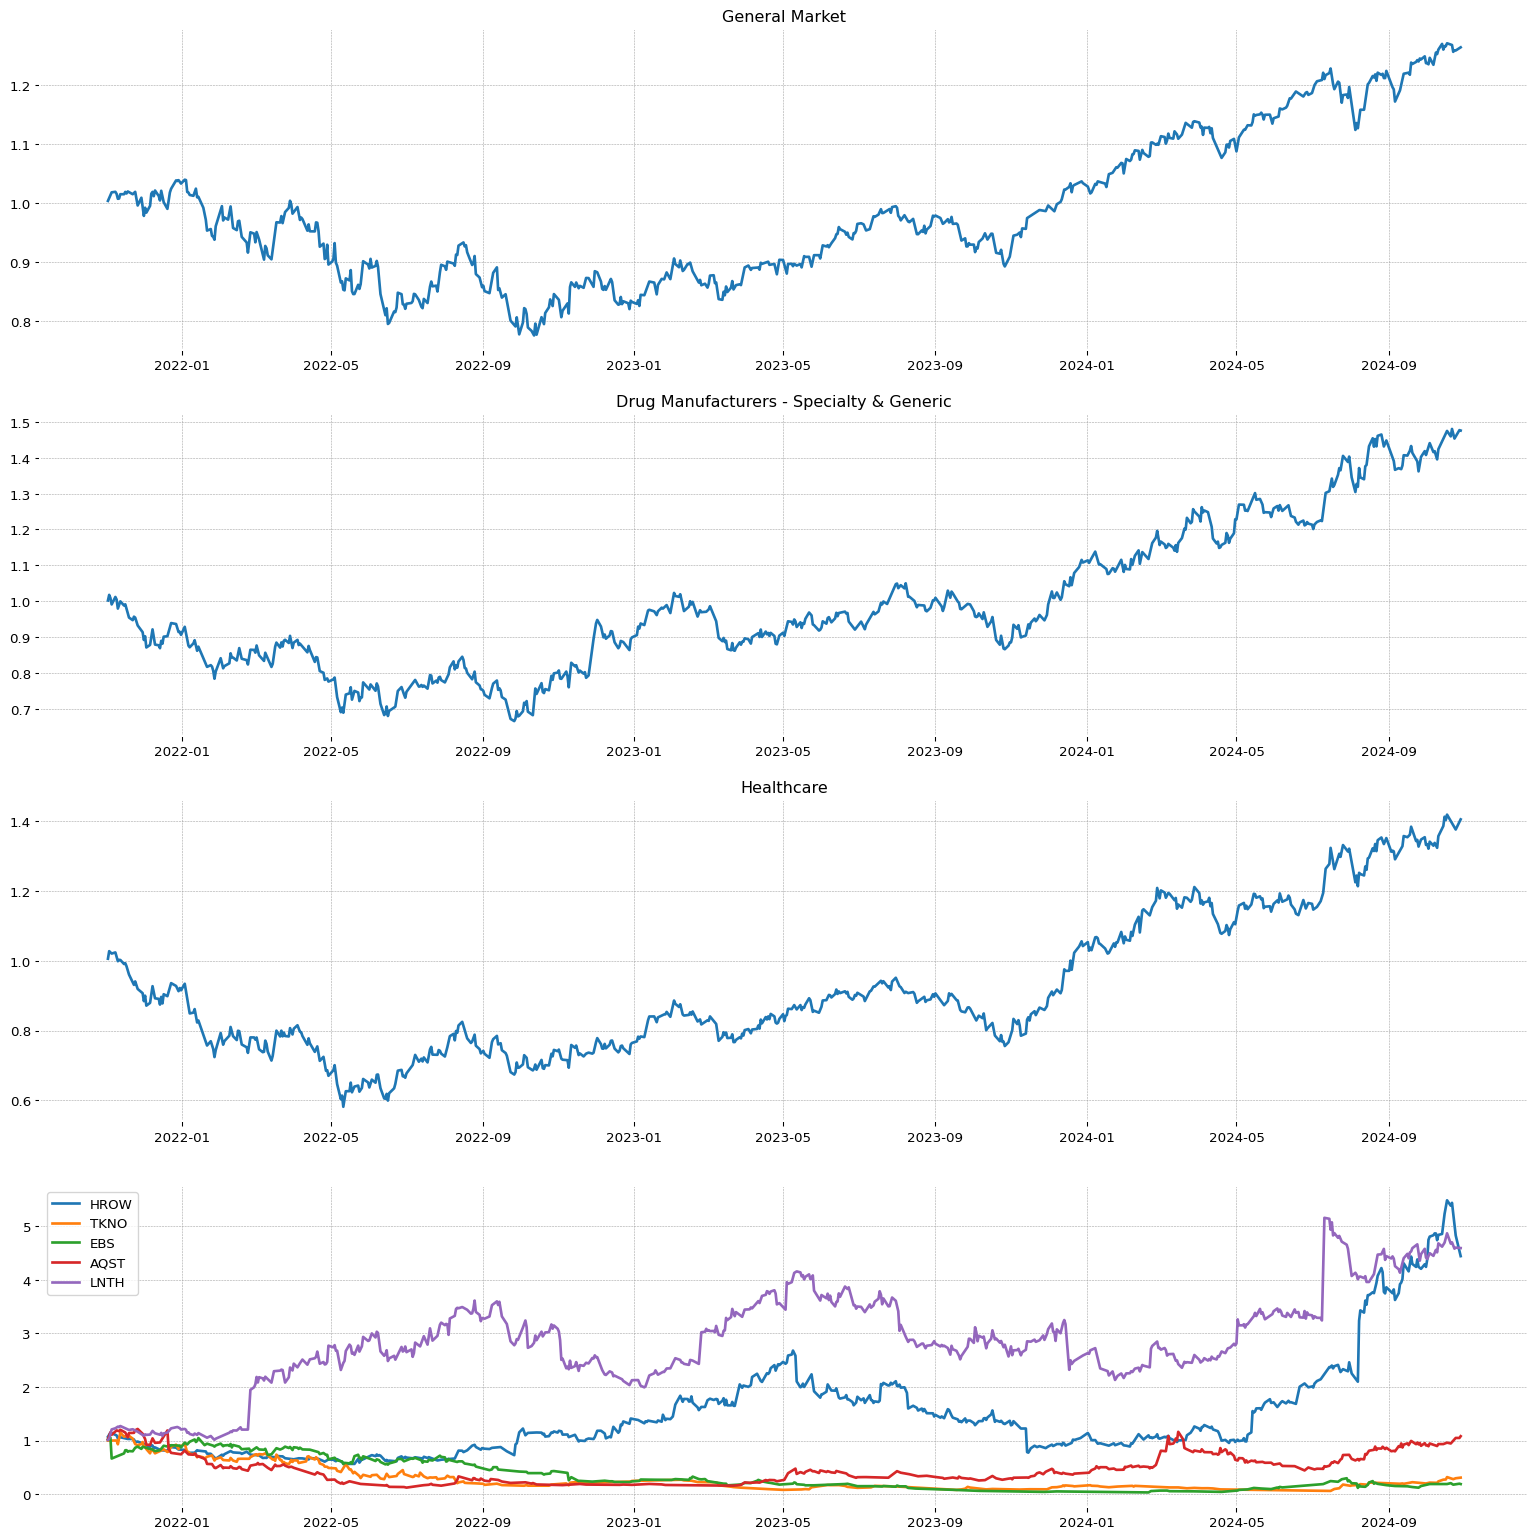 PLTR
PLTR
**** TECNICO ****
PLTR
| Total stock number: | 2.06B |
| Namee: | Palantir Technologies Inc. |
| IPO date: | 2020-09-30 |
| Sector | Sector Position |
| Technology | 2/11 |
| Industry | Industry Position - | Stock on industry - | RSI Sector: |
| Software - Infrastructure | 55/147 | 3/103 | 17/445 |

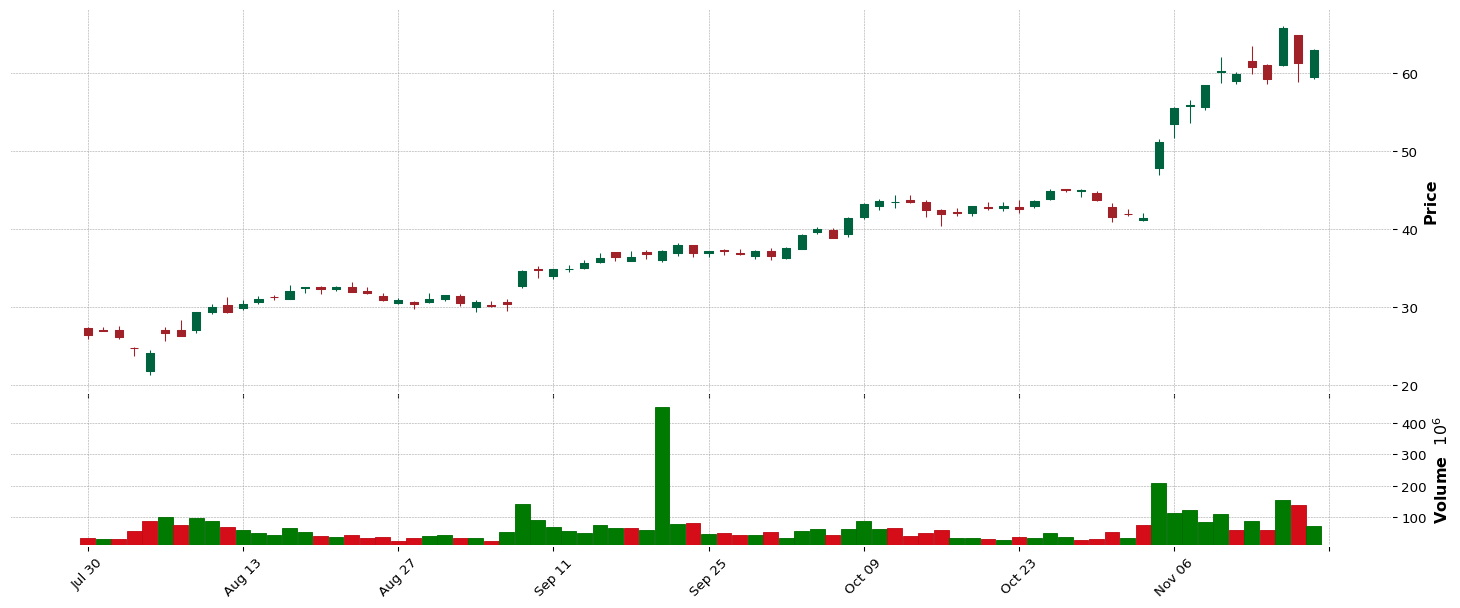
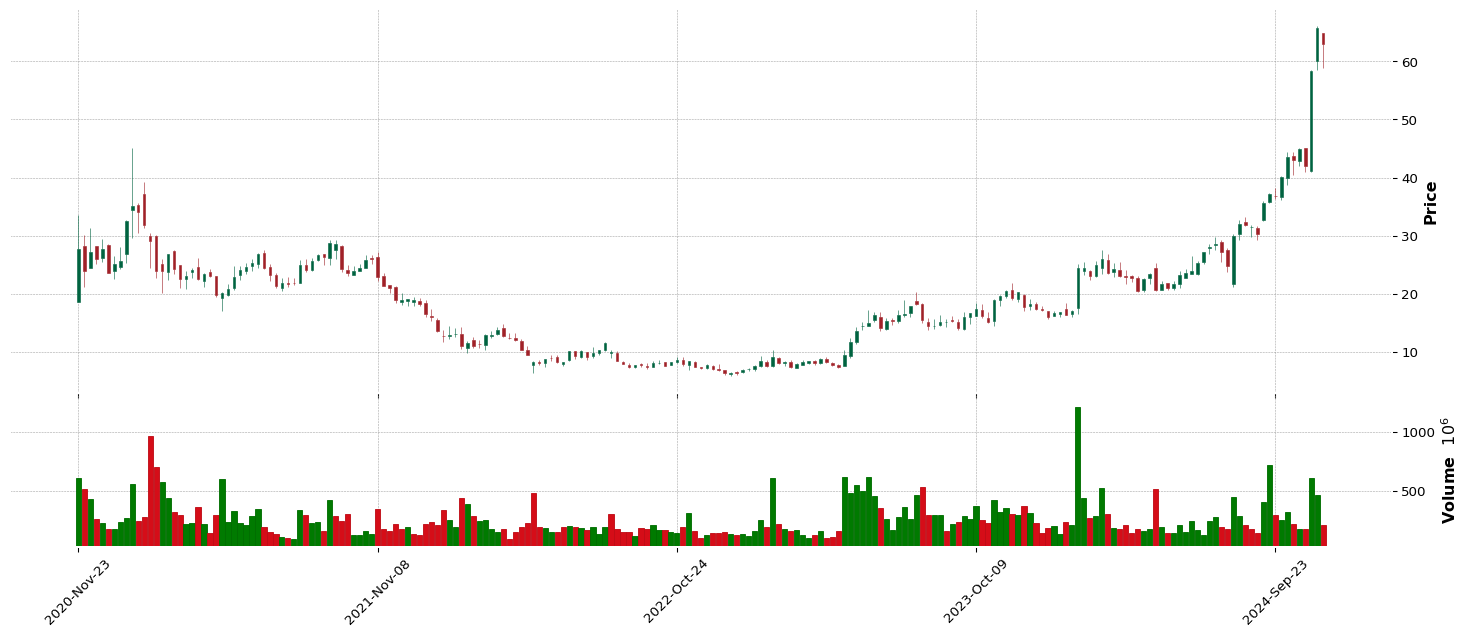
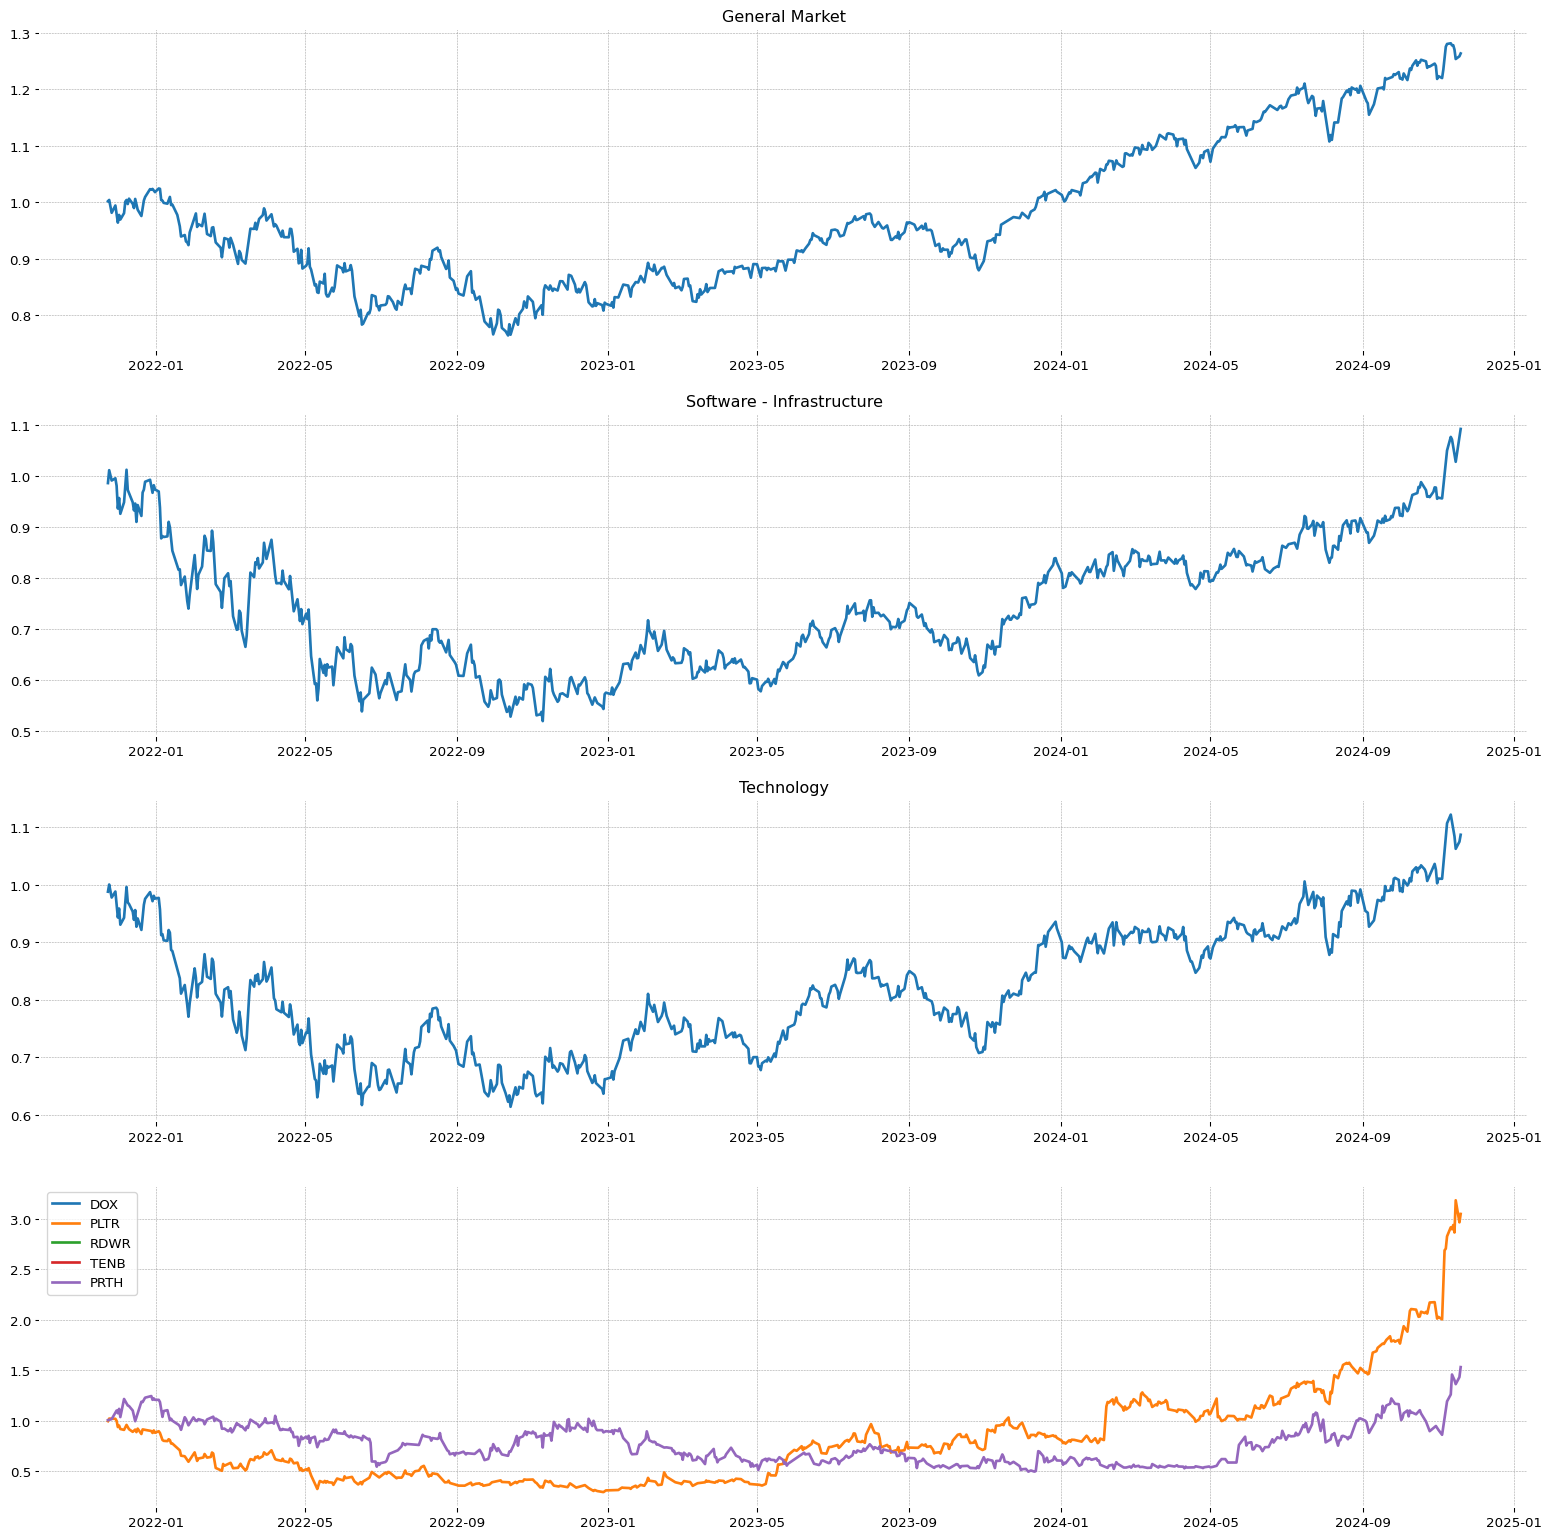 VHI
VHI
**** TECNICO ****
VHI
| Total stock number: | 2.39M |
| Namee: | Valhi, Inc. |
| IPO date: | 1980-03-17 |
| SMR | EPS | RS |
80.87 | 68.07 | 97 |
| Sector | Sector Position |
| Basic Materials | 9/11 |
| Industry | Industry Position - | Stock on industry - | RSI Sector: |
| Chemicals | 81/147 | 2/15 | 2/182 |
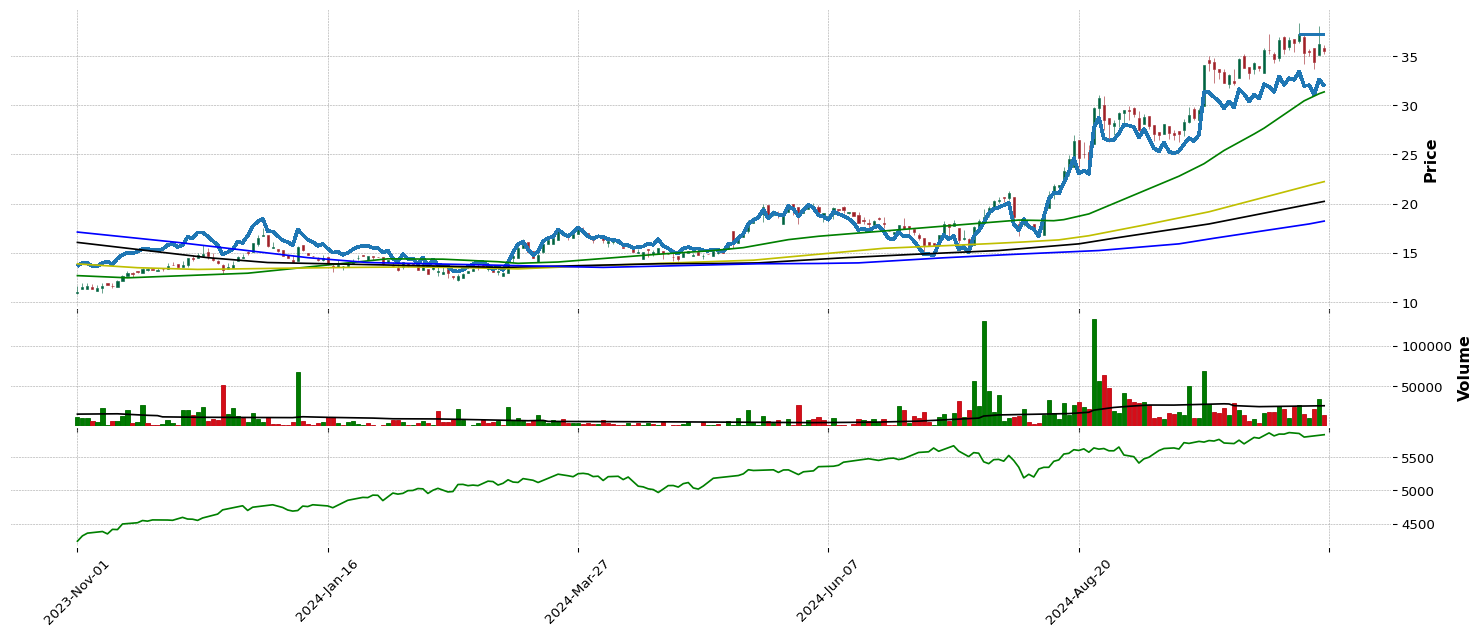
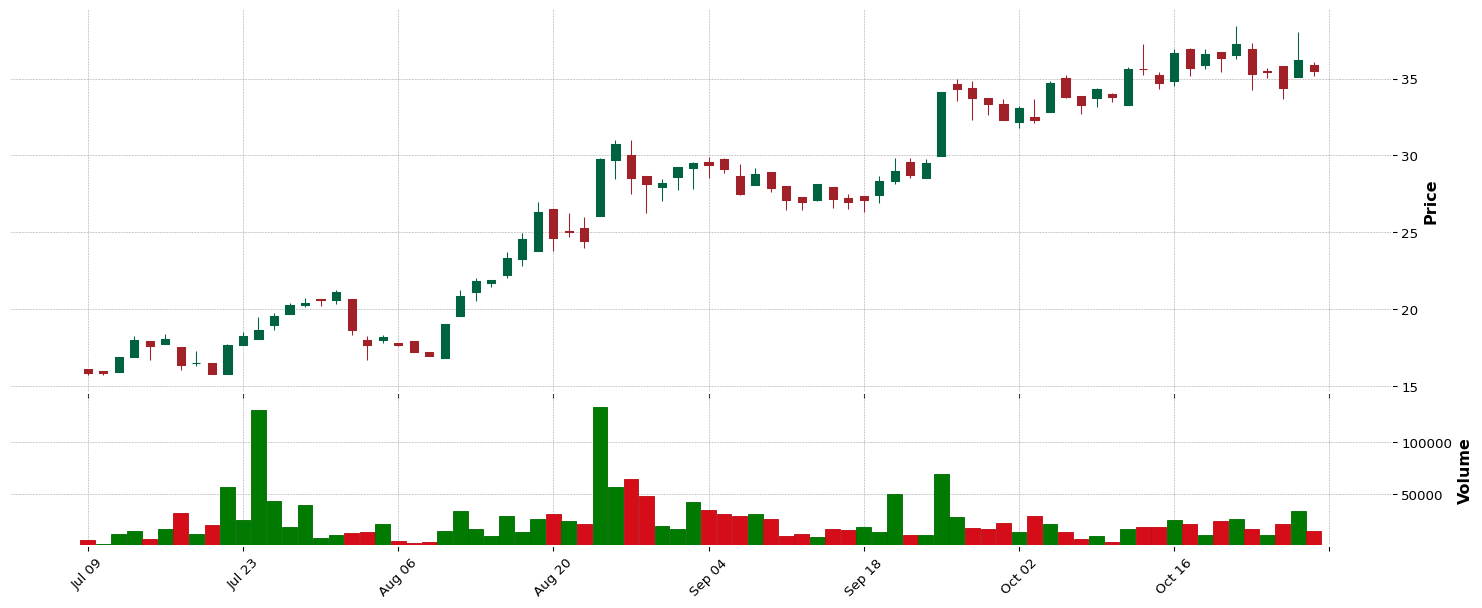
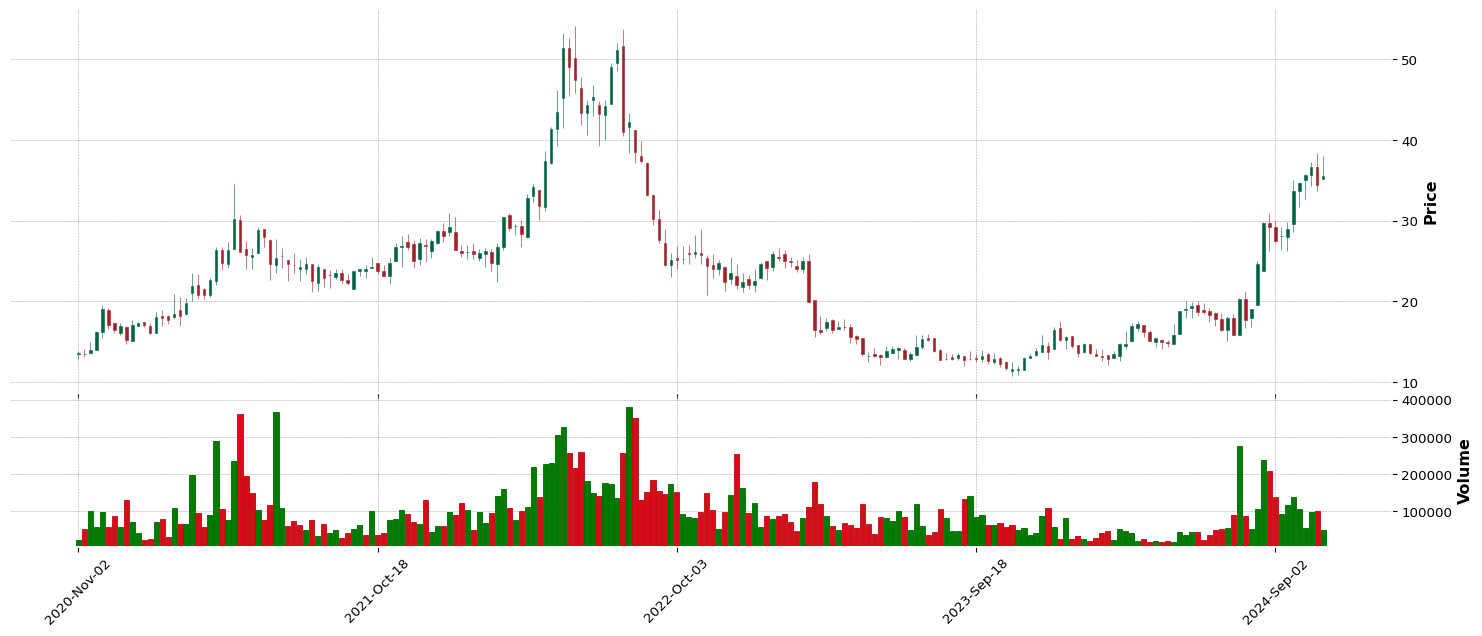
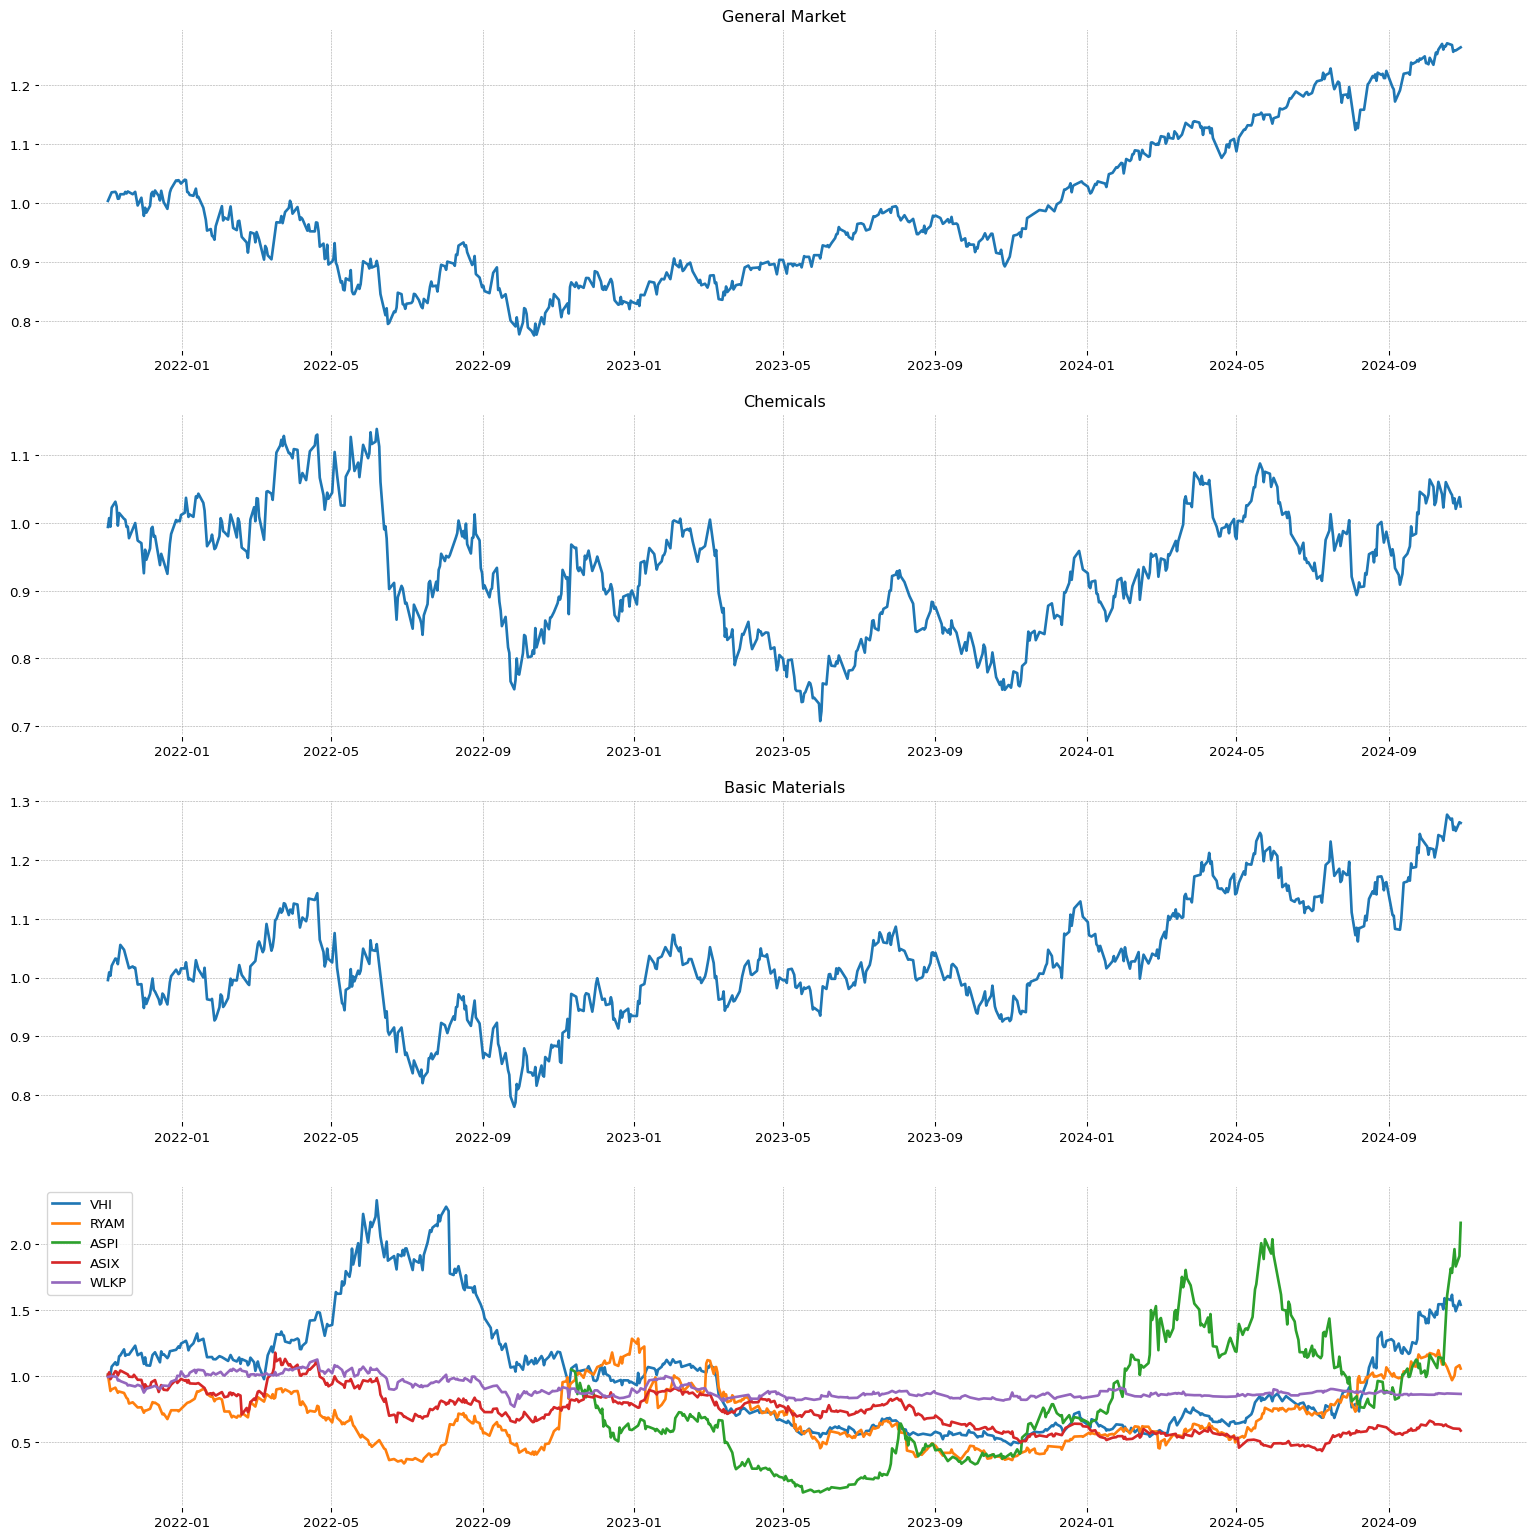 TRUP
TRUP
CSTL
**** TECNICO ****
CSTL
| Total stock number: | 26.93M |
| Namee: | Castle Biosciences, Inc. |
| IPO date: | 2019-07-25 |
| Sector | Sector Position |
| Healthcare | 1/11 |
| Industry | Industry Position - | Stock on industry - | RSI Sector: |
| Diagnostics & Research | 48/147 | 5/28 | 86/487 |
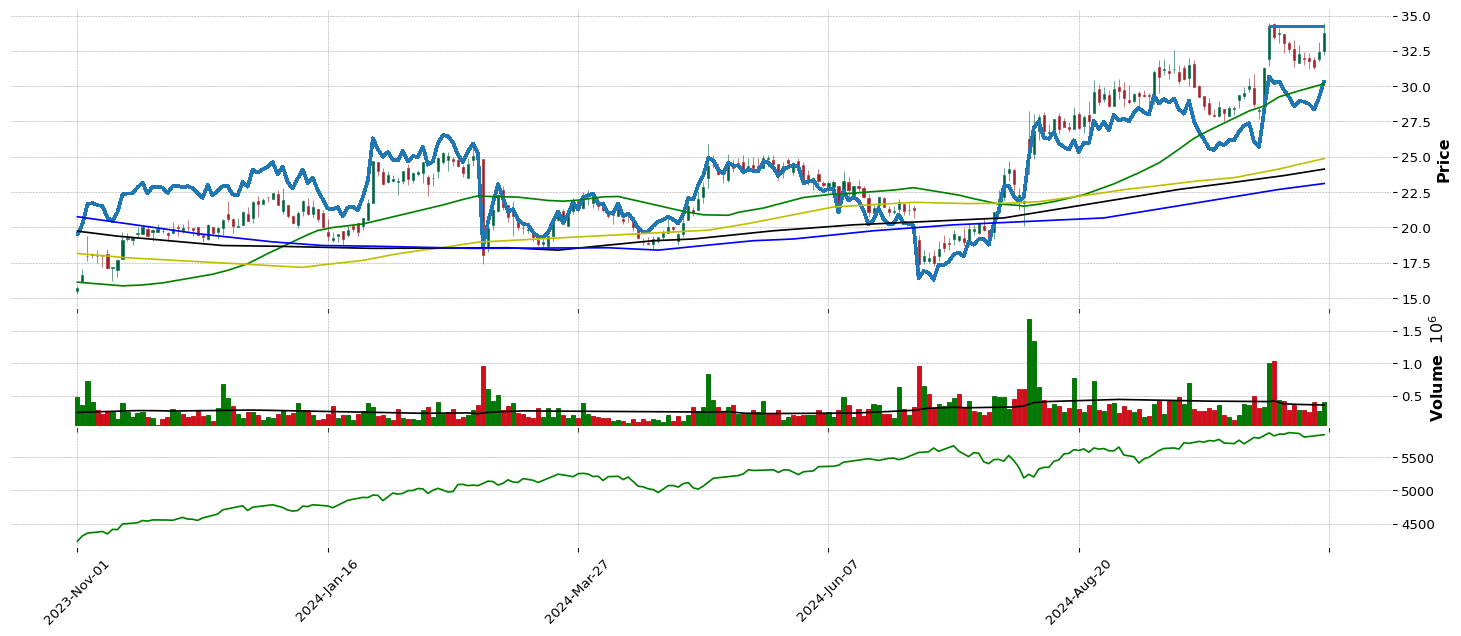
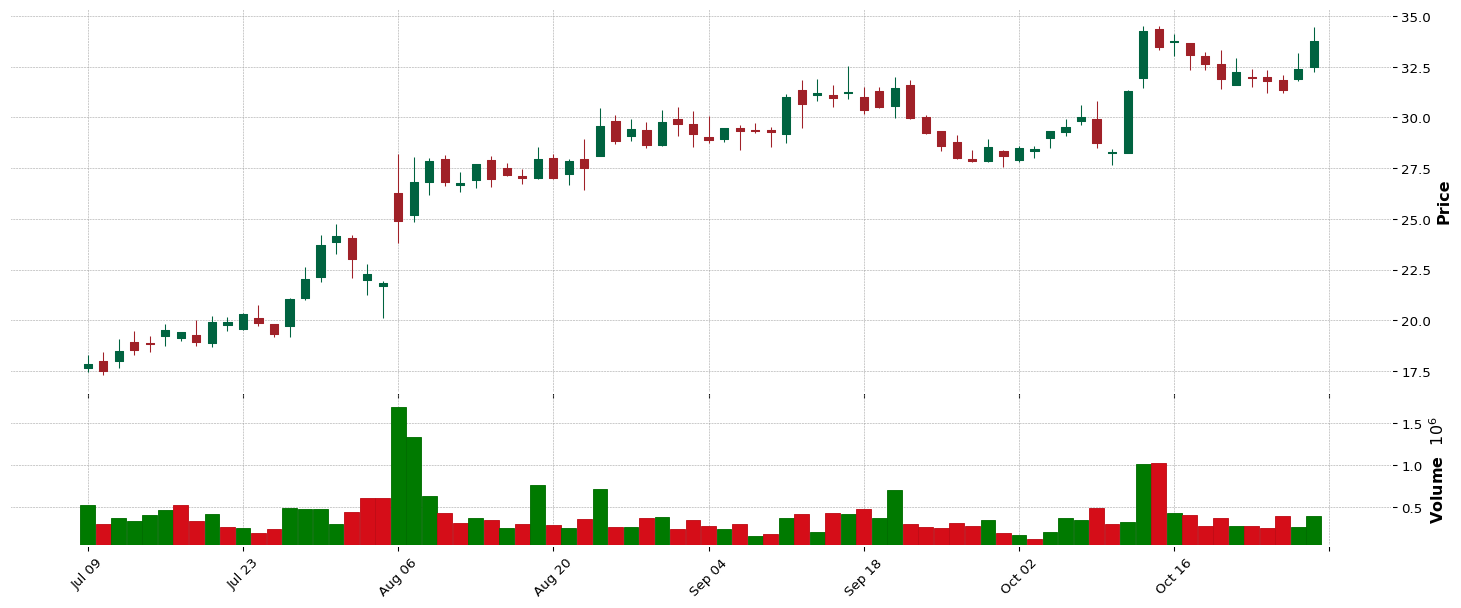
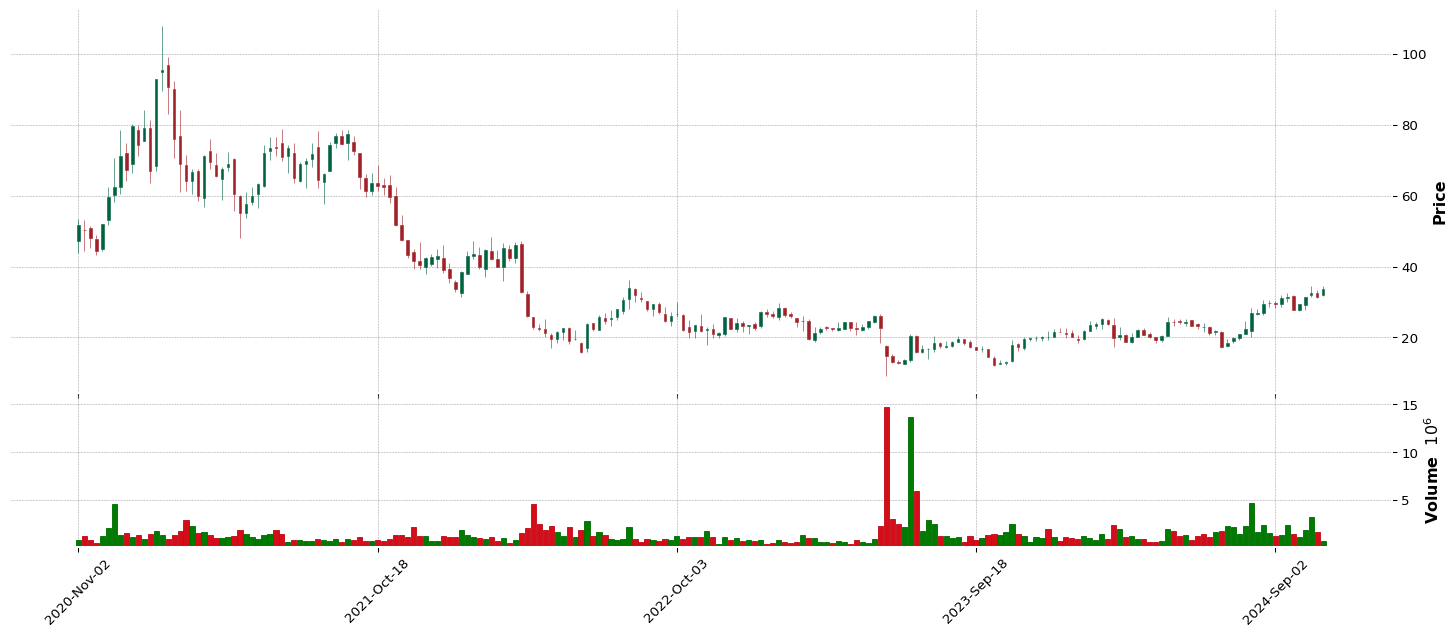
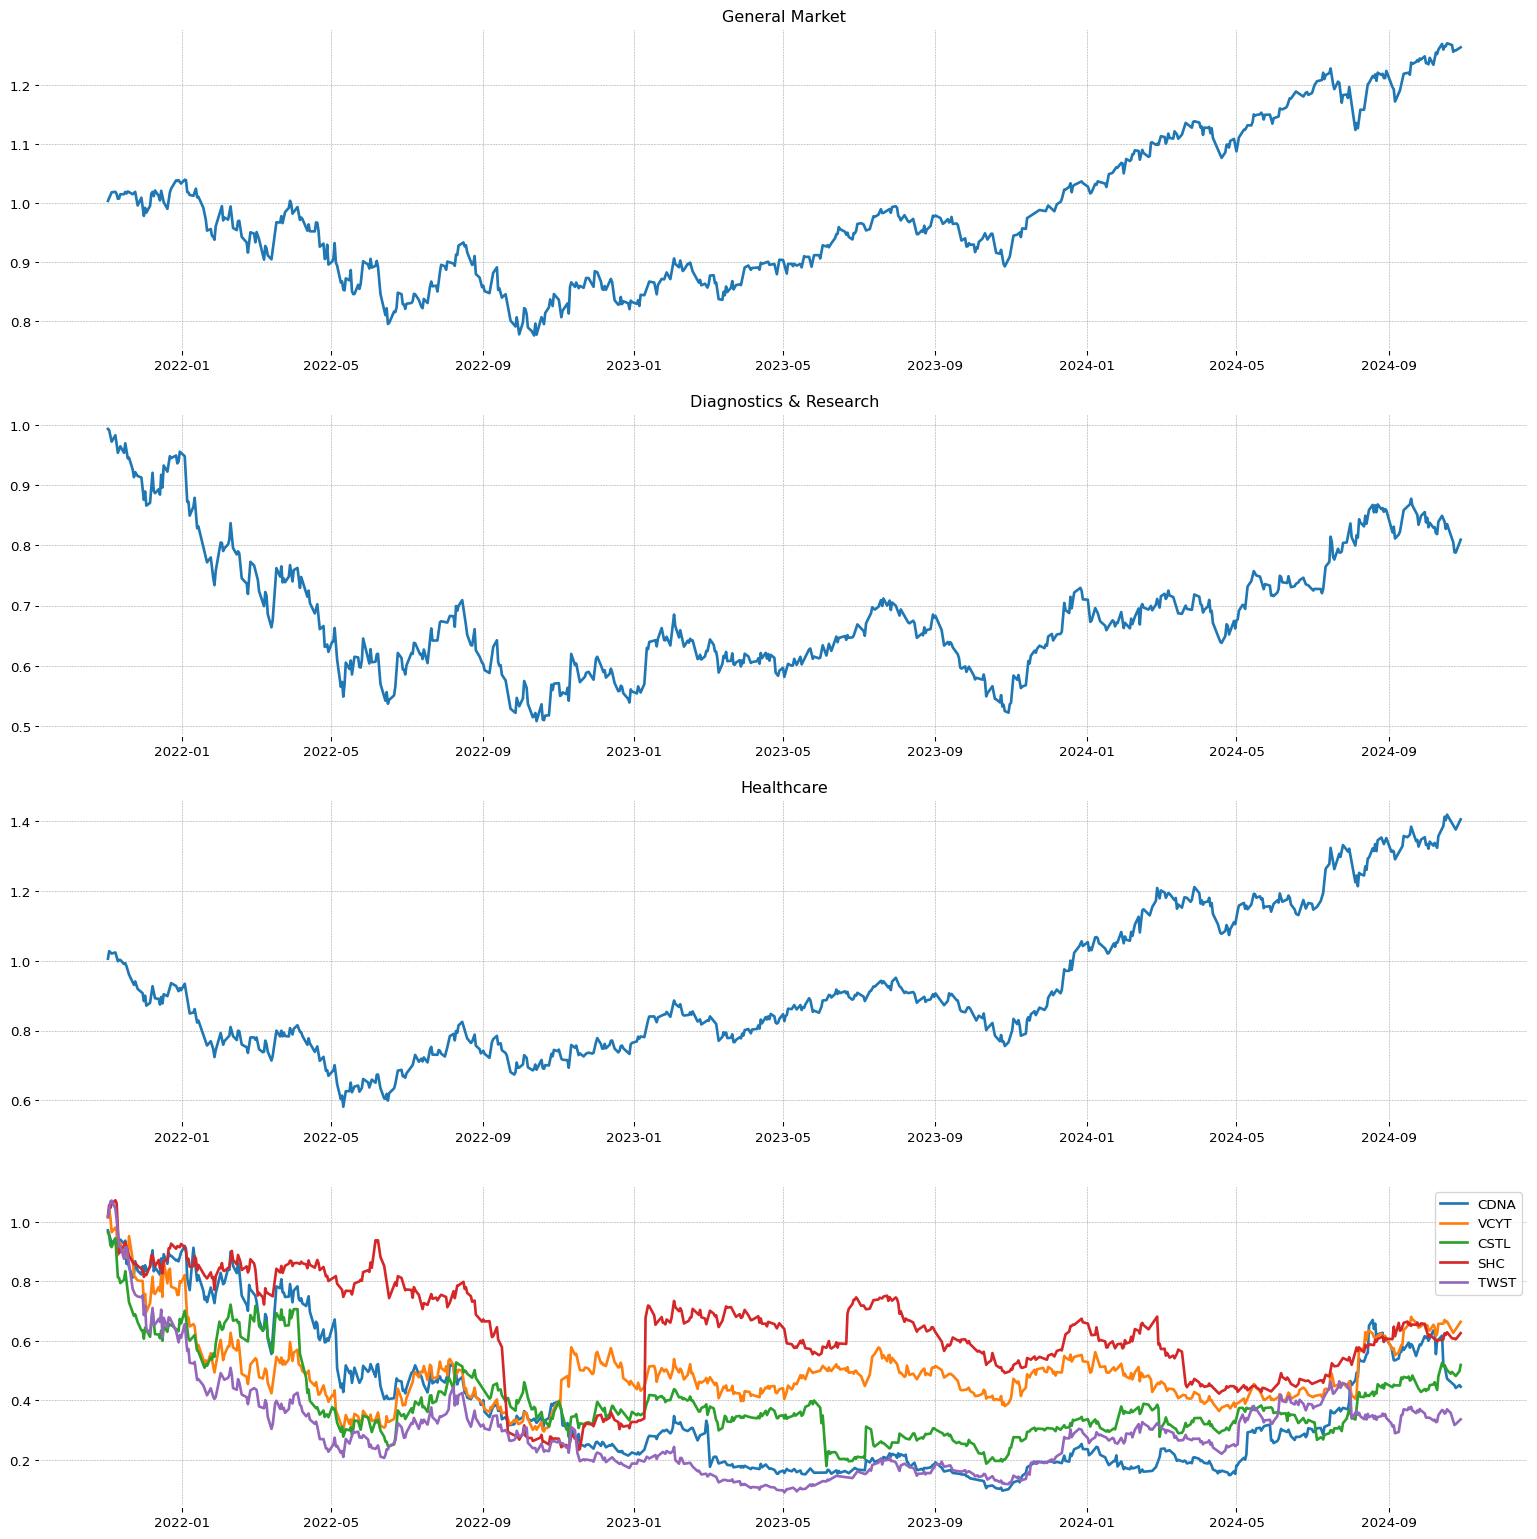 SEZL
SEZL
GDS
**** TECNICO ****
GDS
| Total stock number: | 832.38M |
| Namee: | GDS Holdings Limited |
| IPO date: | 2016-11-02 |
| SMR | EPS | RS |
29.57 | 16.95 | 91 |
| Sector | Sector Position |
| Technology | 2/11 |
| Industry | Industry Position - | Stock on industry - | RSI Sector: |
| Information Technology Services | 10/147 | 3/43 | 6/445 |
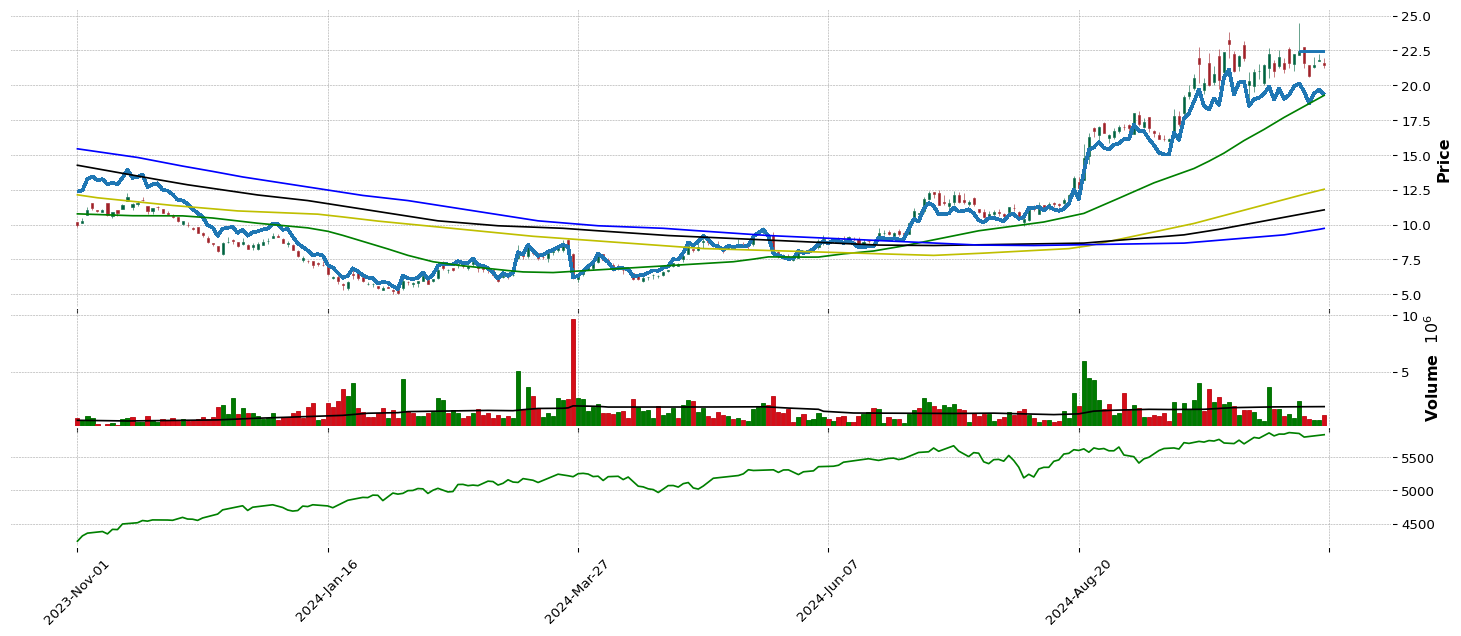
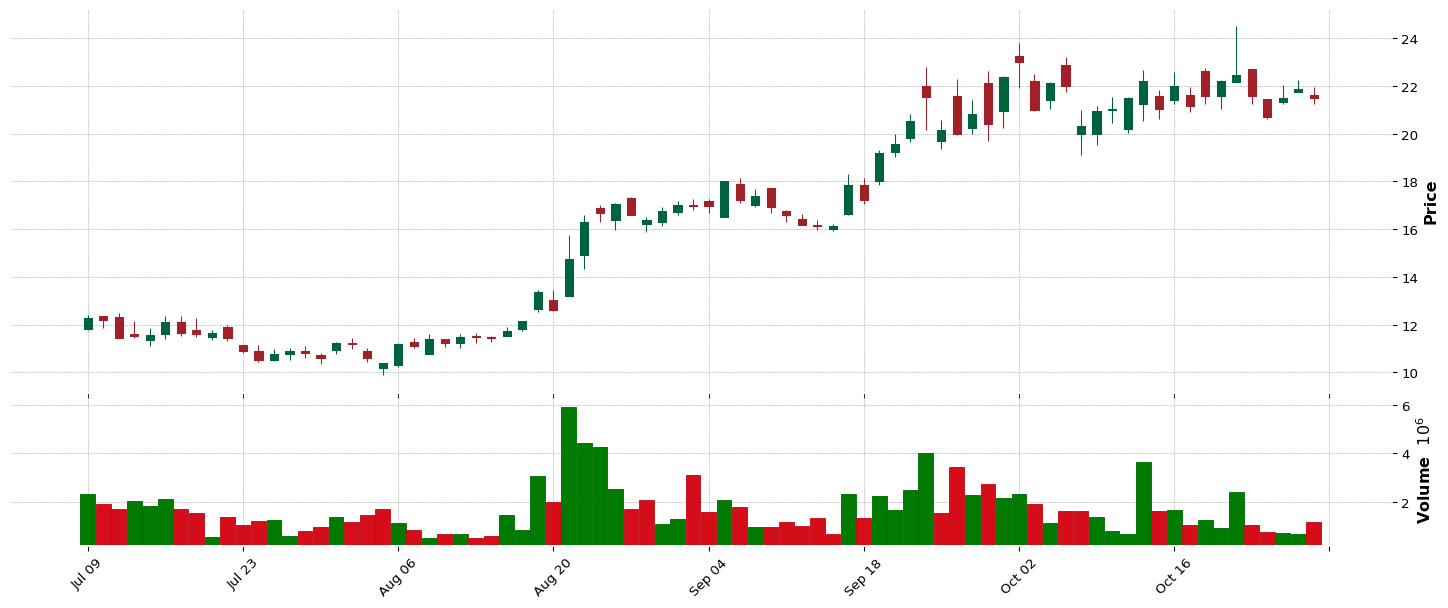
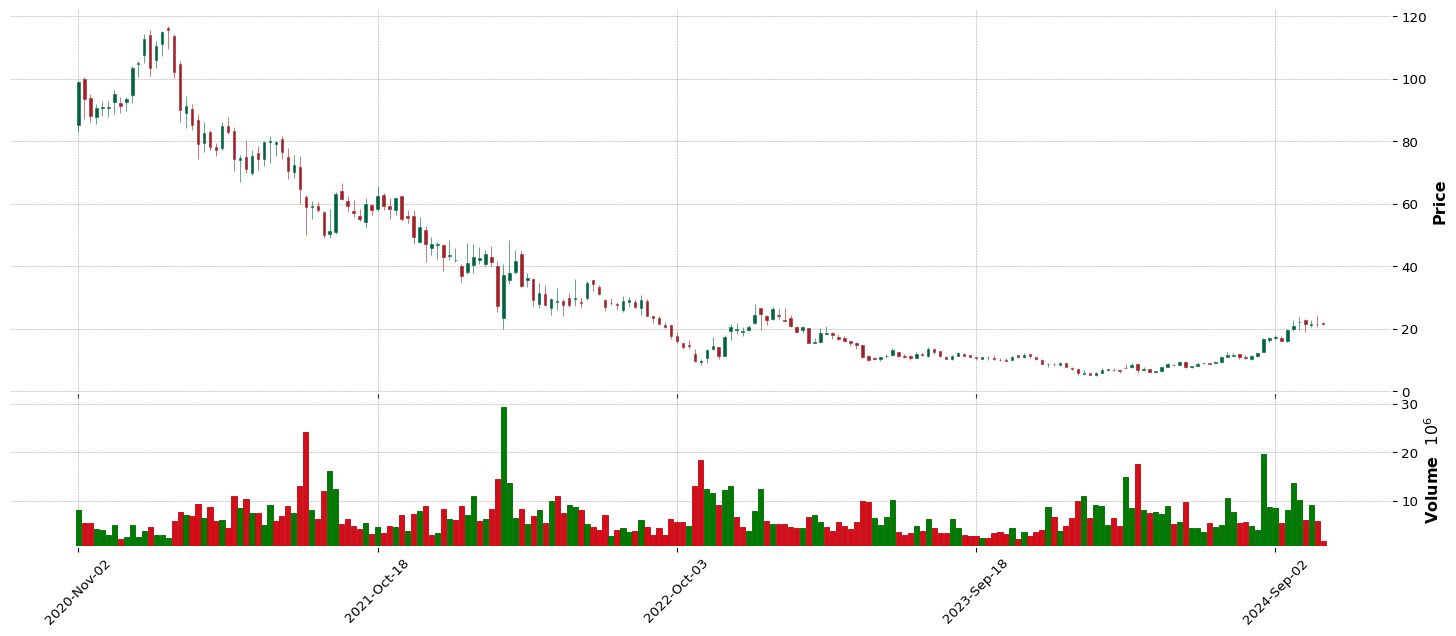
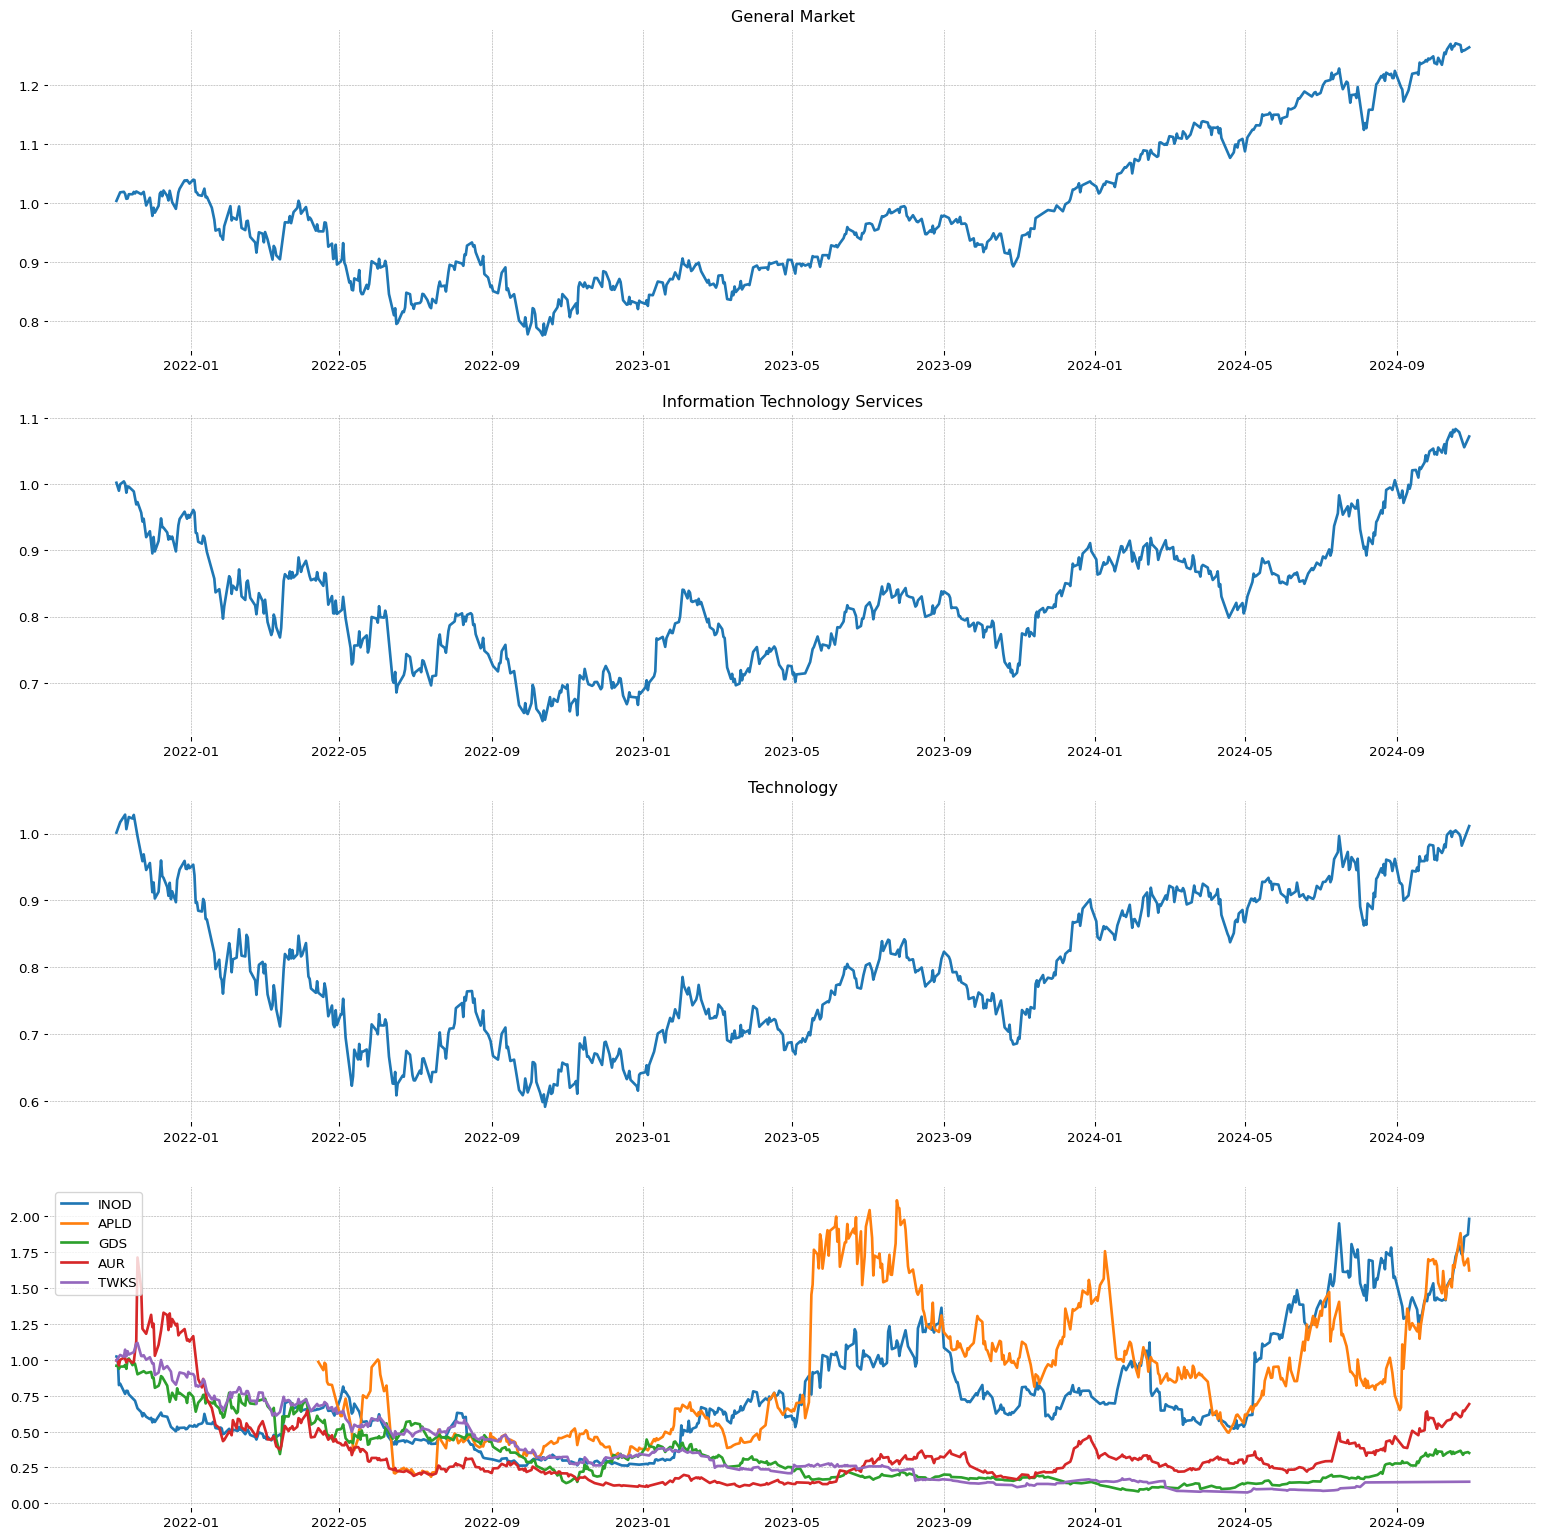 HBB
HBB
**** TECNICO ****
HBB
| Total stock number: | 6.37M |
| Namee: | Hamilton Beach Brands Holding Company |
| IPO date: | 2017-09-26 |
| SMR | EPS | RS |
86.65 | 72.74 | 94 |
| Sector | Sector Position |
| Consumer Cyclical | 6/11 |
| Industry | Industry Position - | Stock on industry - | RSI Sector: |
| Furnishings, Fixtures & Appliances | 32/147 | 3/14 | 34/351 |
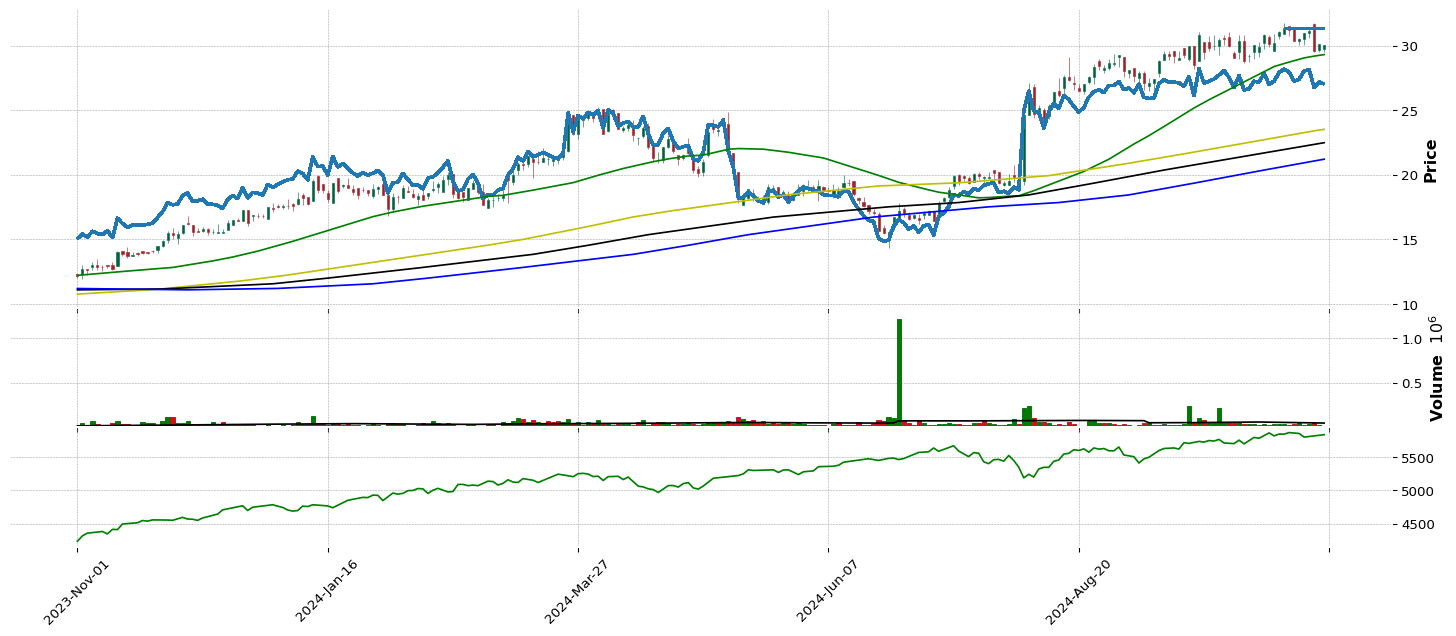
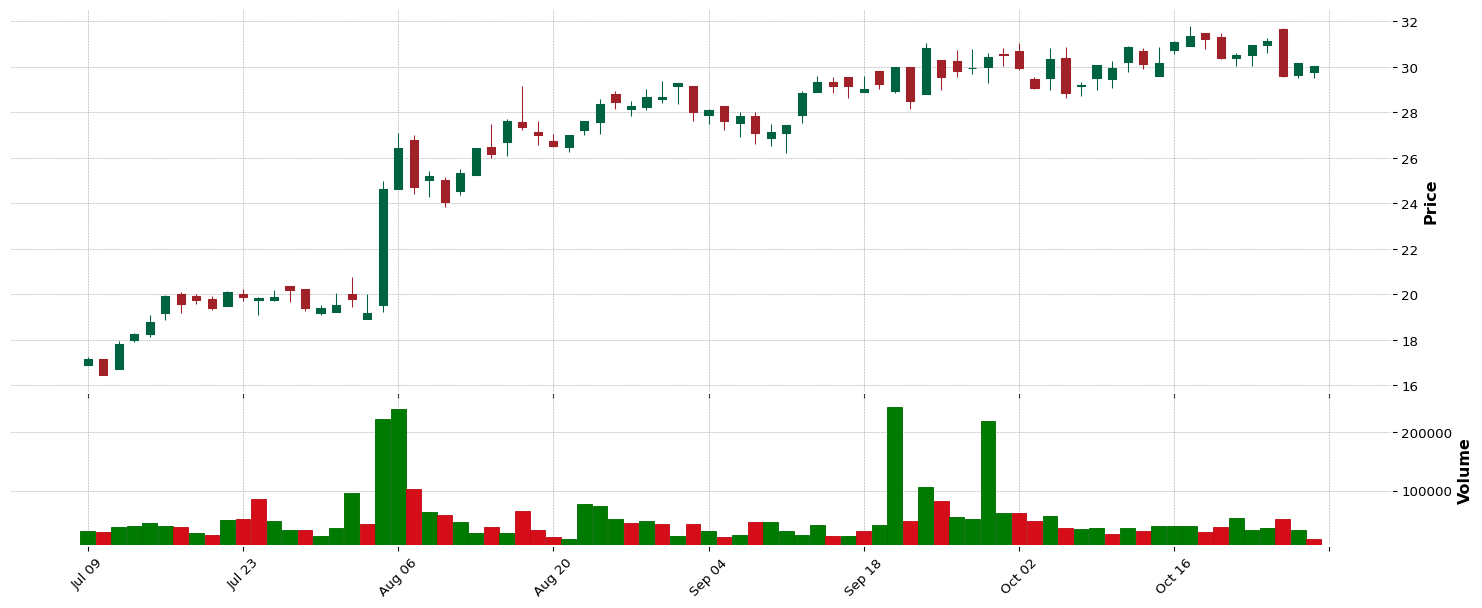
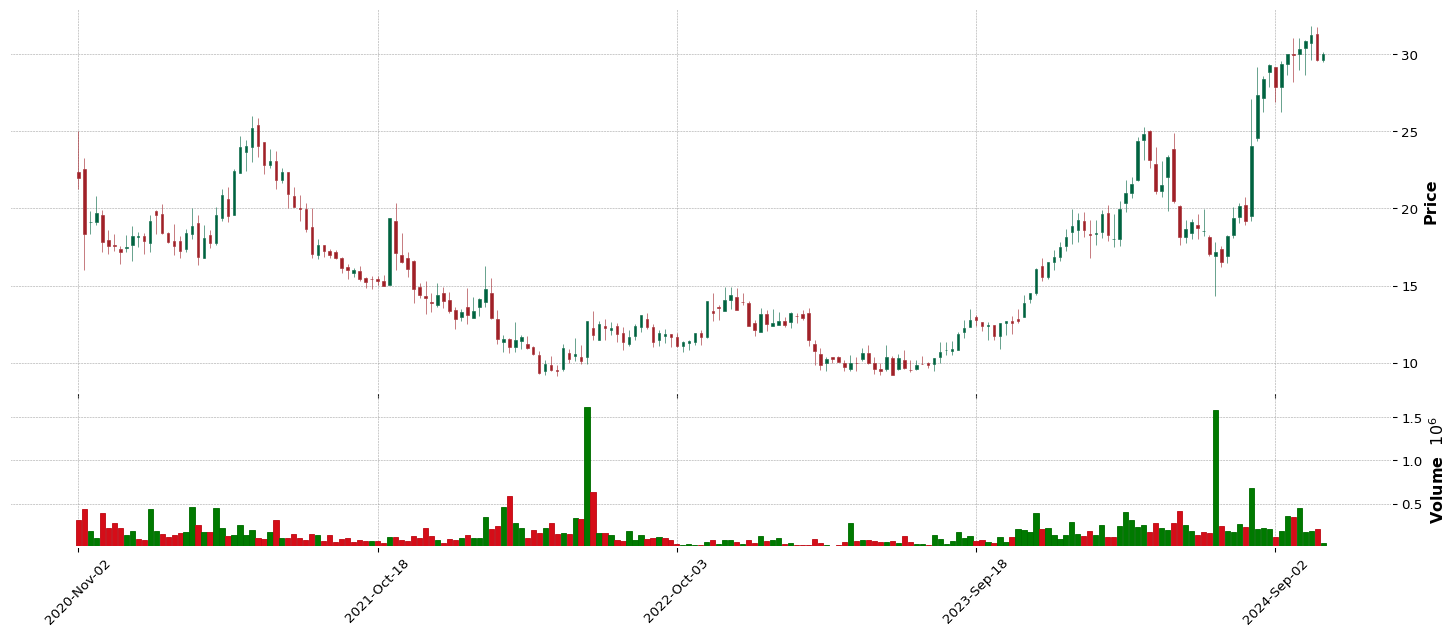
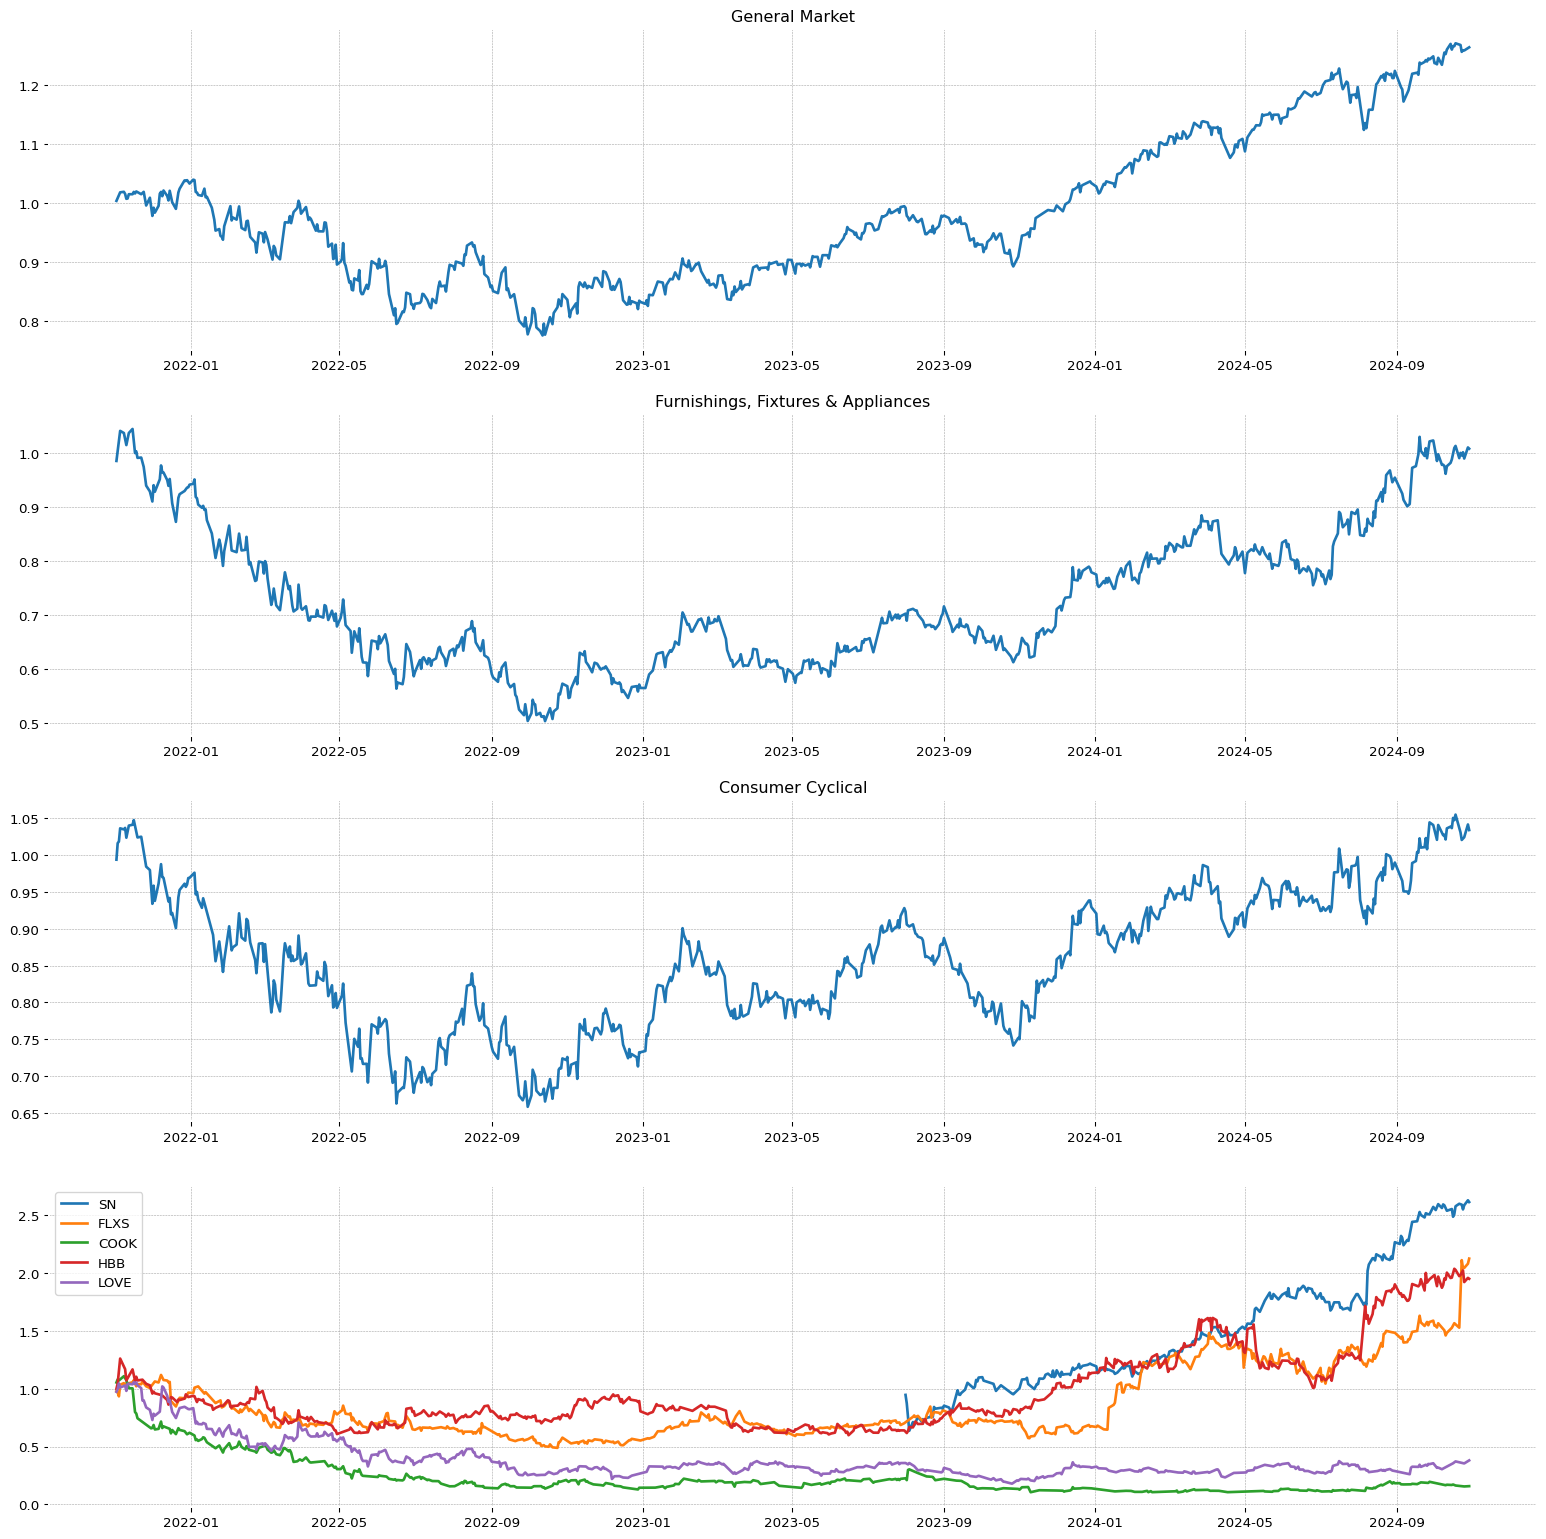 VNO
VNO
**** TECNICO ****
VNO
| Total stock number: | 178.43M |
| Namee: | Vornado Realty Trust |
| IPO date: | 1980-03-17 |
| SMR | EPS | RS |
47.93 | 52.83 | 92 |
| Sector | Sector Position |
| Real Estate | 5/11 |
| Industry | Industry Position - | Stock on industry - | RSI Sector: |
| REIT - Office | 25/147 | 2/20 | 3/178 |
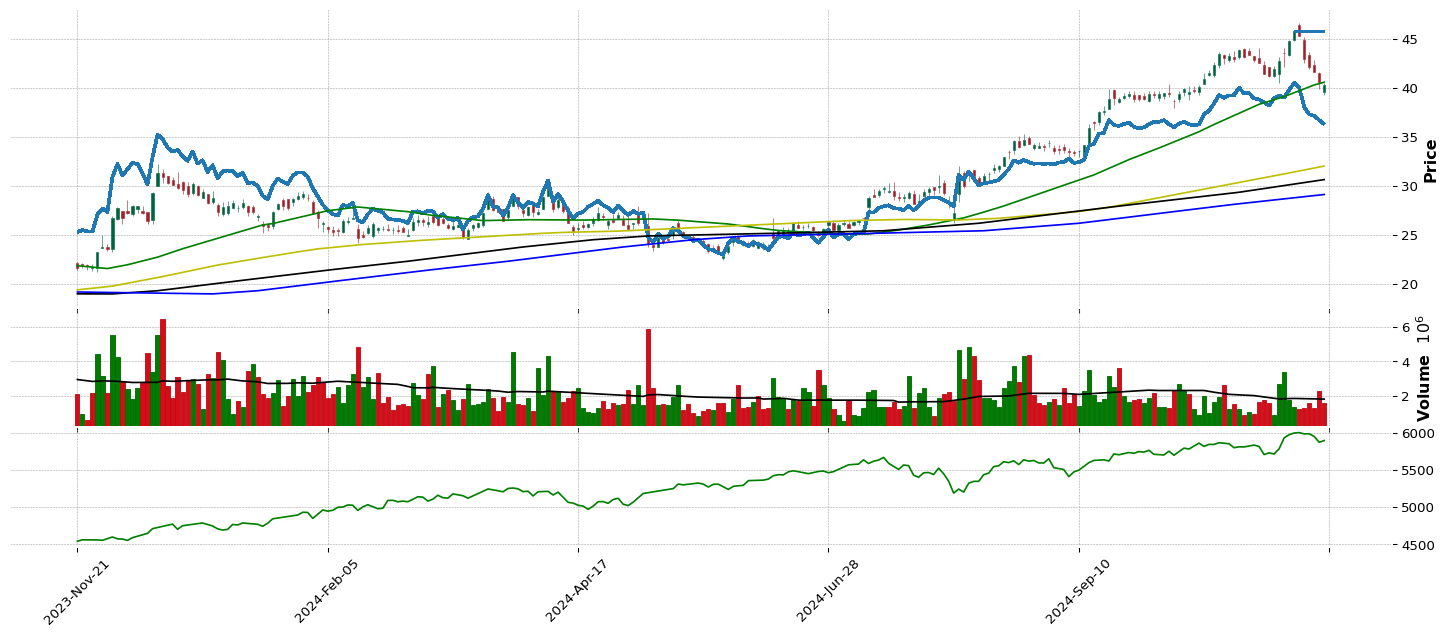
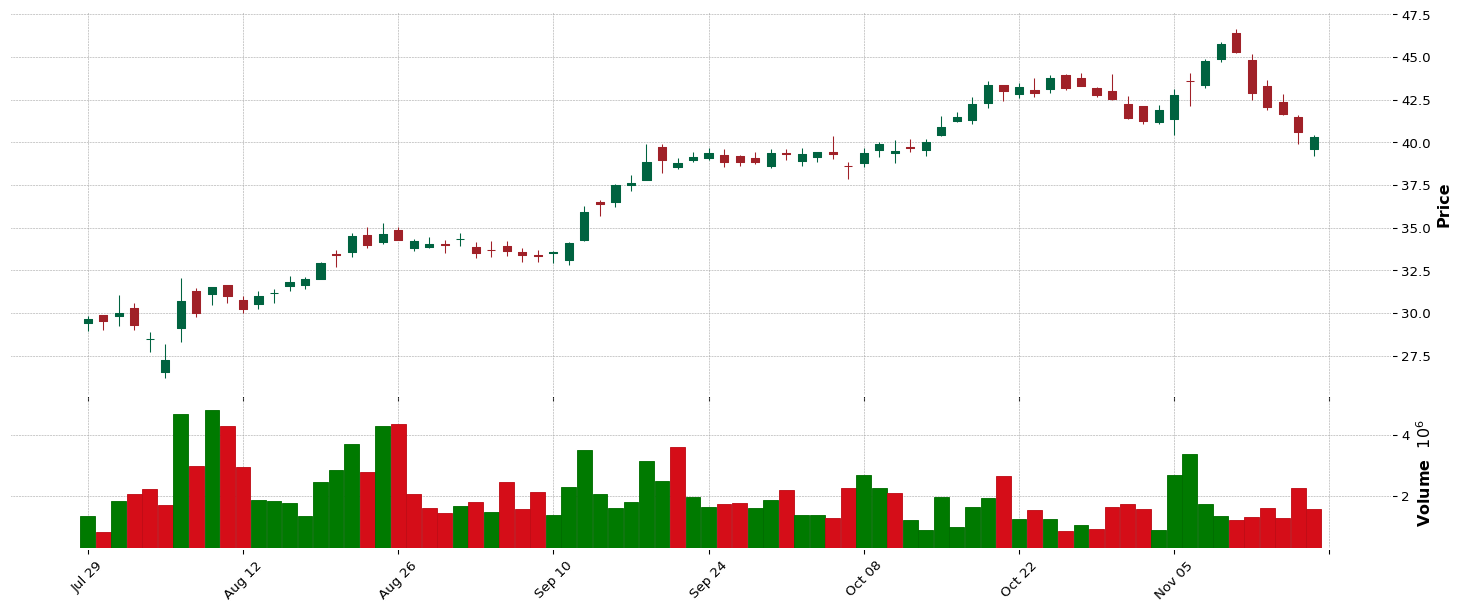
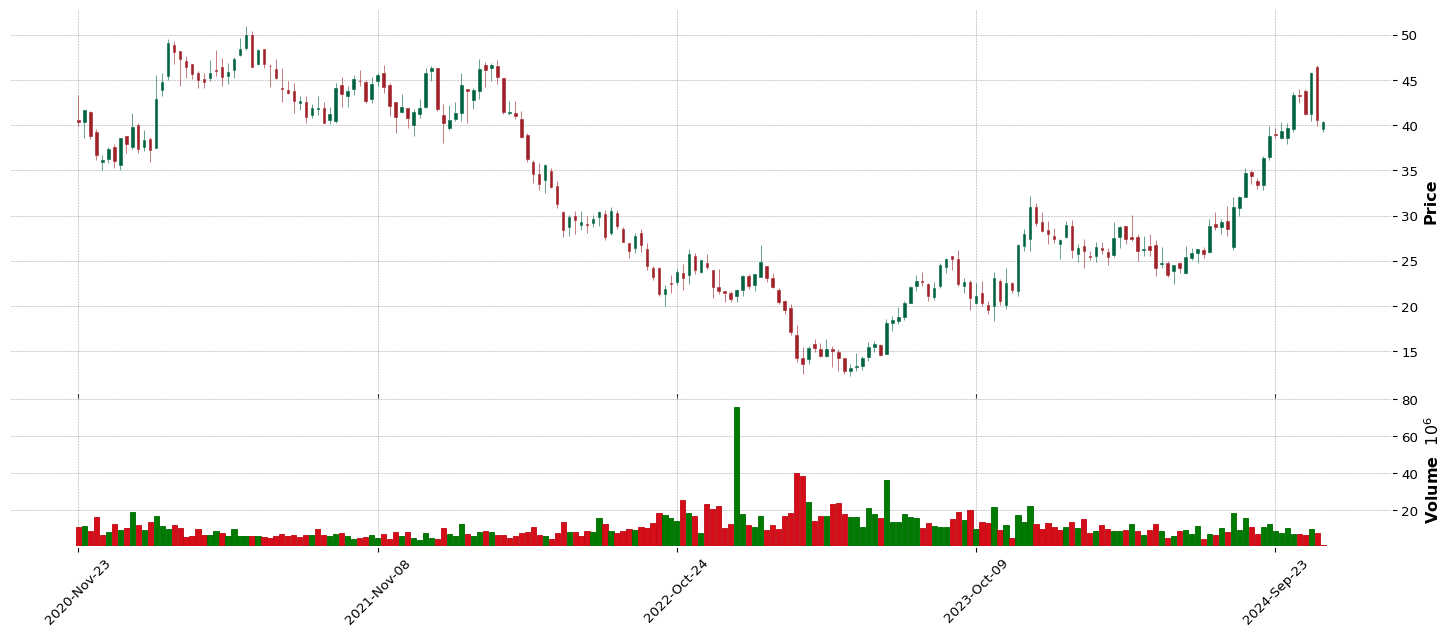
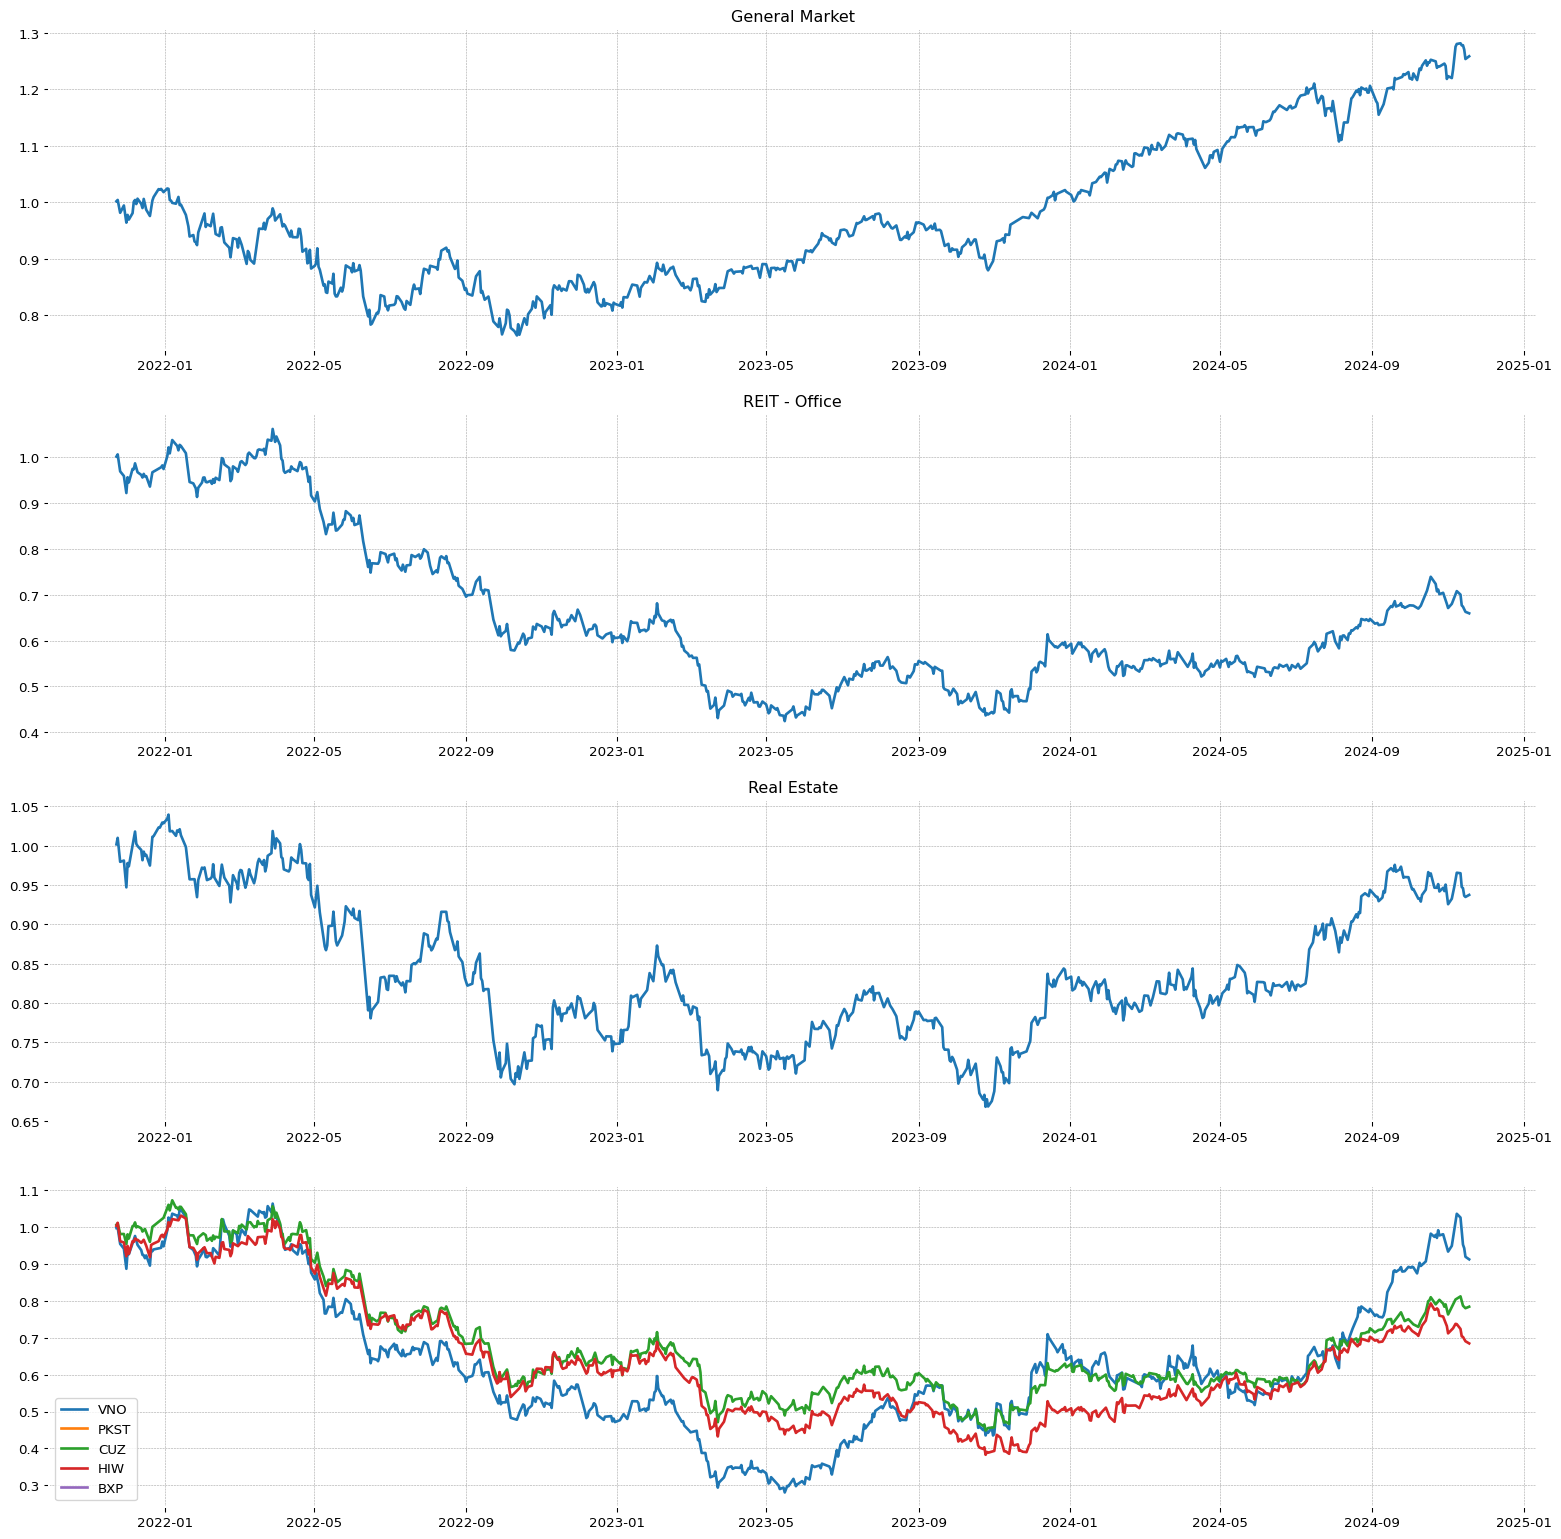 CVNA
CVNA
**** TECNICO ****
CVNA
| Total stock number: | 113.56M |
| Namee: | Carvana Co. |
| IPO date: | 2017-04-28 |
| SMR | EPS | RS |
76.45 | 77.54 | 99 |
| Sector | Sector Position |
| Consumer Cyclical | 6/11 |
| Industry | Industry Position - | Stock on industry - | RSI Sector: |
| Auto & Truck Dealerships | 34/147 | 1/20 | 6/351 |
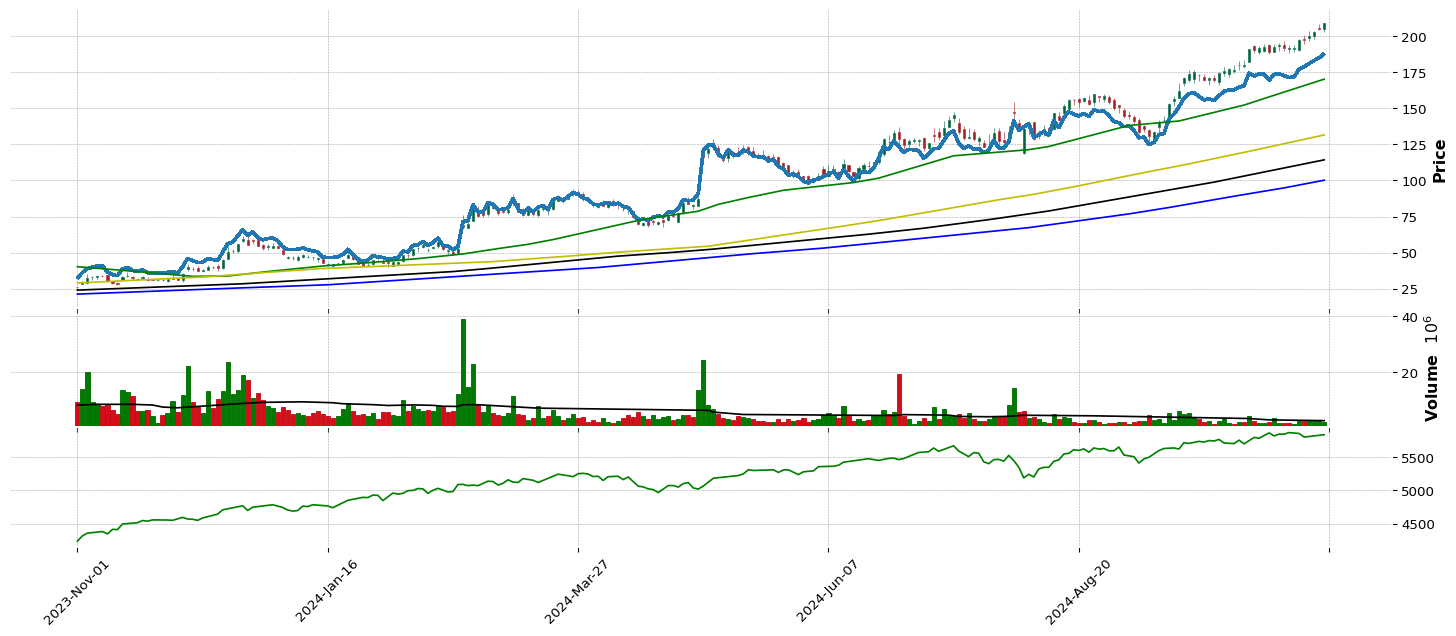
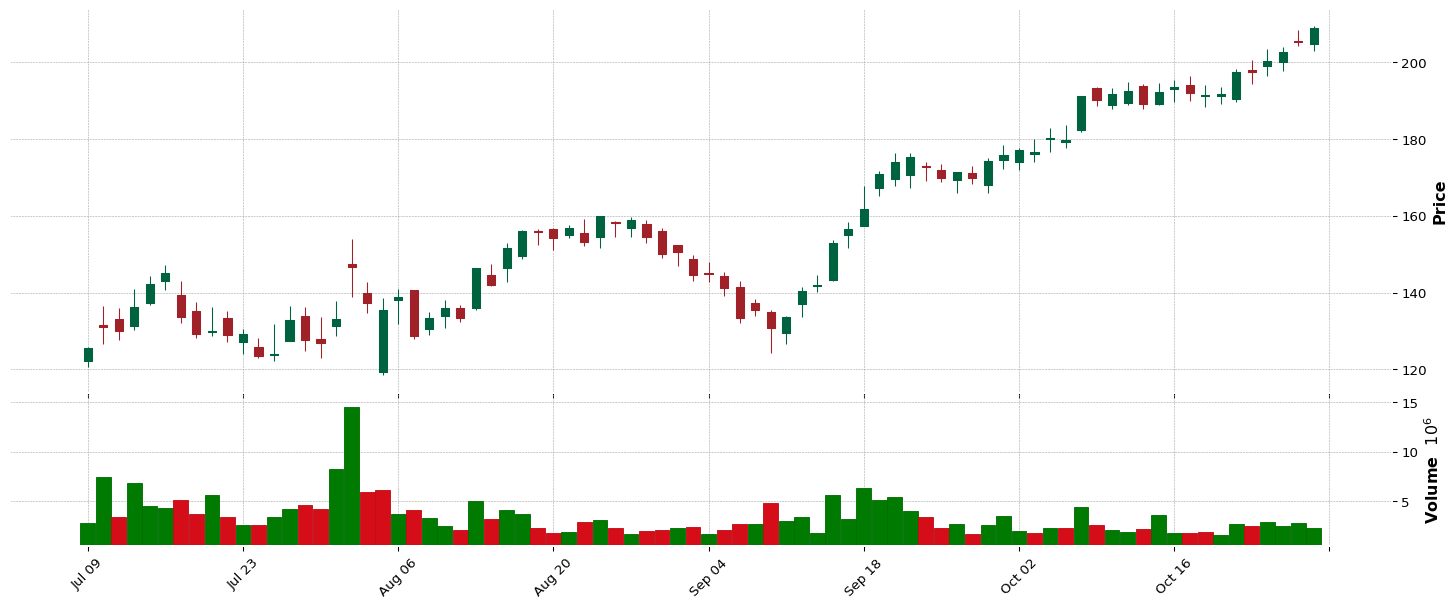
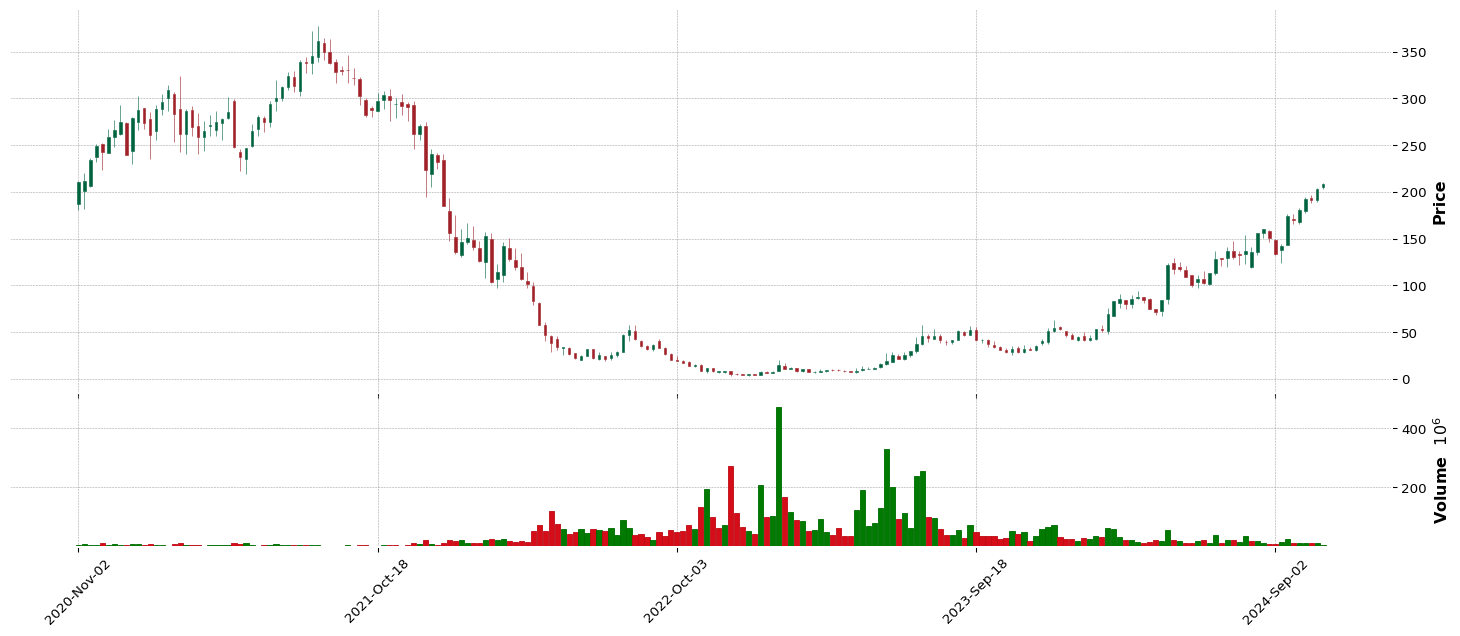
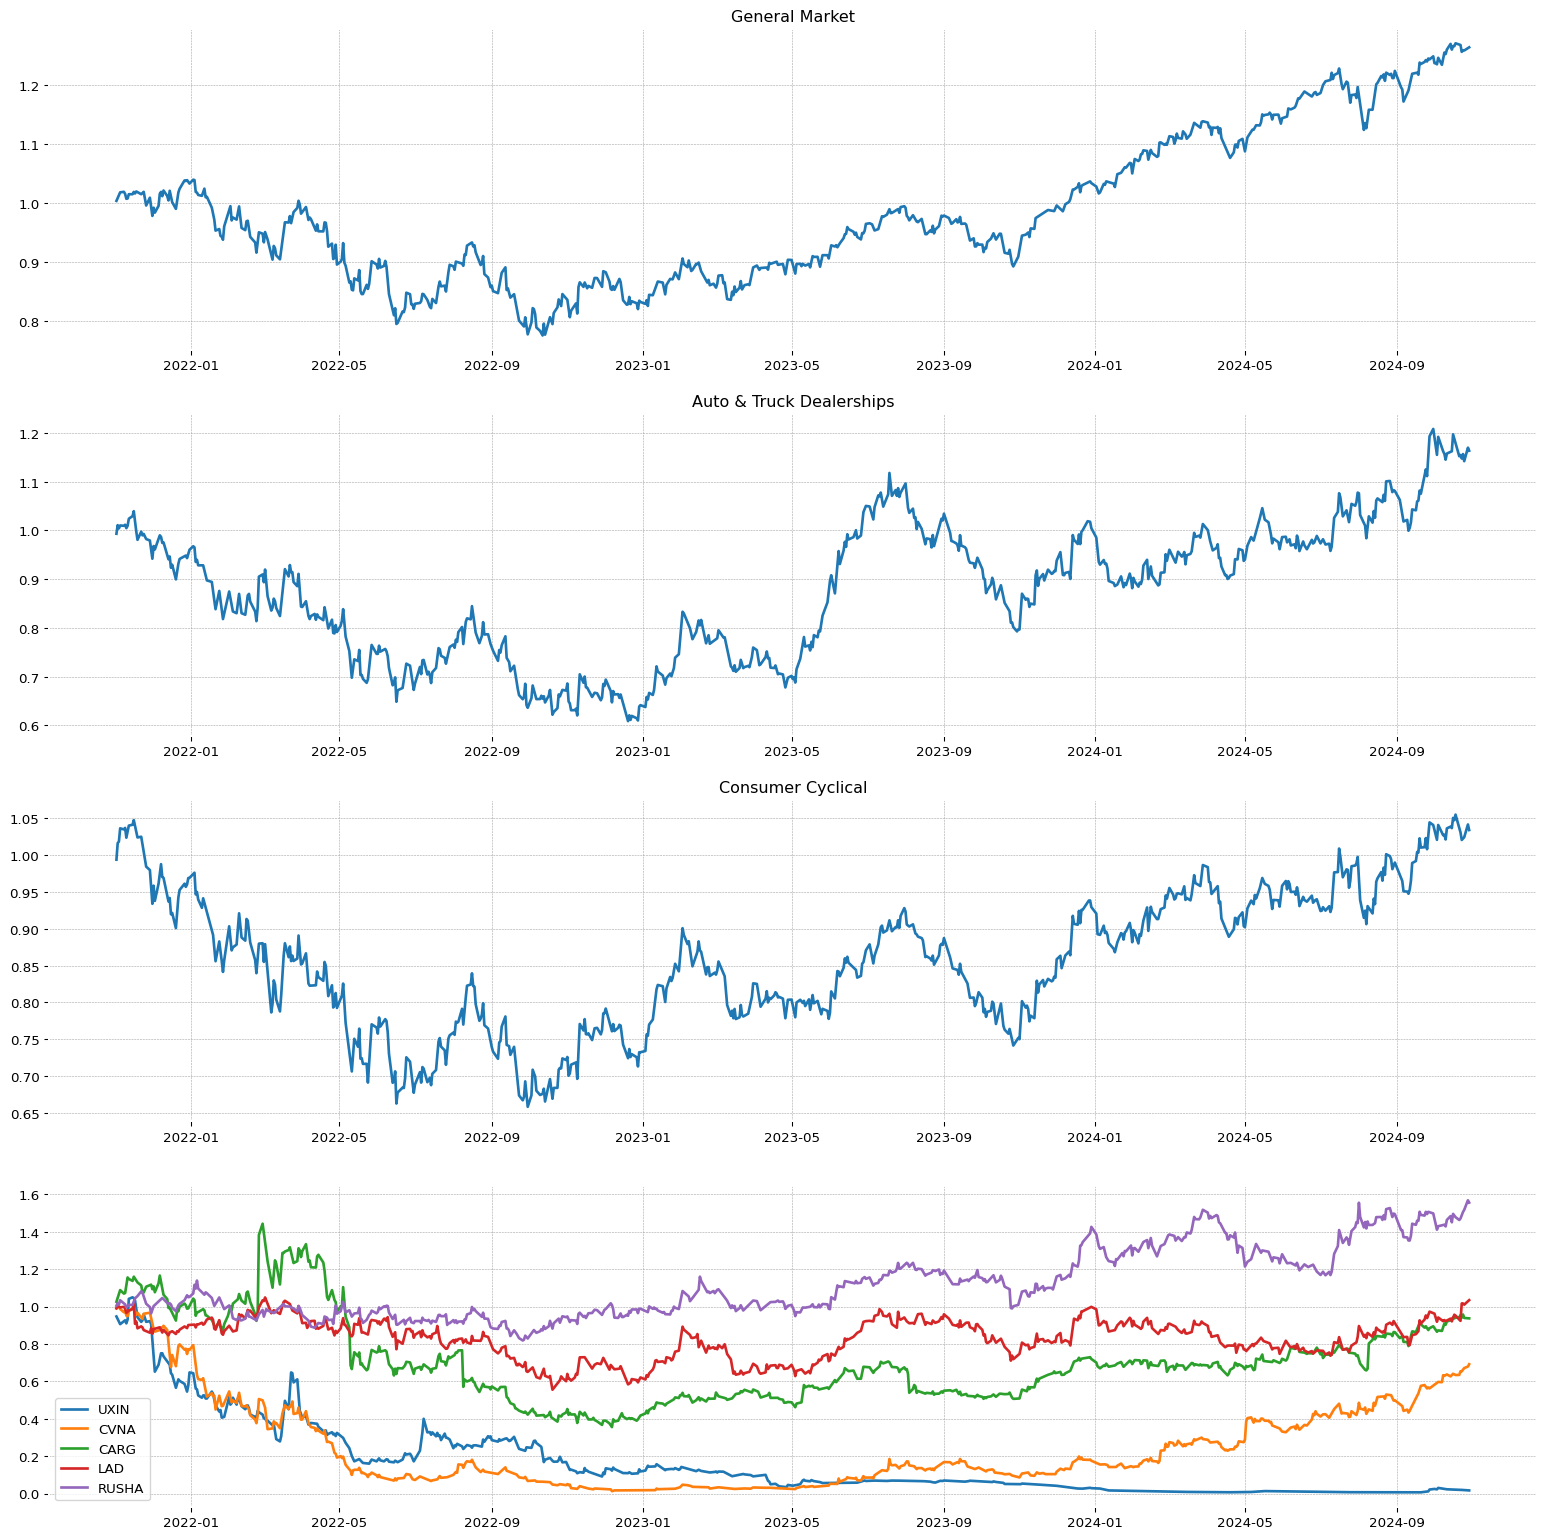 CRDO
CRDO
**** TECNICO ****
CRDO
| Total stock number: | 142.5M |
| Namee: | Credo Technology Group Holding Ltd |
| IPO date: | 2022-01-27 |
| SMR | EPS | RS |
59.67 | 45.37 | 96 |
| Sector | Sector Position |
| Technology | 2/11 |
| Industry | Industry Position - | Stock on industry - | RSI Sector: |
| Semiconductors | 79/147 | 3/47 | 11/445 |
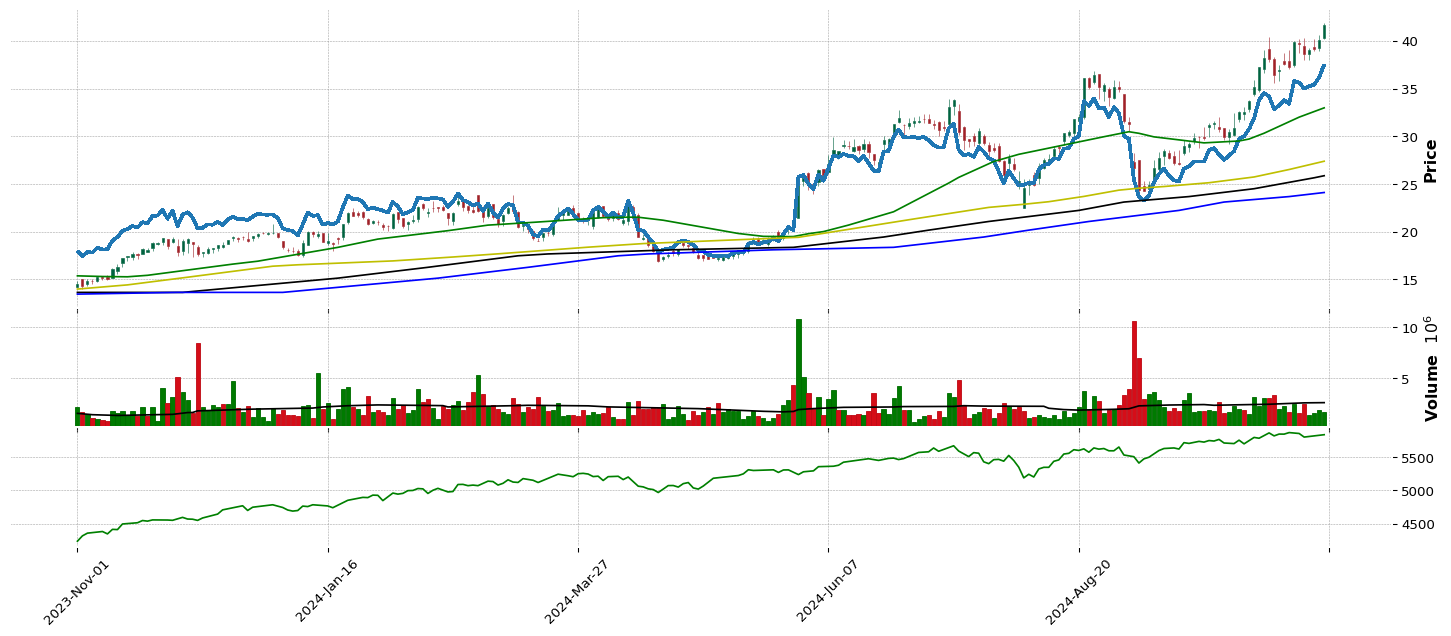
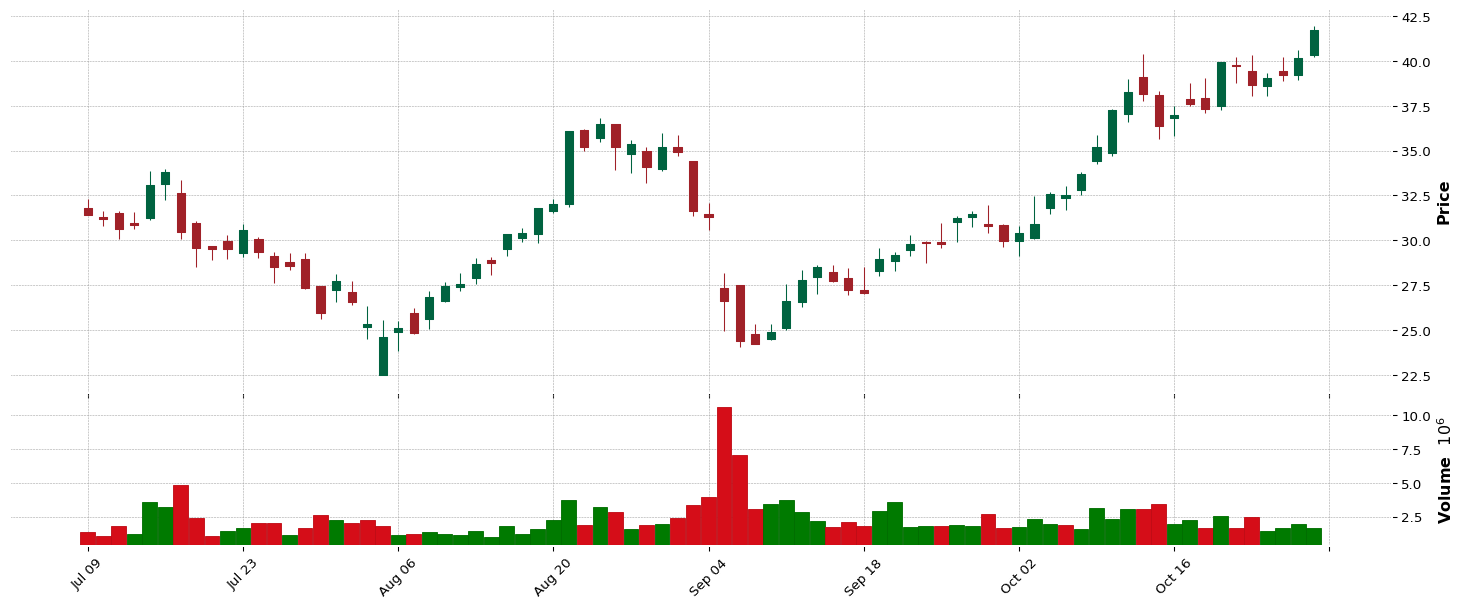
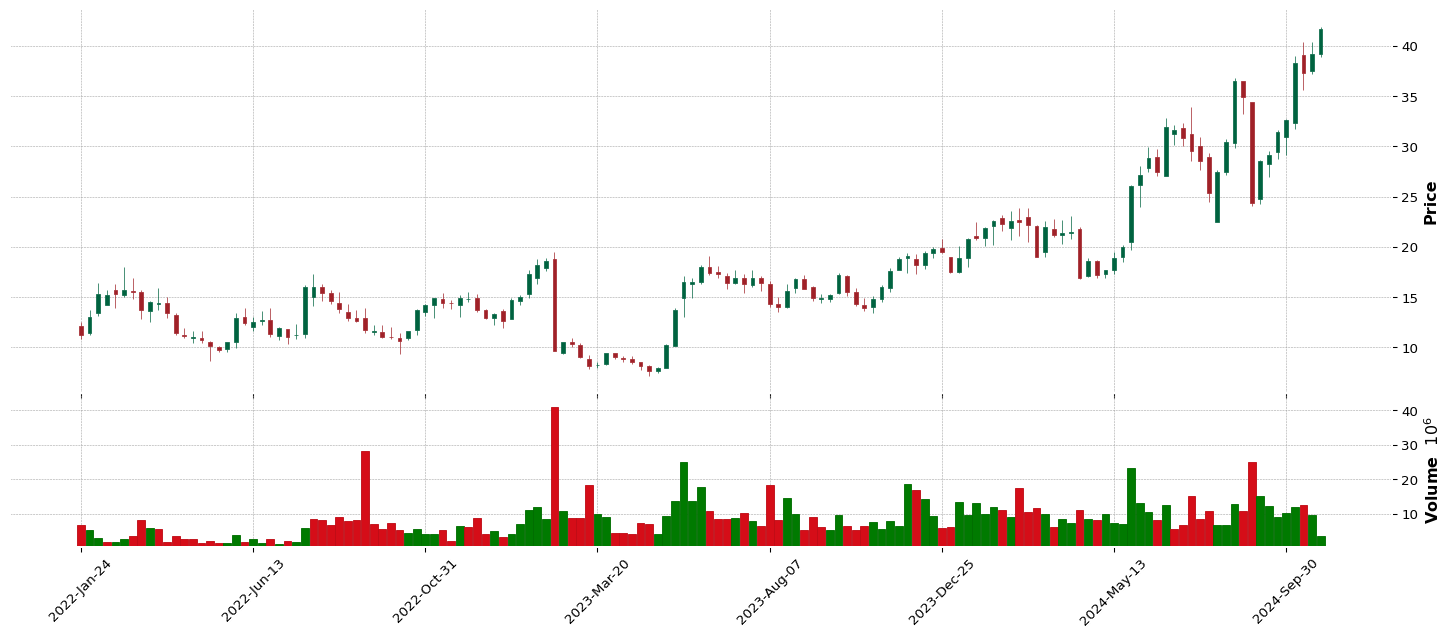
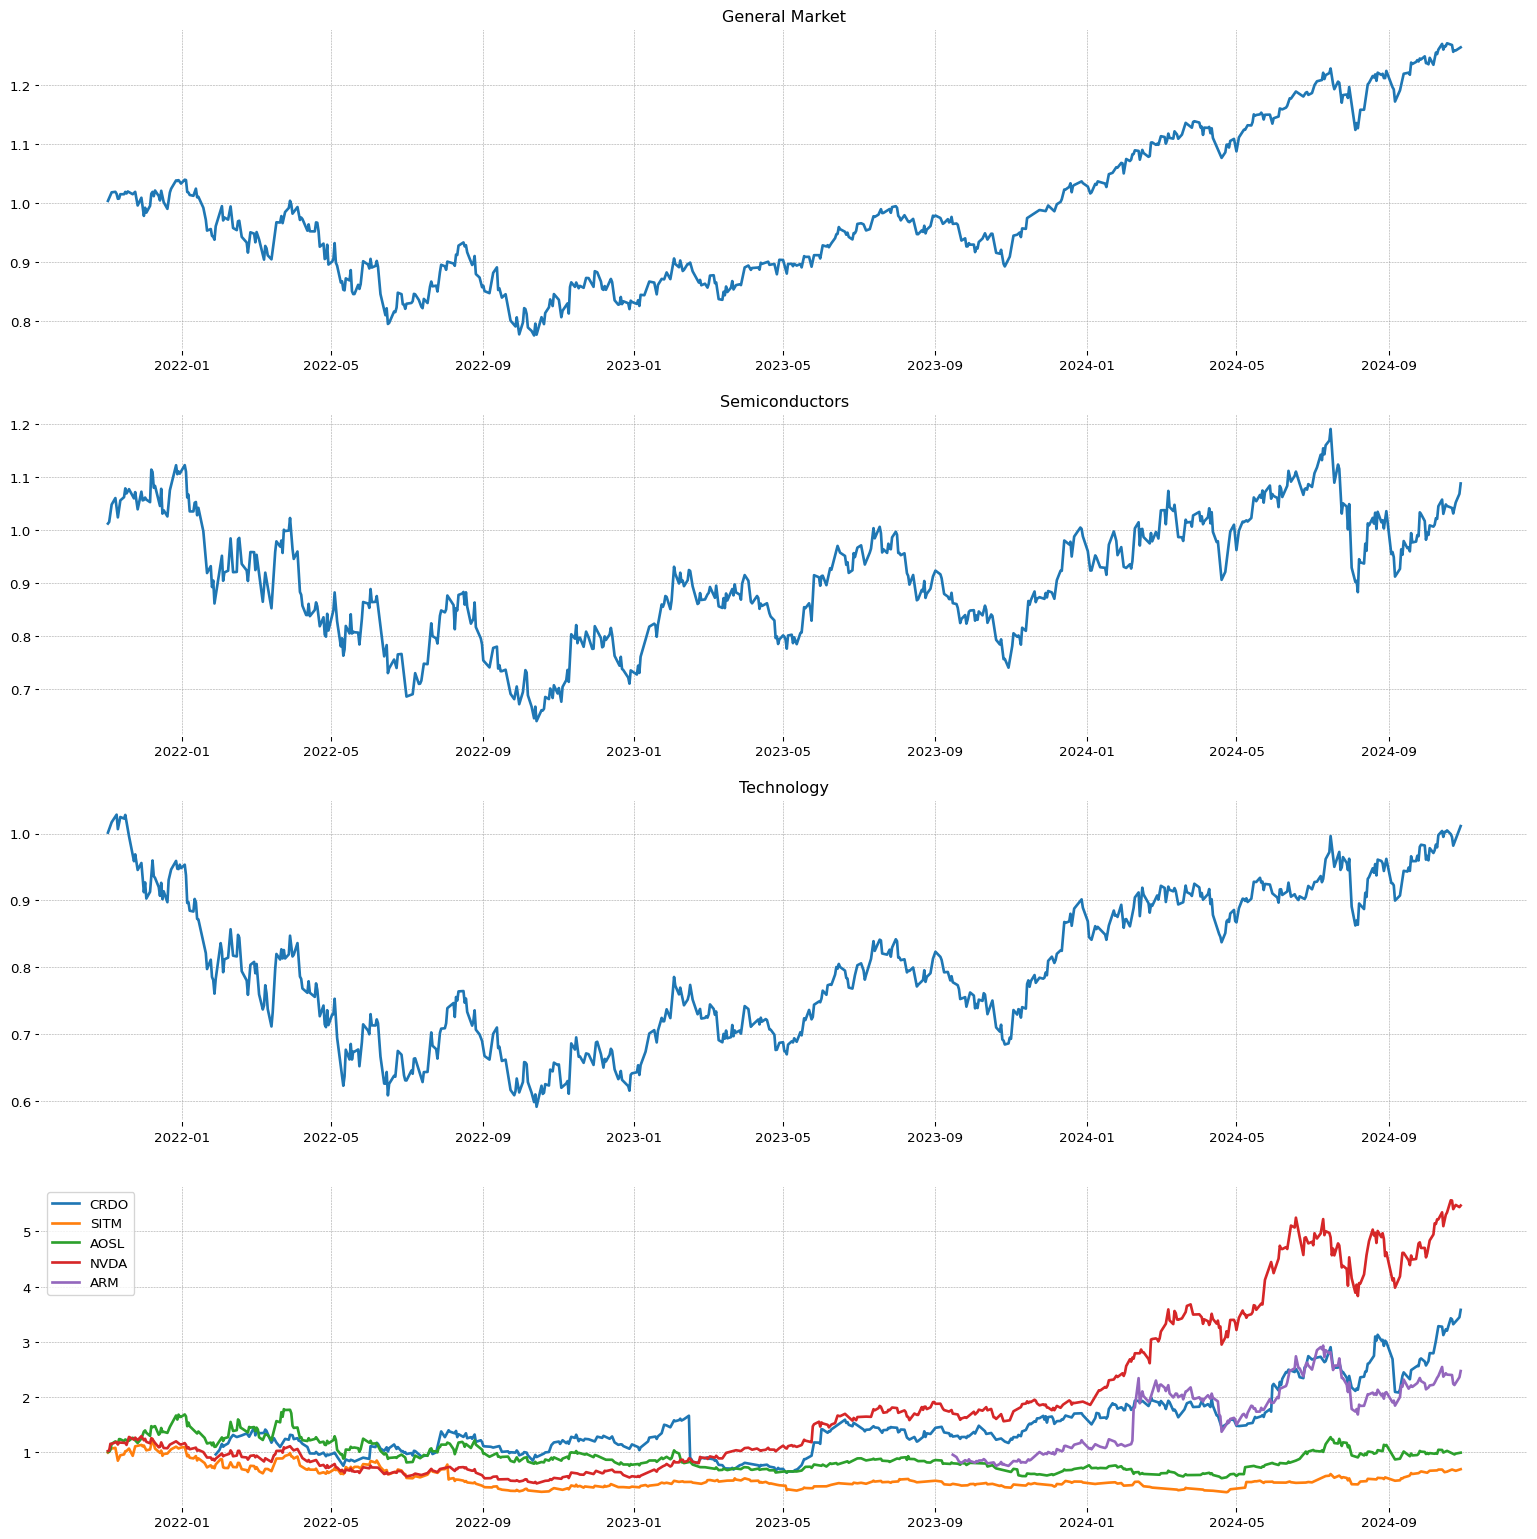 LBPH
LBPH
**** TECNICO ****
LBPH
| Total stock number: | 24.87M |
| Namee: | Longboard Pharmaceuticals, Inc. |
| IPO date: | 2021-03-12 |
| Sector | Sector Position |
| Healthcare | 1/11 |
| Industry | Industry Position - | Stock on industry - | RSI Sector: |
| Biotechnology | 19/147 | 16/232 | 15/487 |
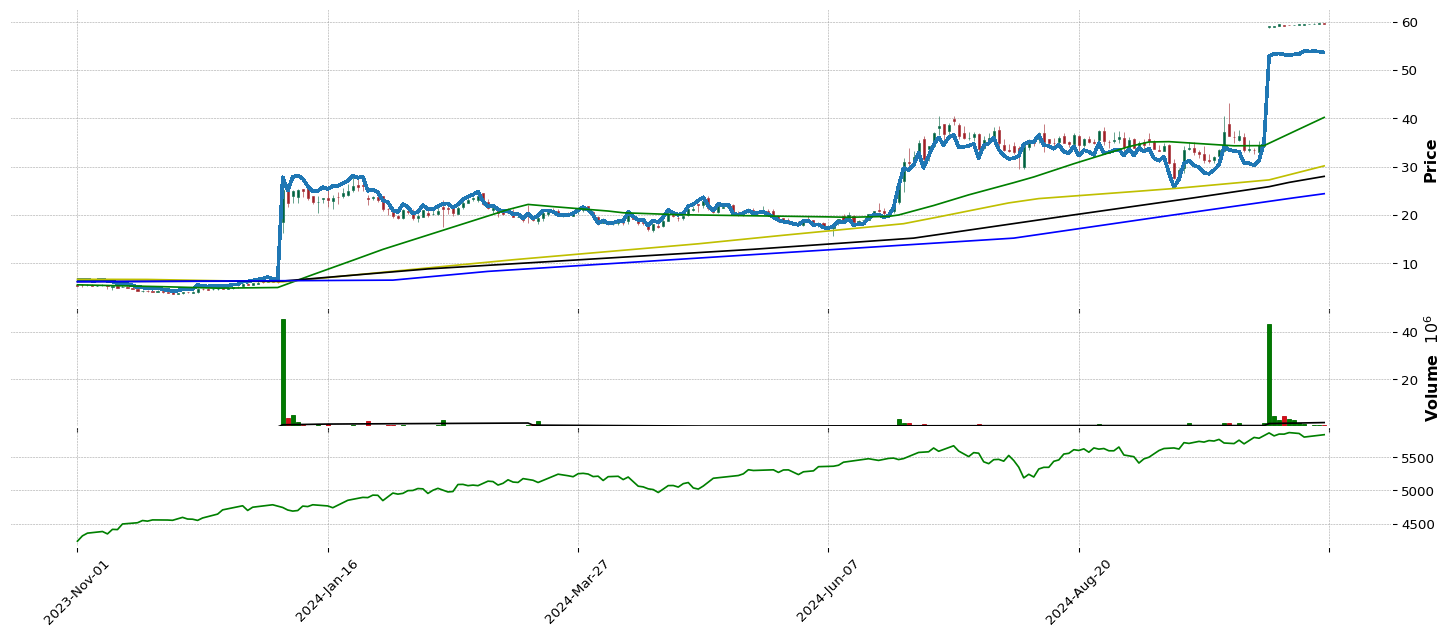
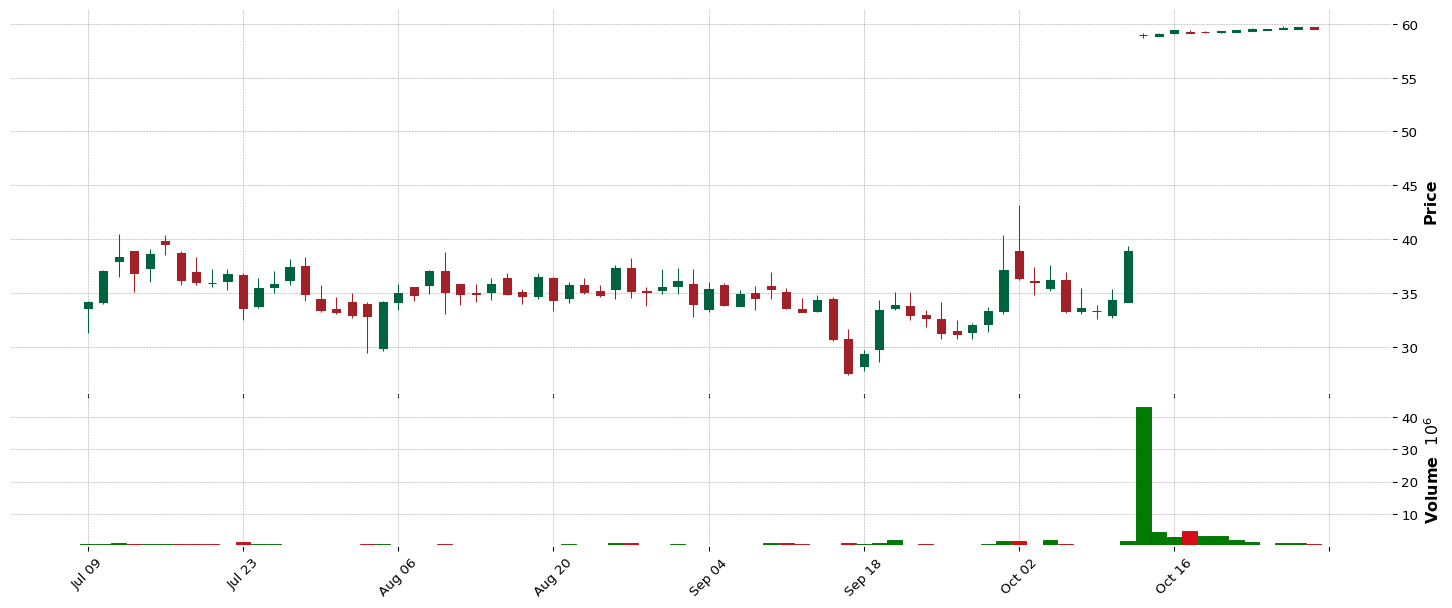
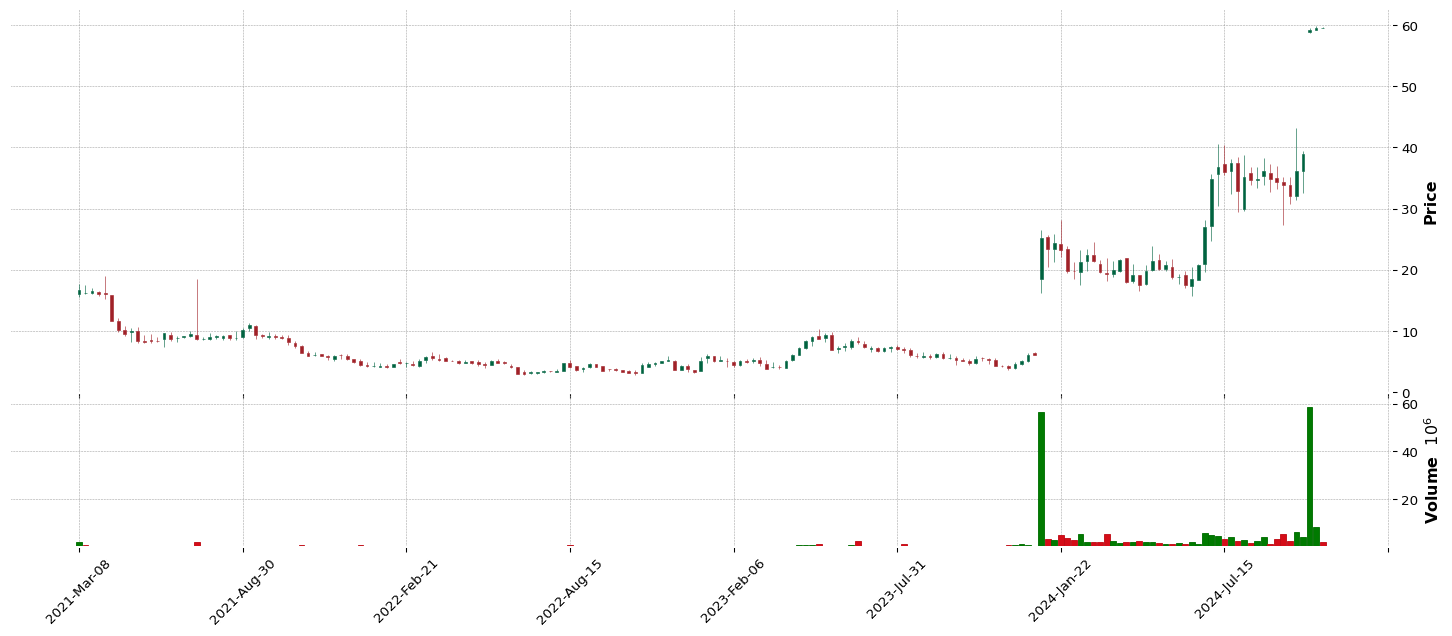
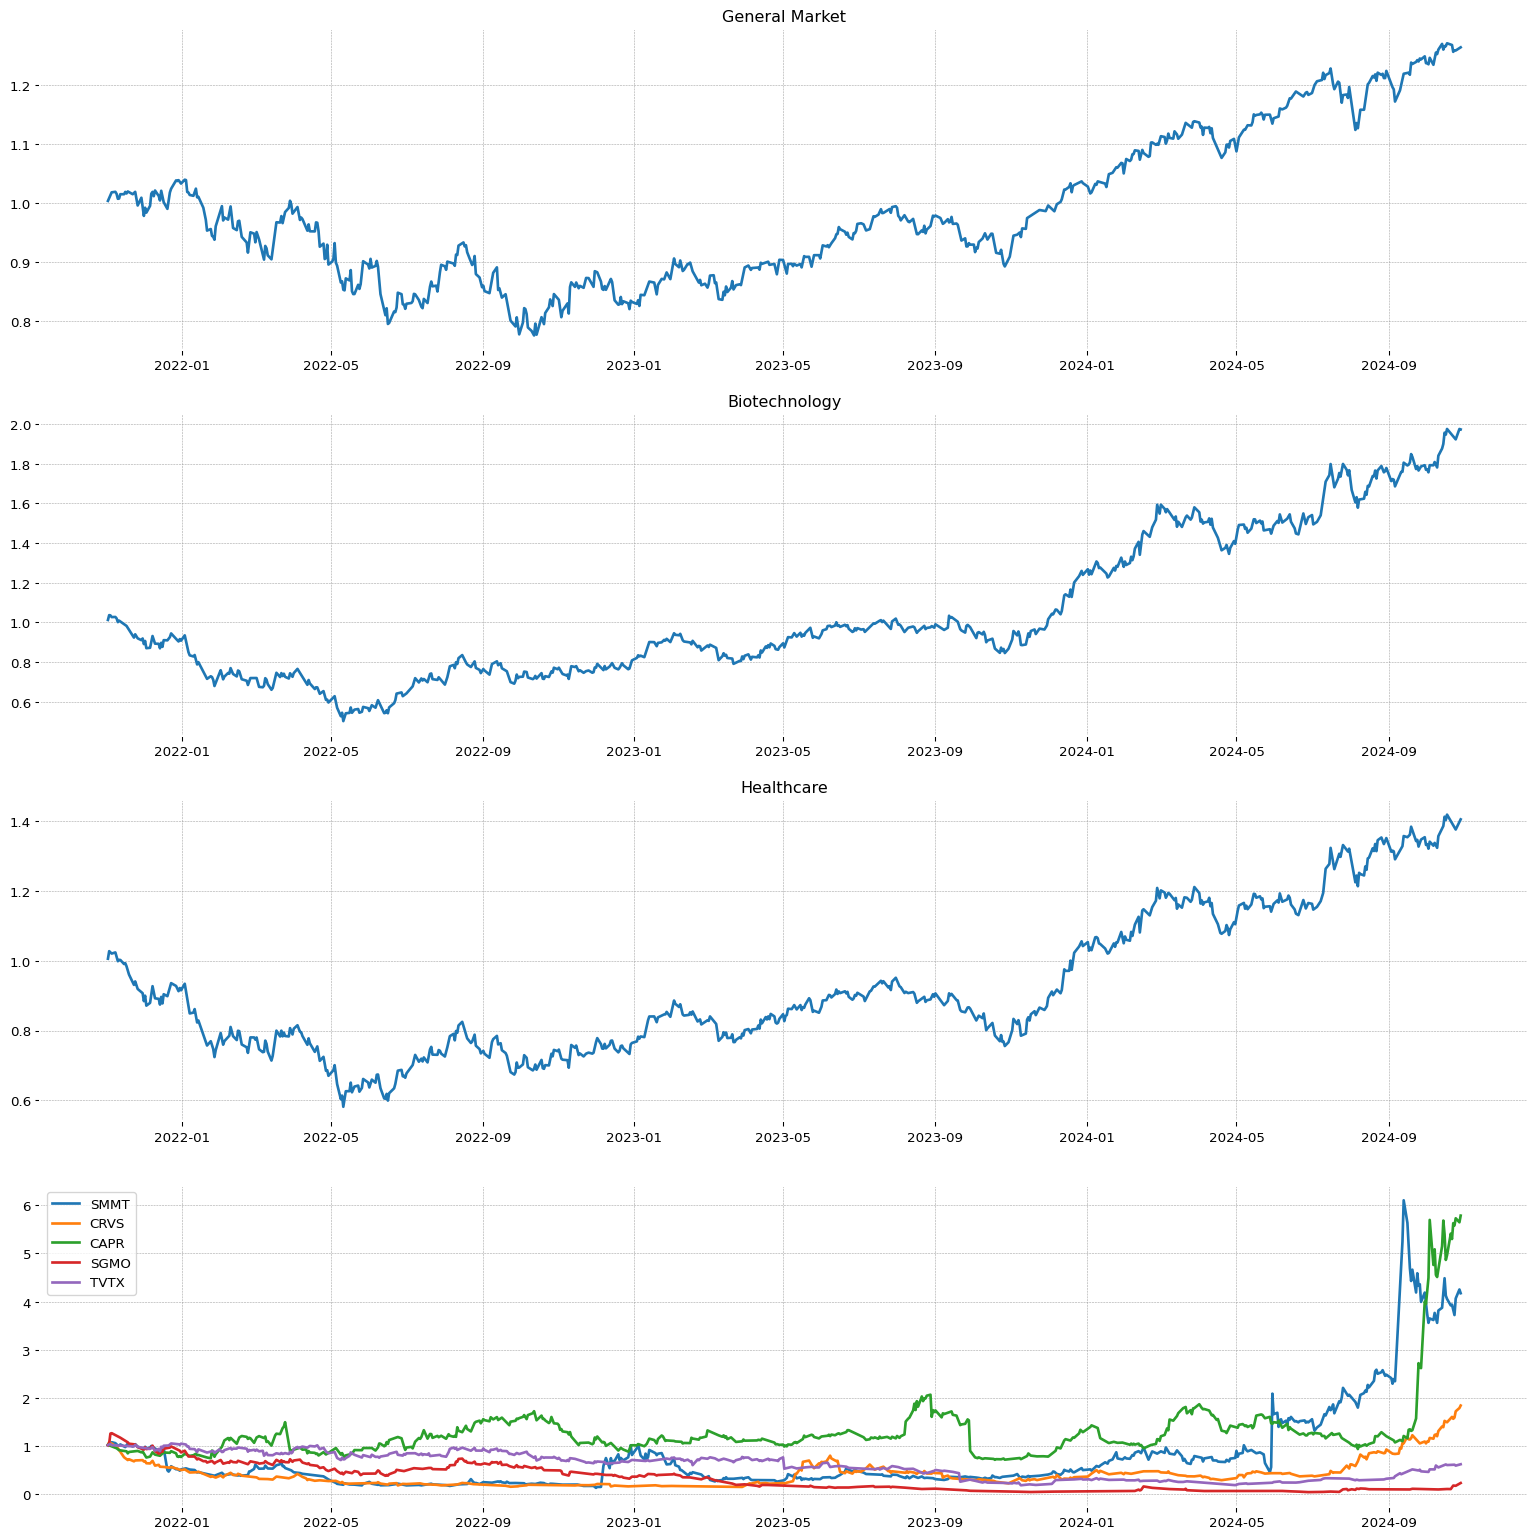 WGS
WGS
**** TECNICO ****
WGS
| Total stock number: | 17.81M |
| Namee: | GeneDx Holdings Corp. |
| IPO date: | 2020-11-04 |
| SMR | EPS | RS |
96.88 | 97.33 | 100 |
| Sector | Sector Position |
| Healthcare | 1/11 |
| Industry | Industry Position - | Stock on industry - | RSI Sector: |
| Health Information Services | 111/147 | 1/30 | 17/487 |
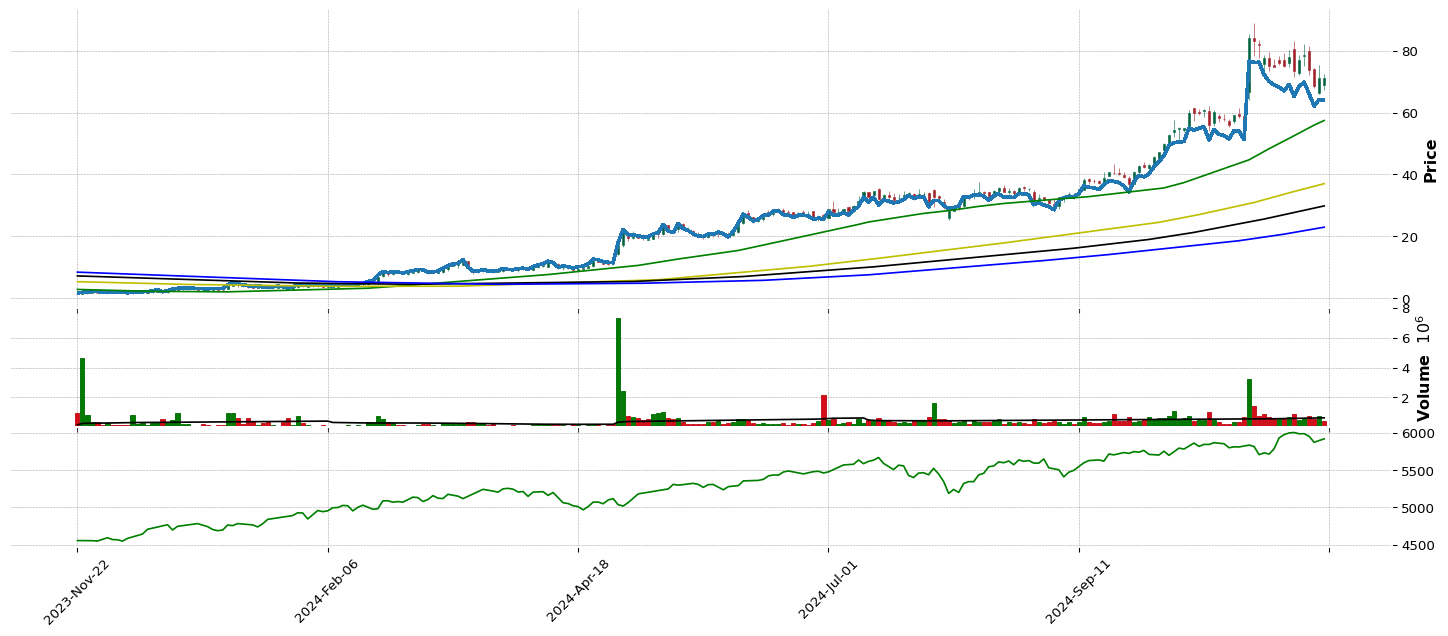
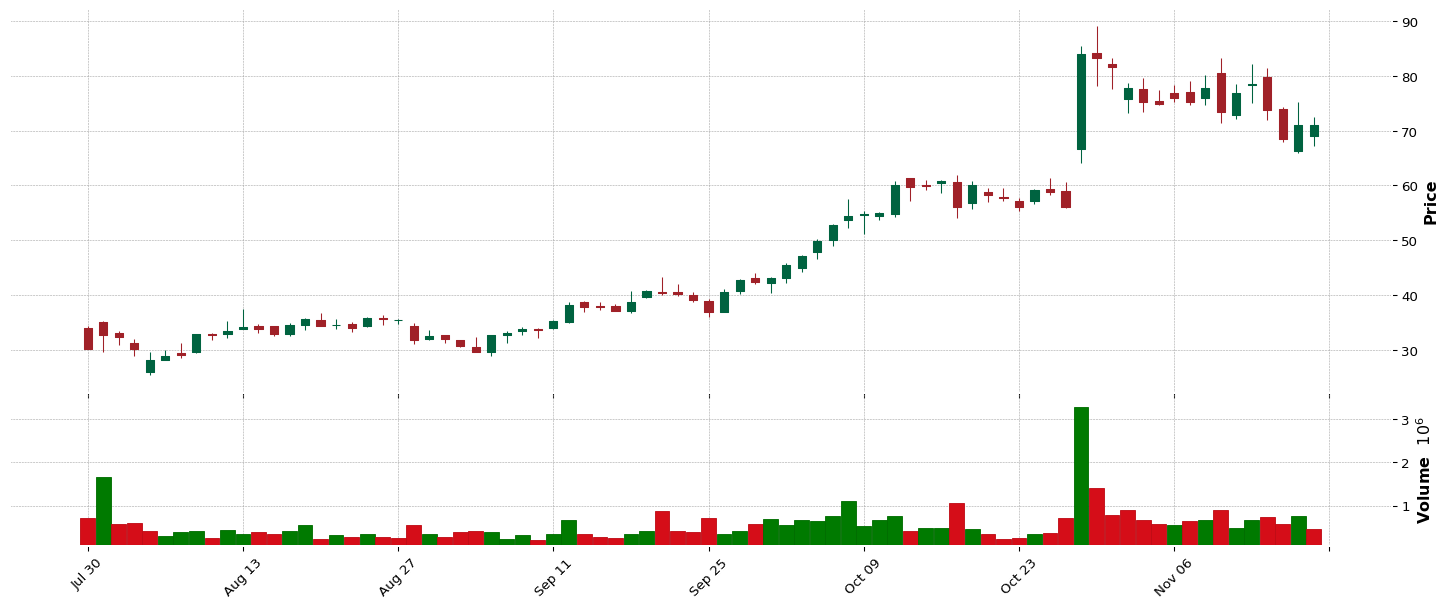
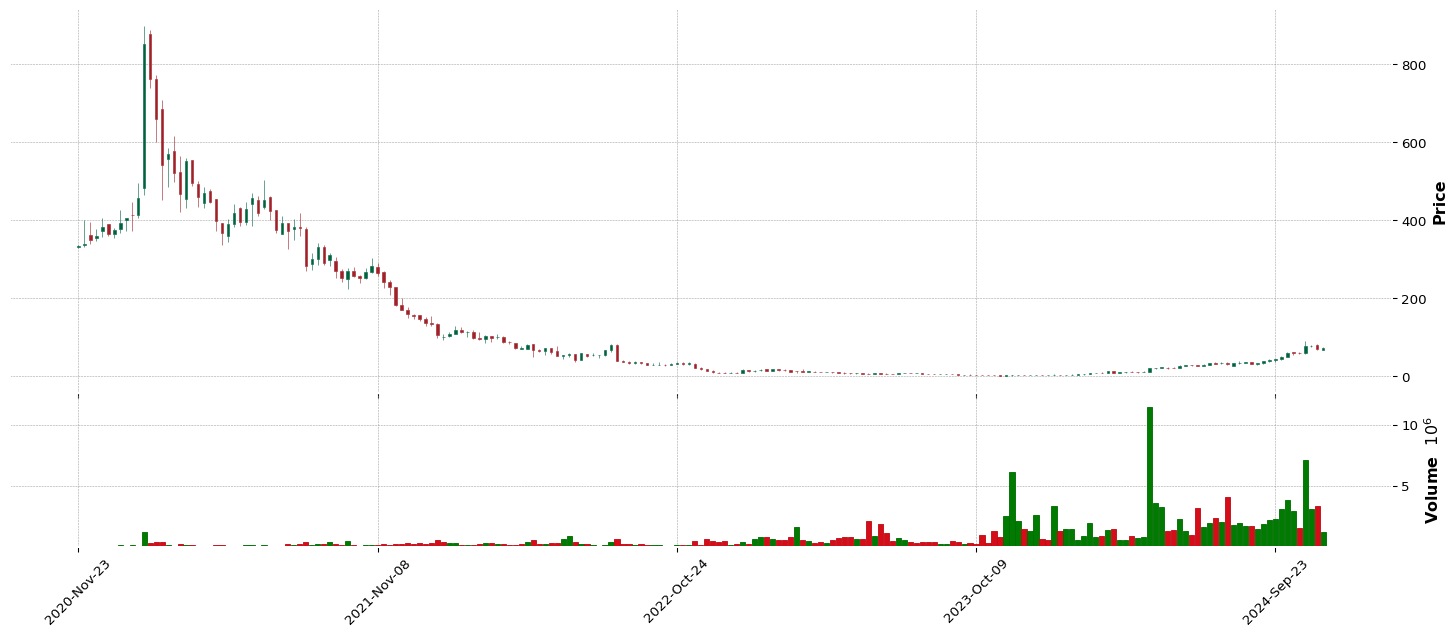
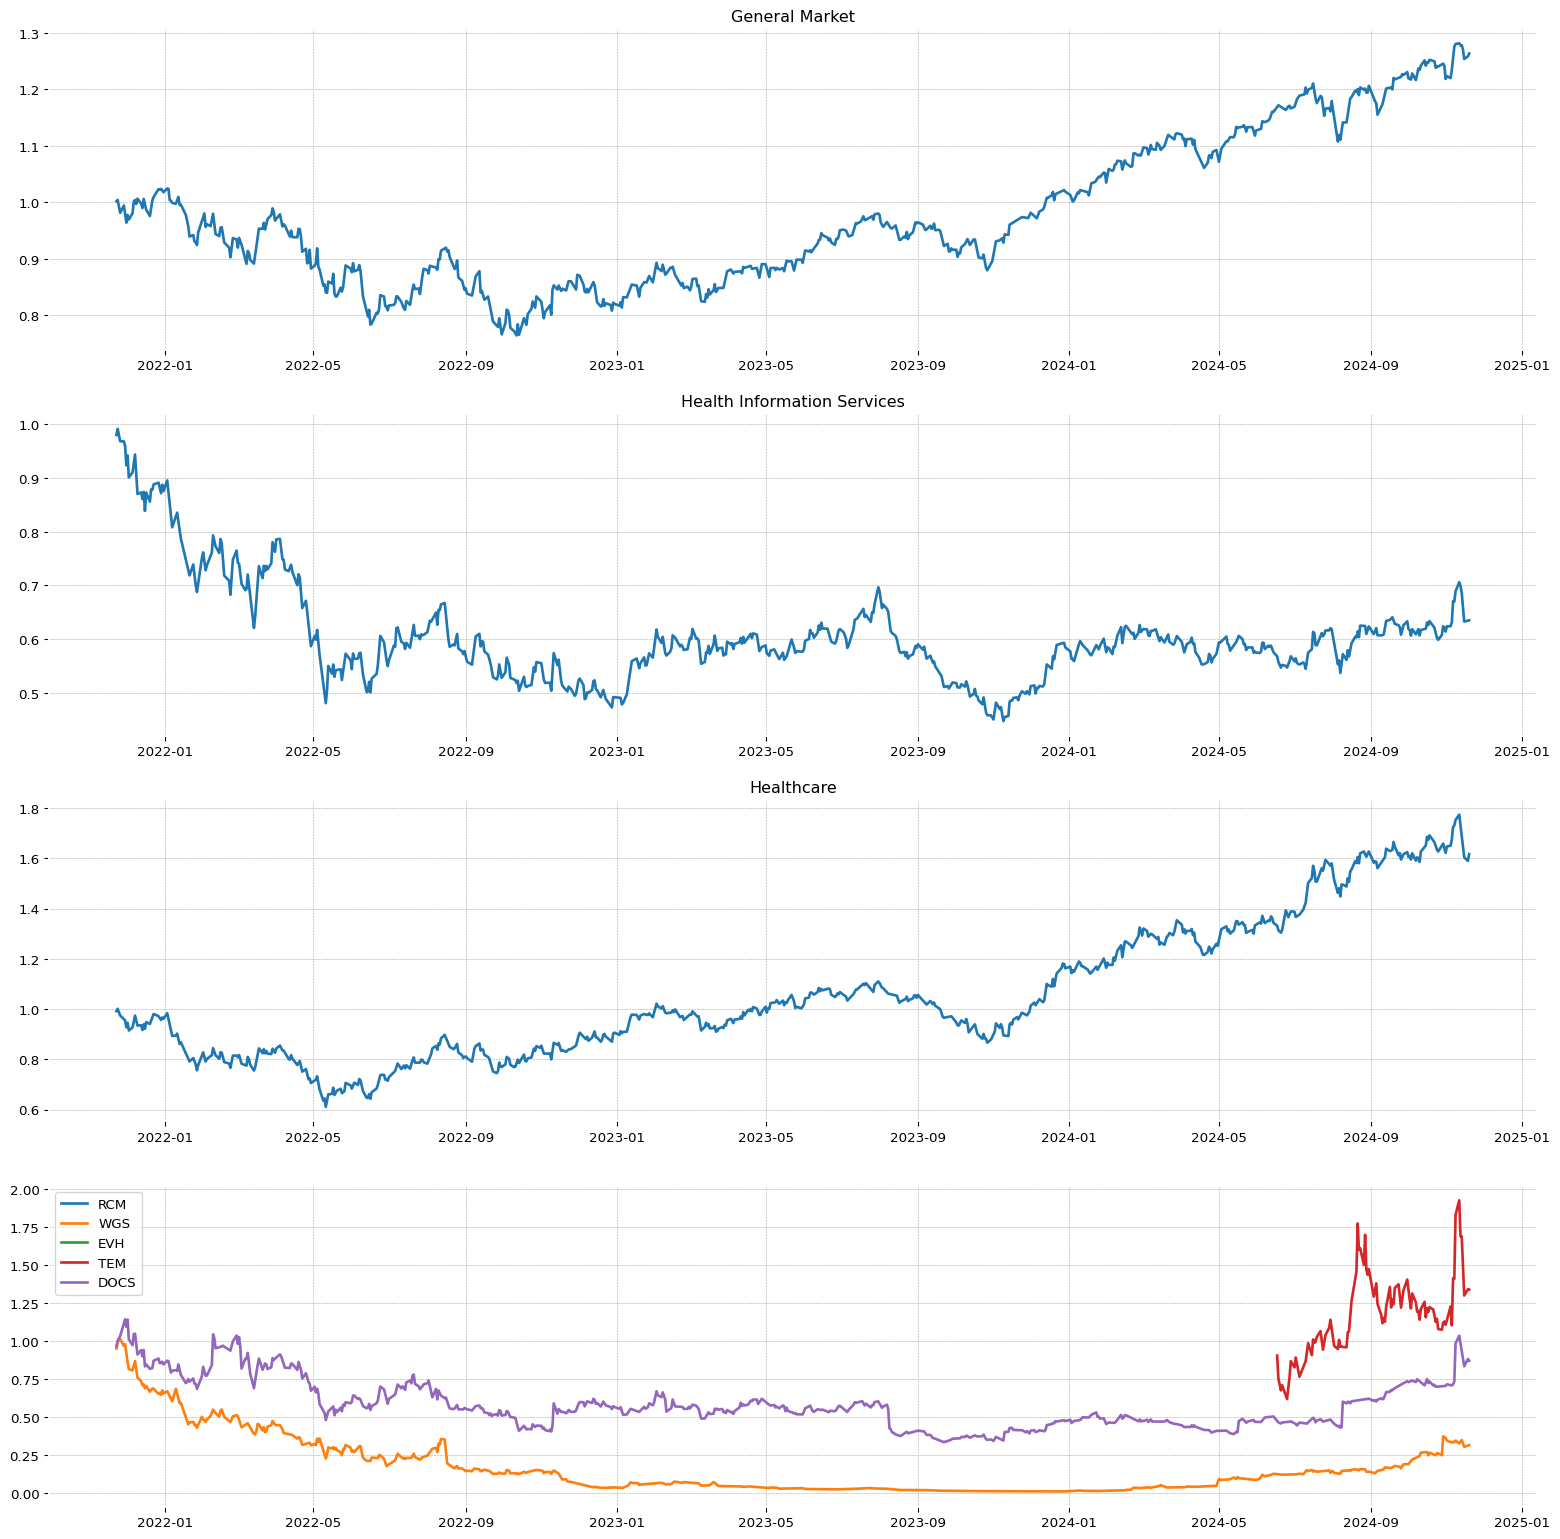 CMPO
CMPO
**** TECNICO ****
CMPO
| Total stock number: | 7.81M |
| Namee: | CompoSecure, Inc. |
| IPO date: | 2020-11-19 |
| SMR | EPS | RS |
26.72 | 48.65 | 94 |
| Sector | Sector Position |
| Industrials | 7/11 |
| Industry | Industry Position - | Stock on industry - | RSI Sector: |
| Metal Fabrication | 26/147 | 2/12 | 8/402 |
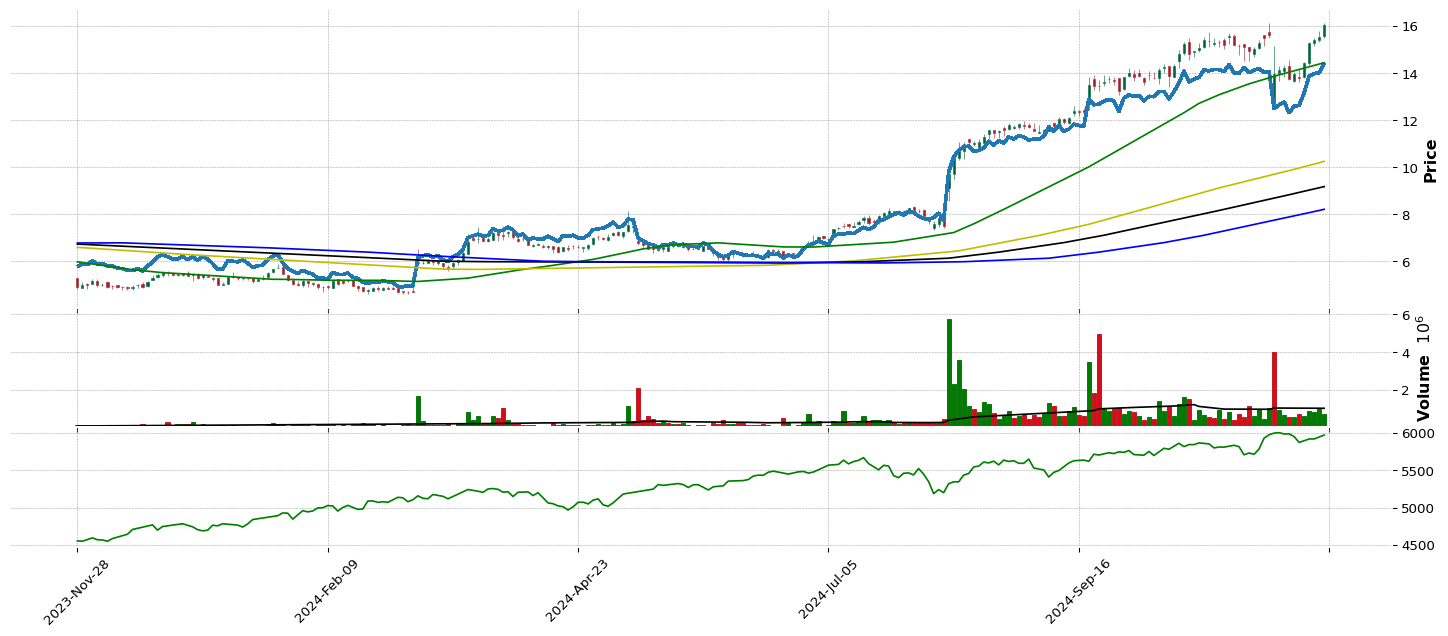
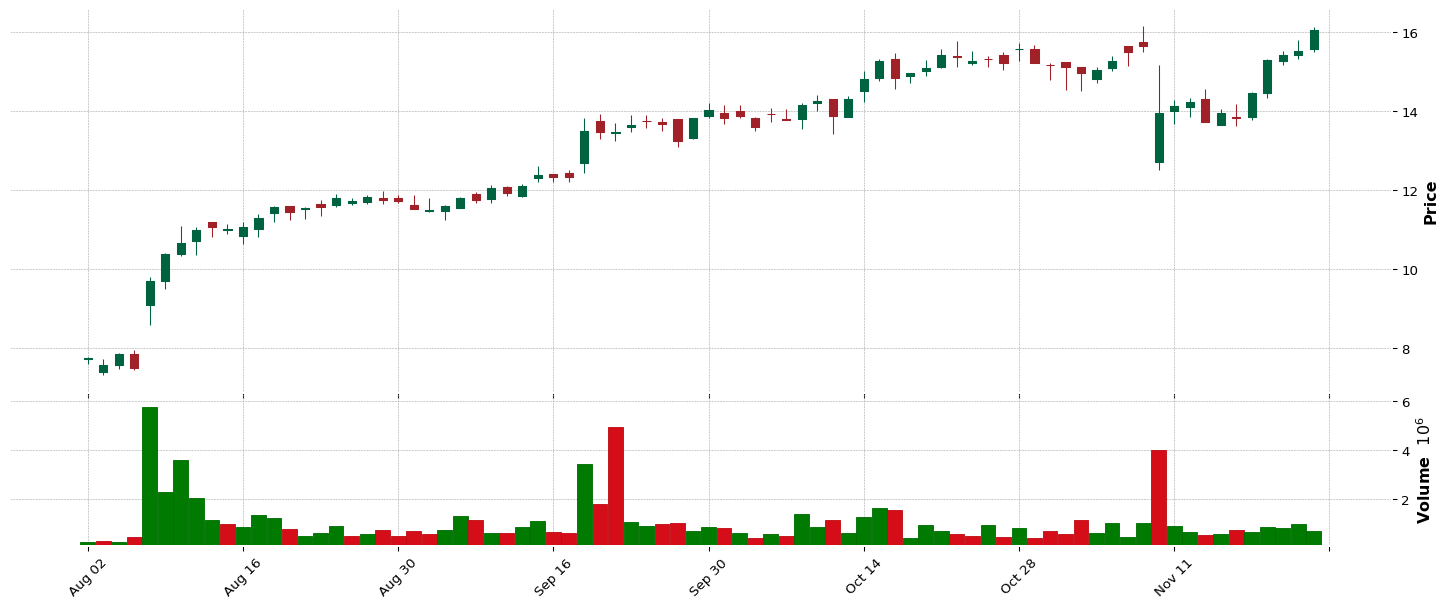
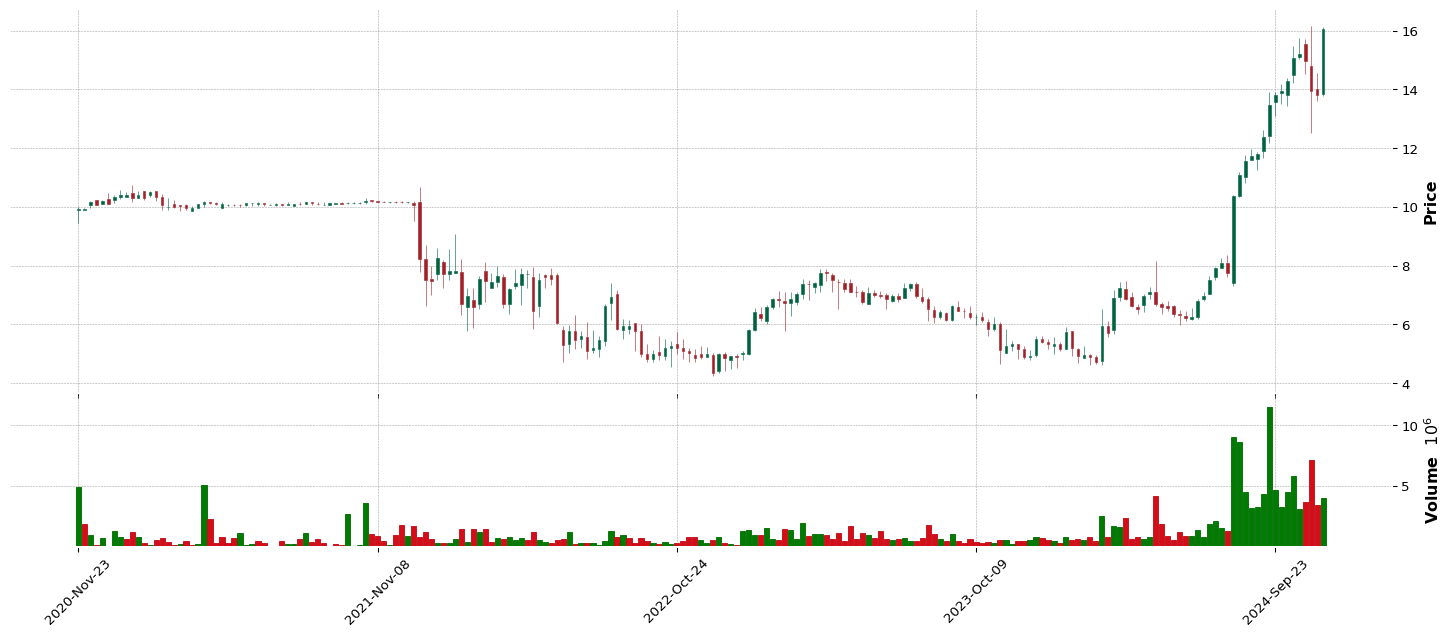
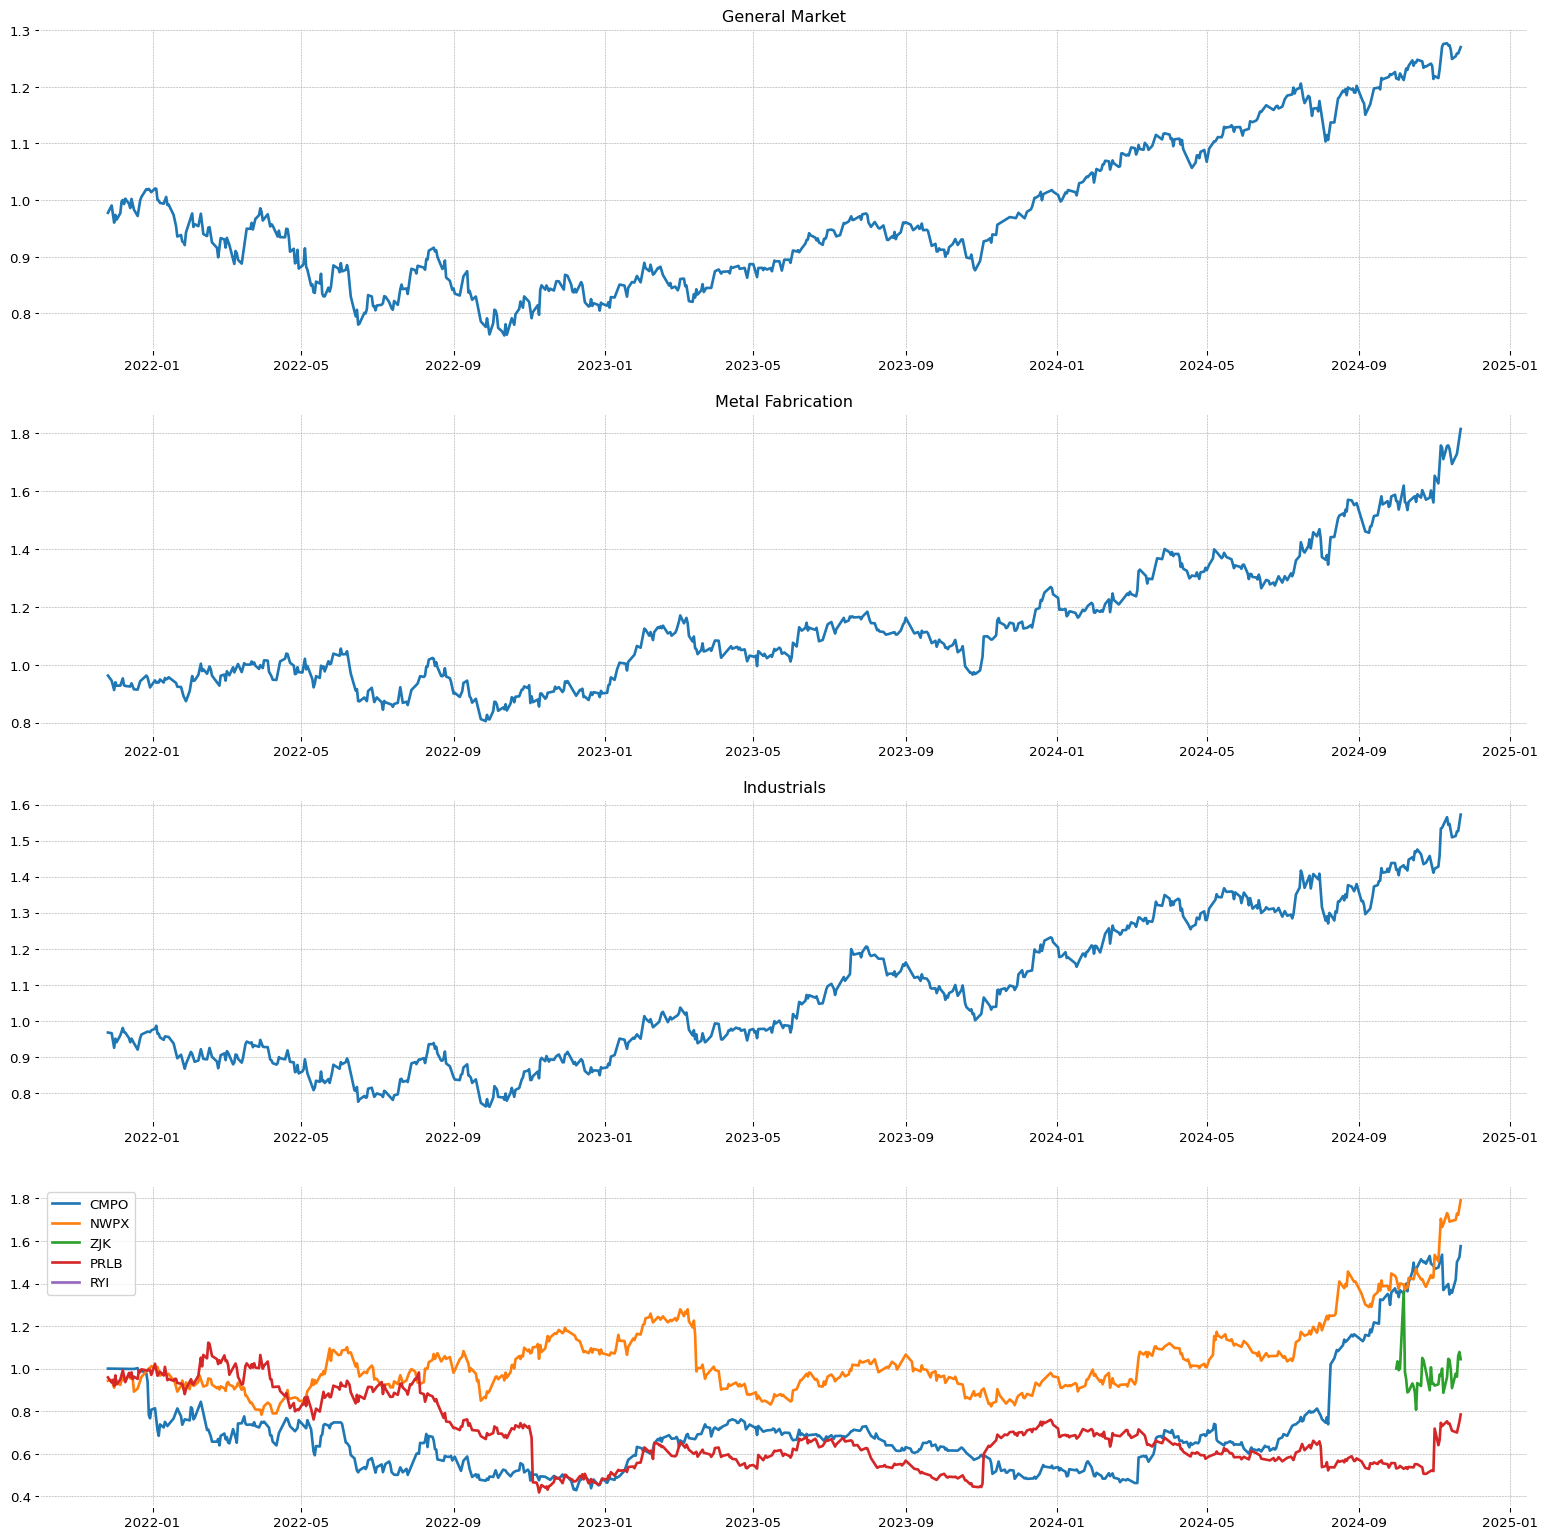 RNA
RNA
**** TECNICO ****
RNA
| Total stock number: | 90.72M |
| Namee: | Avidity Biosciences, Inc. |
| IPO date: | 2020-06-12 |
| Sector | Sector Position |
| Healthcare | 1/11 |
| Industry | Industry Position - | Stock on industry - | RSI Sector: |
| Biotechnology | 19/147 | 5/232 | 45/487 |
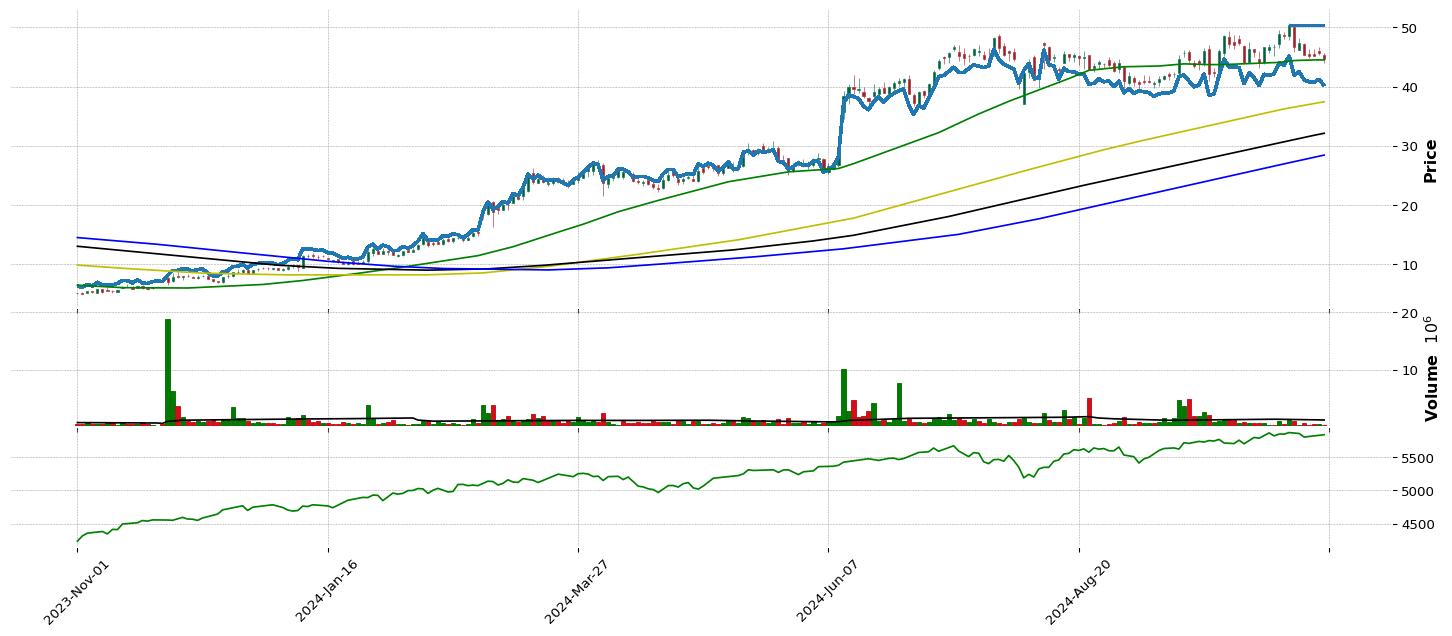
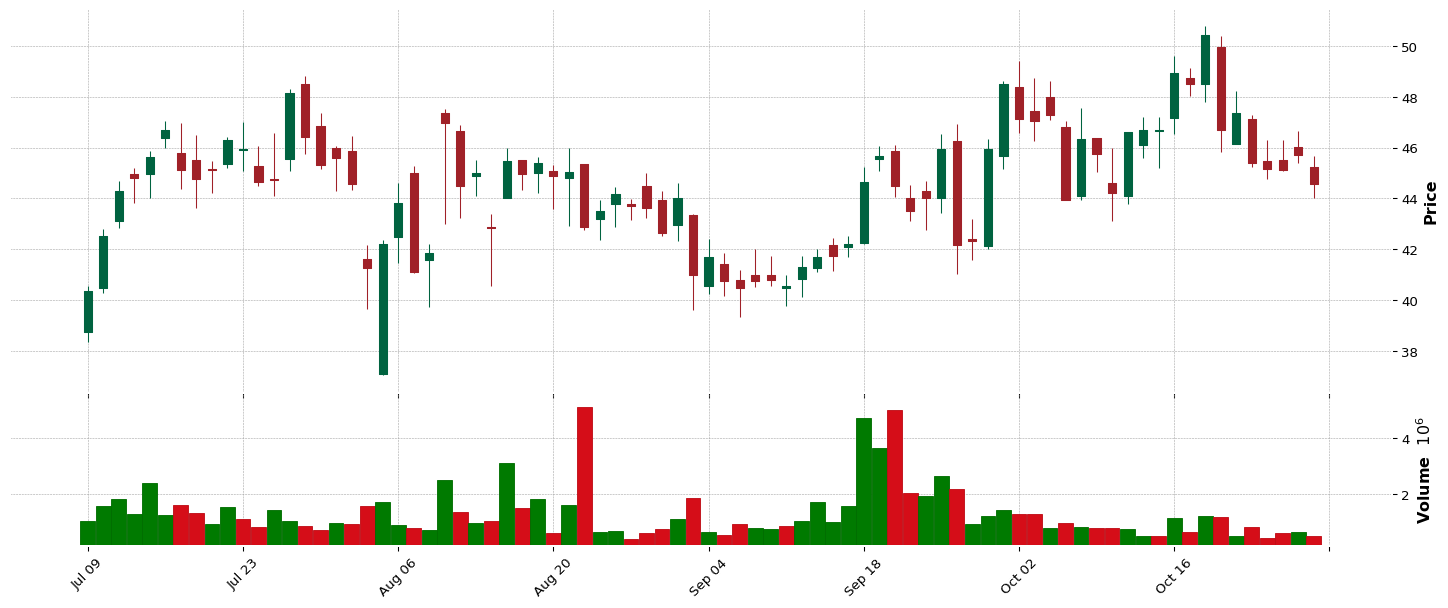
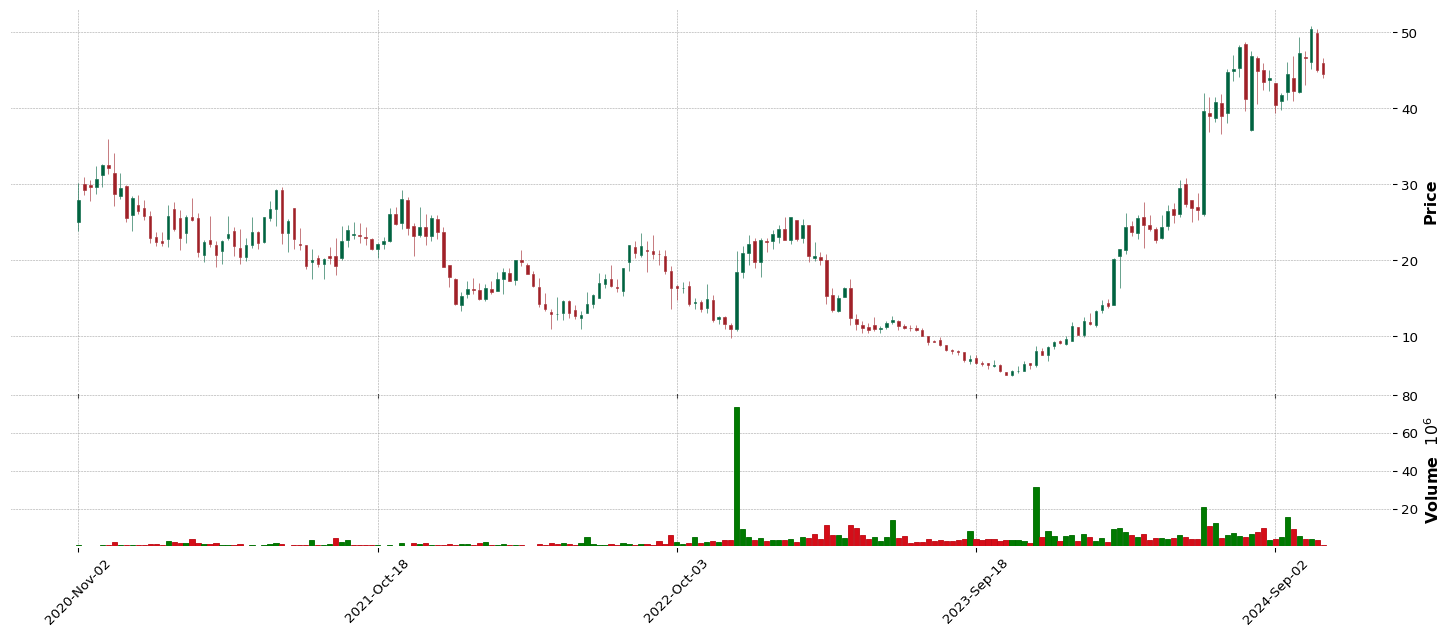
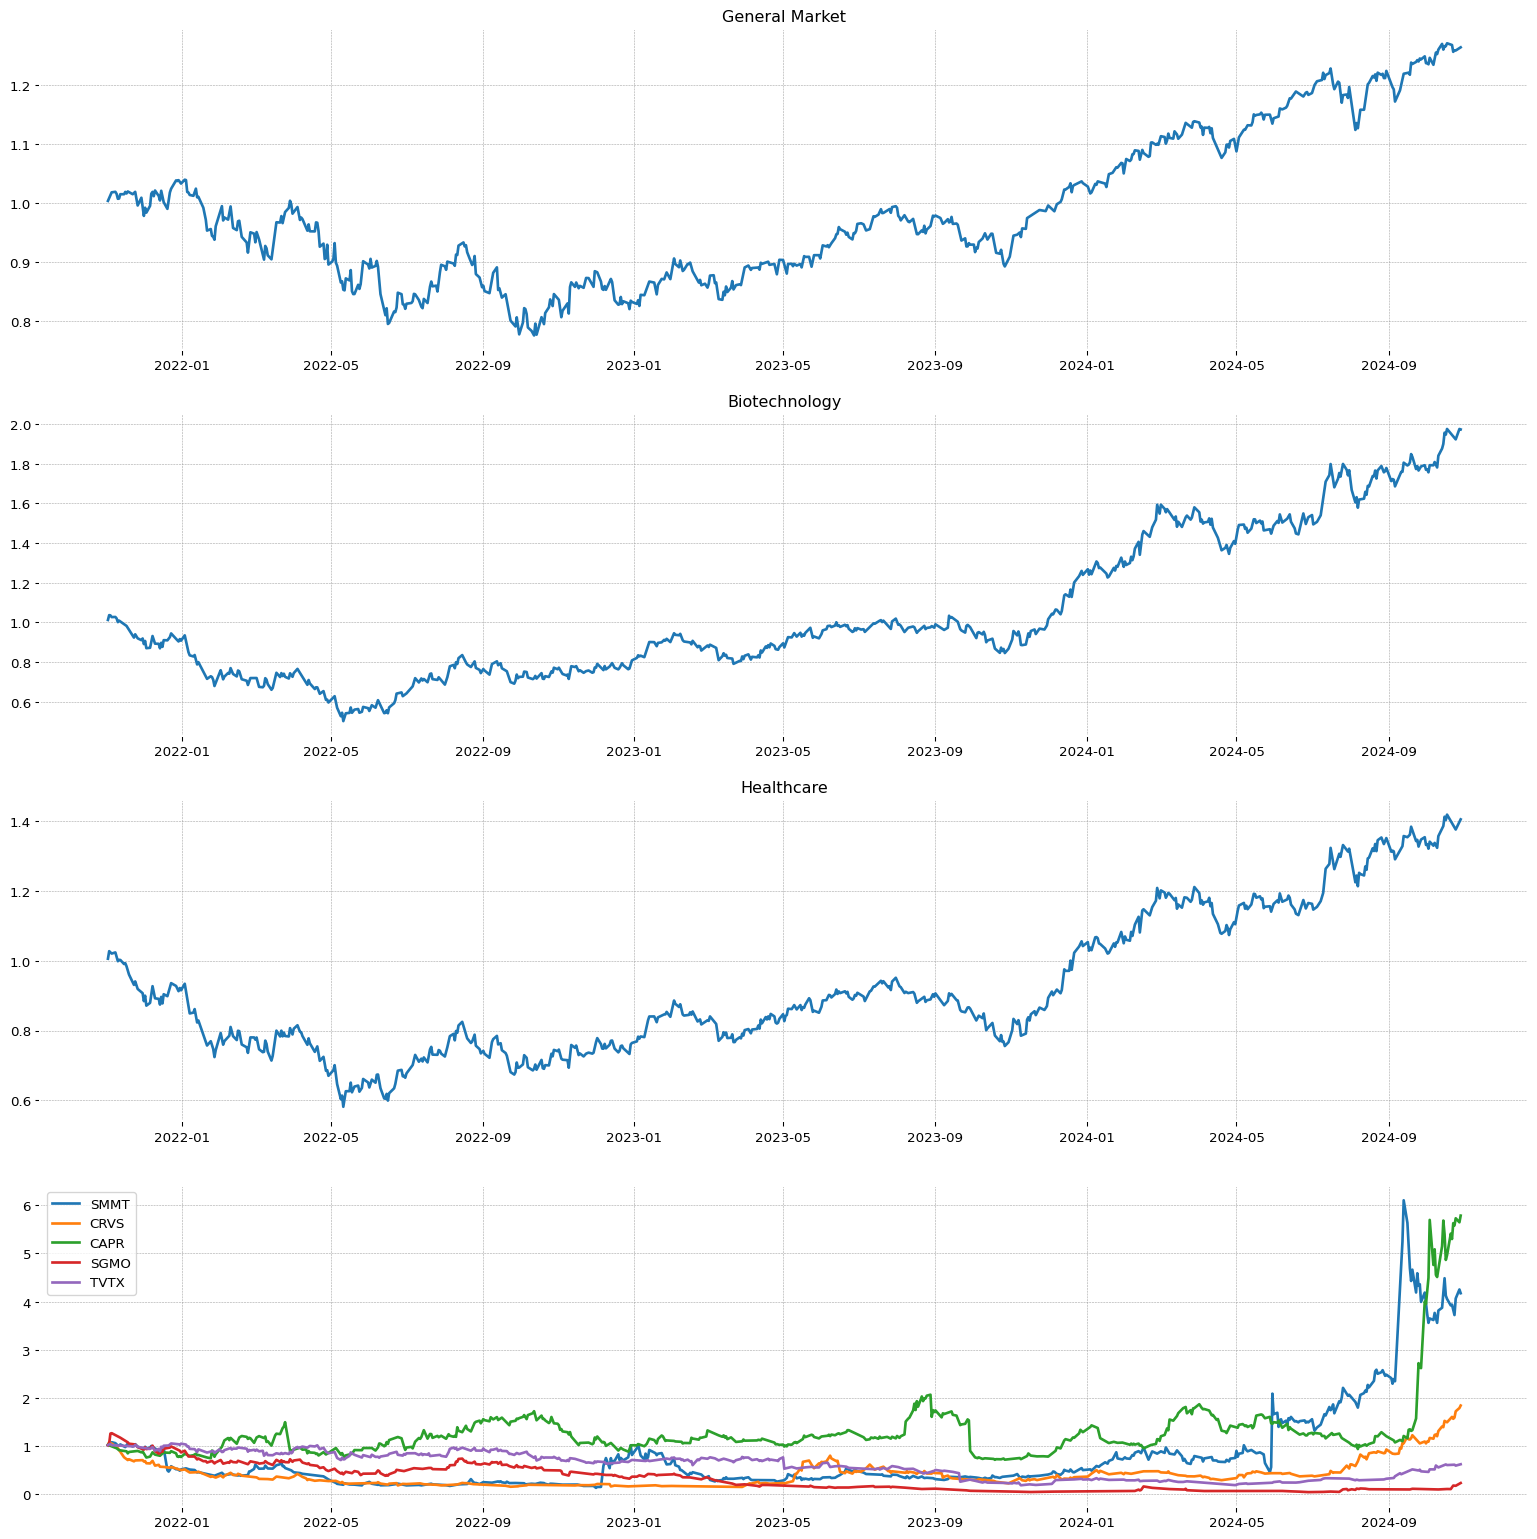 GGAL
GGAL
CLMB
**** TECNICO ****
CLMB
| Total stock number: | 3.83M |
| Namee: | Climb Global Solutions, Inc. |
| IPO date: | 1995-07-18 |
| SMR | EPS | RS |
73.14 | 86.79 | 93 |
| Sector | Sector Position |
| Technology | 2/11 |
| Industry | Industry Position - | Stock on industry - | RSI Sector: |
| Electronics & Computer Distribution | 44/147 | 1/7 | 42/445 |
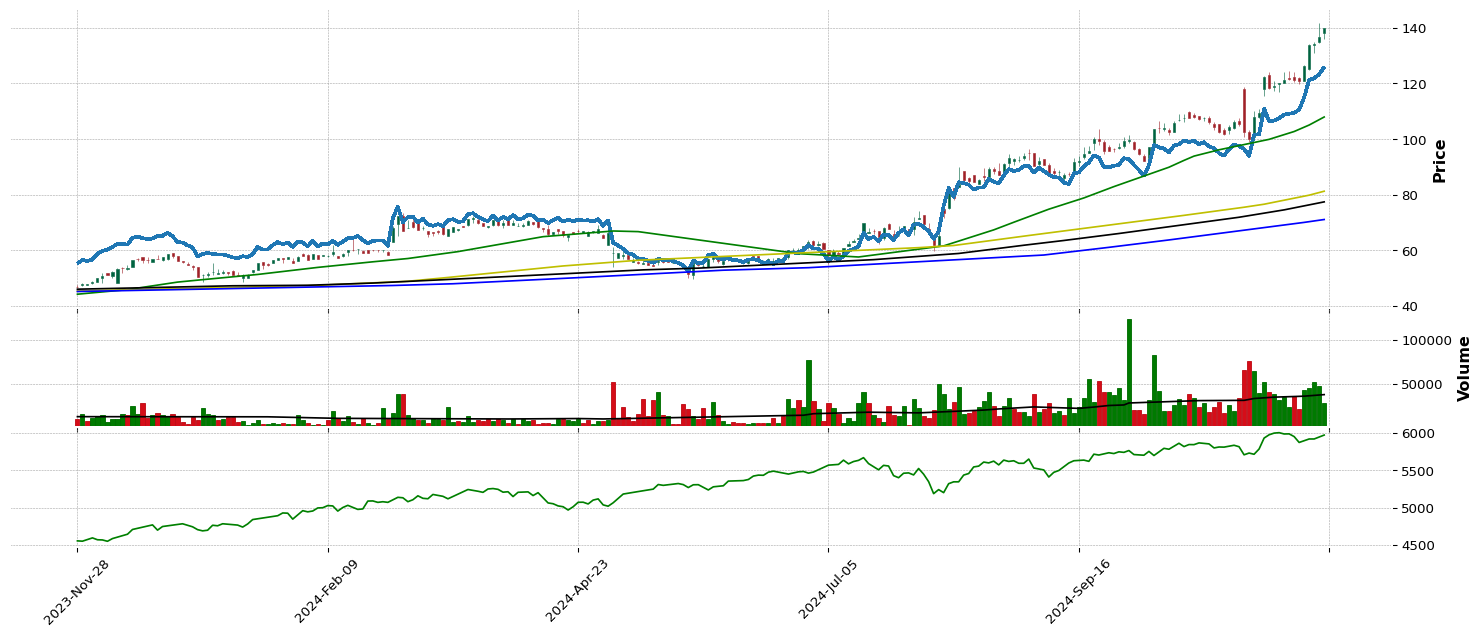
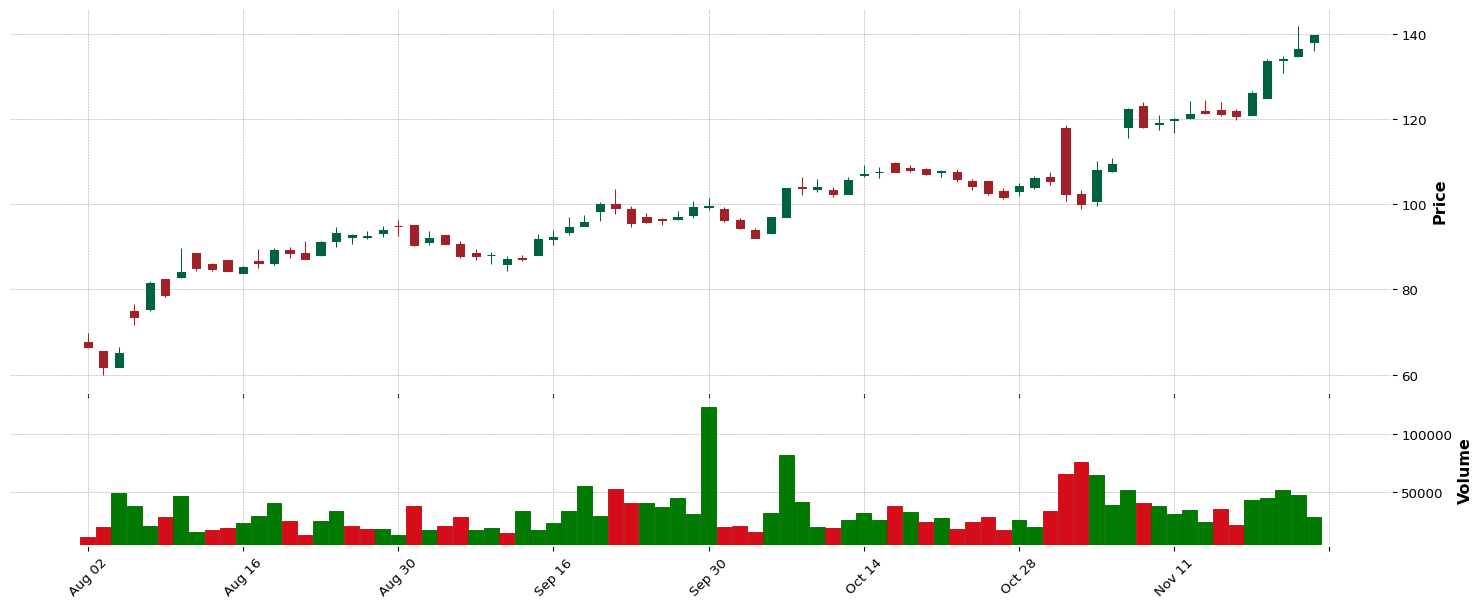
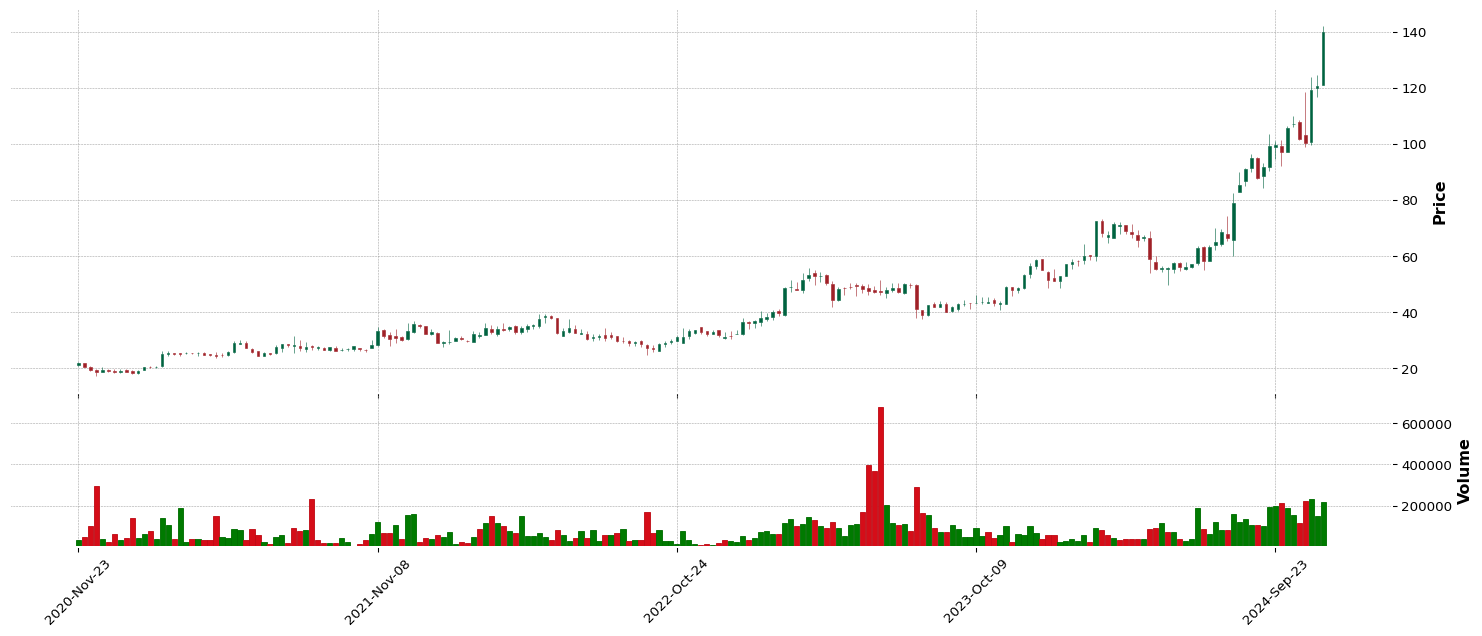
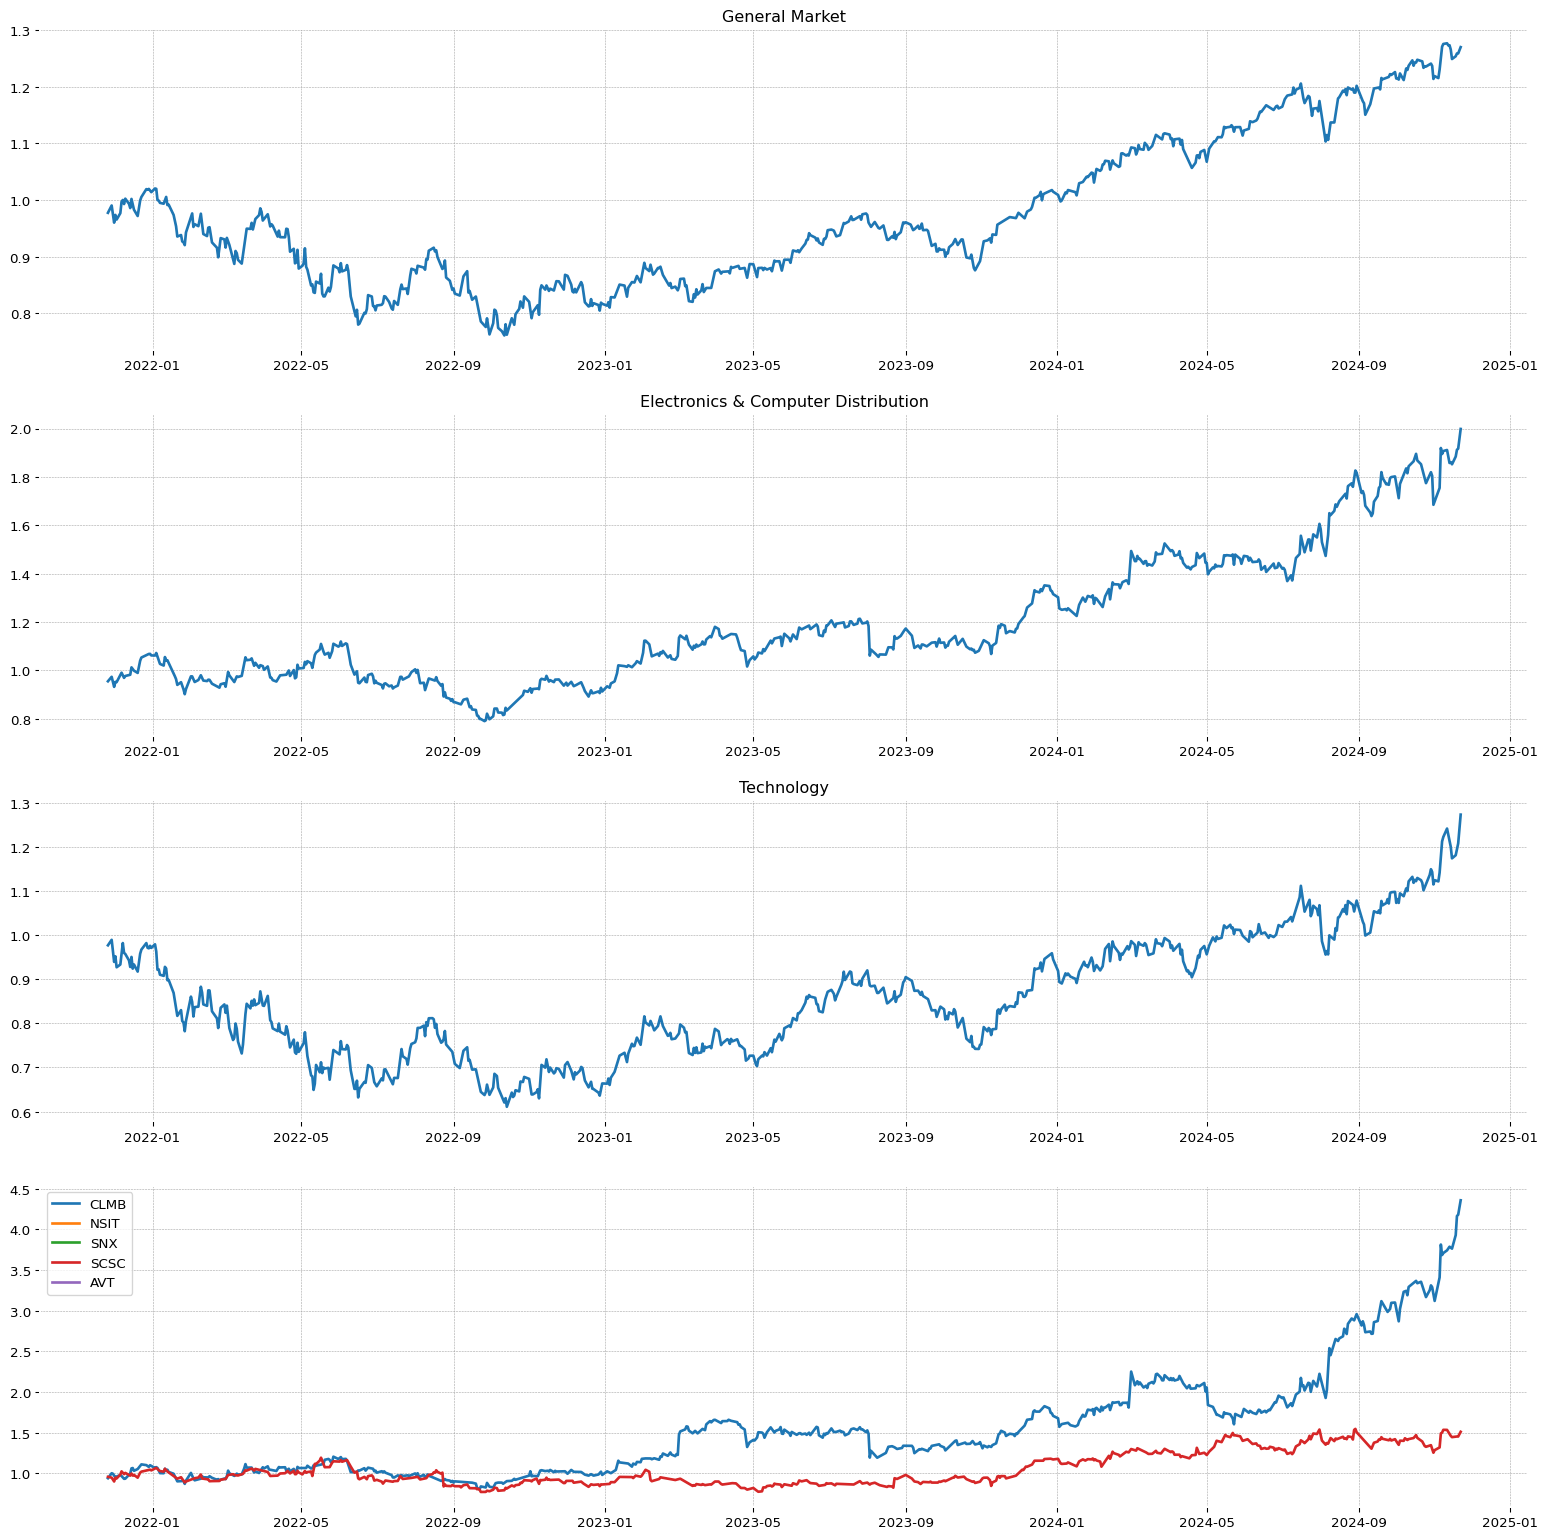 BWIN
BWIN
TGLS
**** TECNICO ****
TGLS
| Total stock number: | 21.97M |
| Namee: | Tecnoglass Inc. |
| IPO date: | 2012-05-10 |
| Sector | Sector Position |
| Basic Materials | 9/11 |
| Industry | Industry Position - | Stock on industry - | RSI Sector: |
| Building Materials | 63/147 | 2/13 | 30/182 |
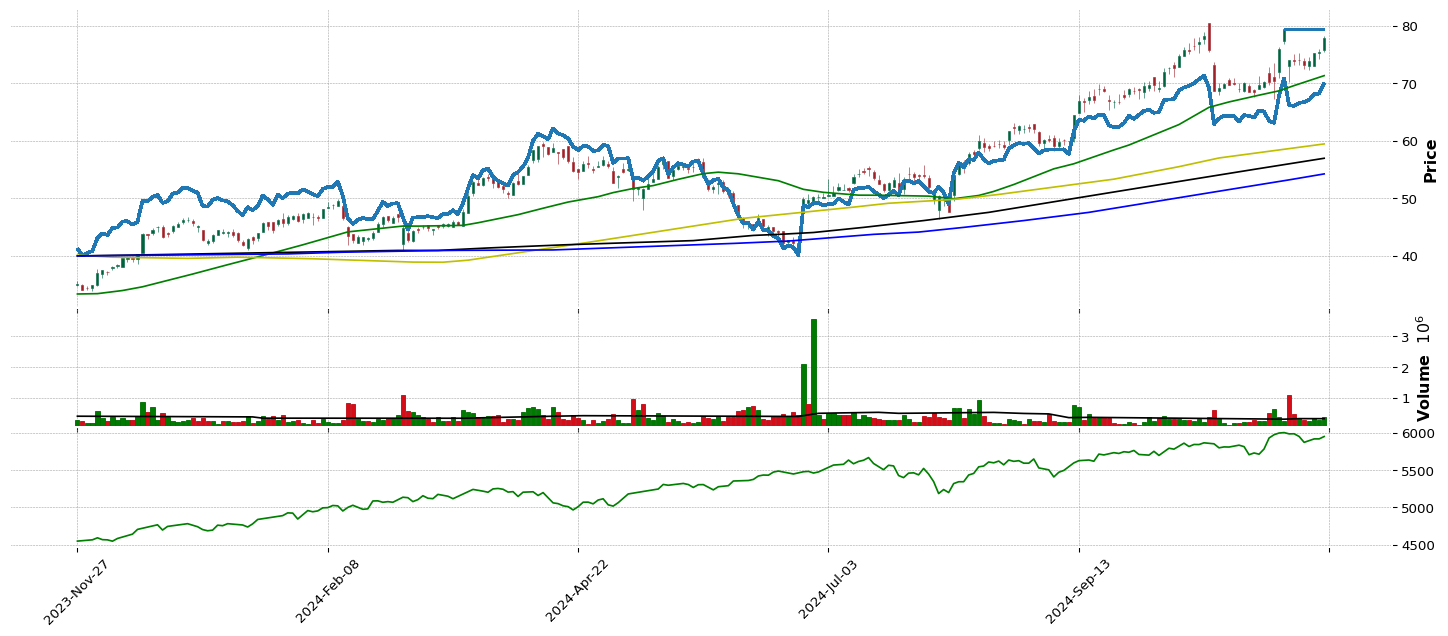
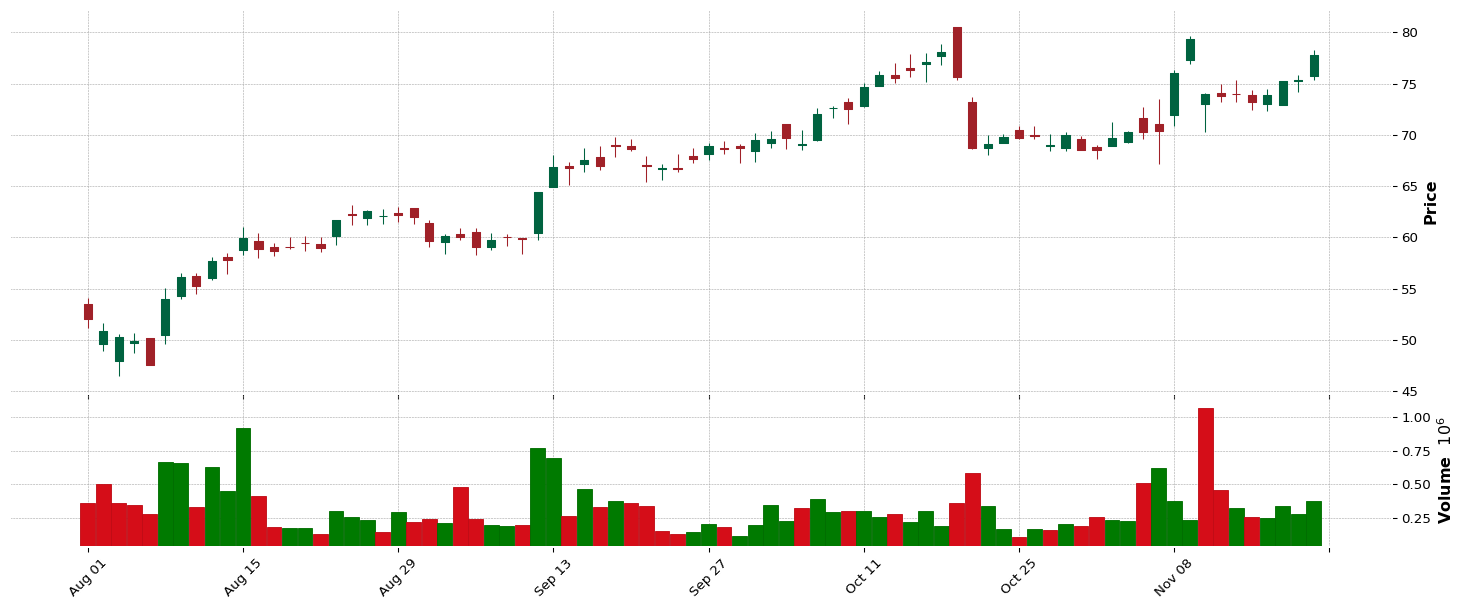
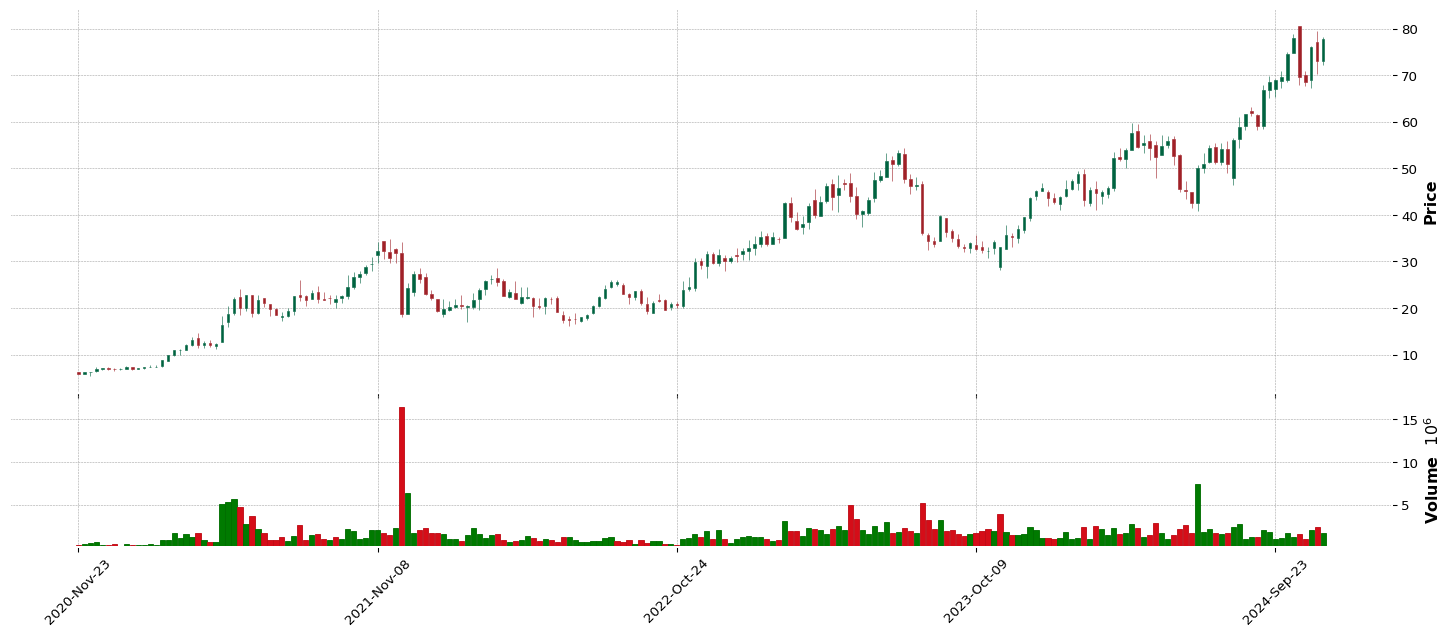
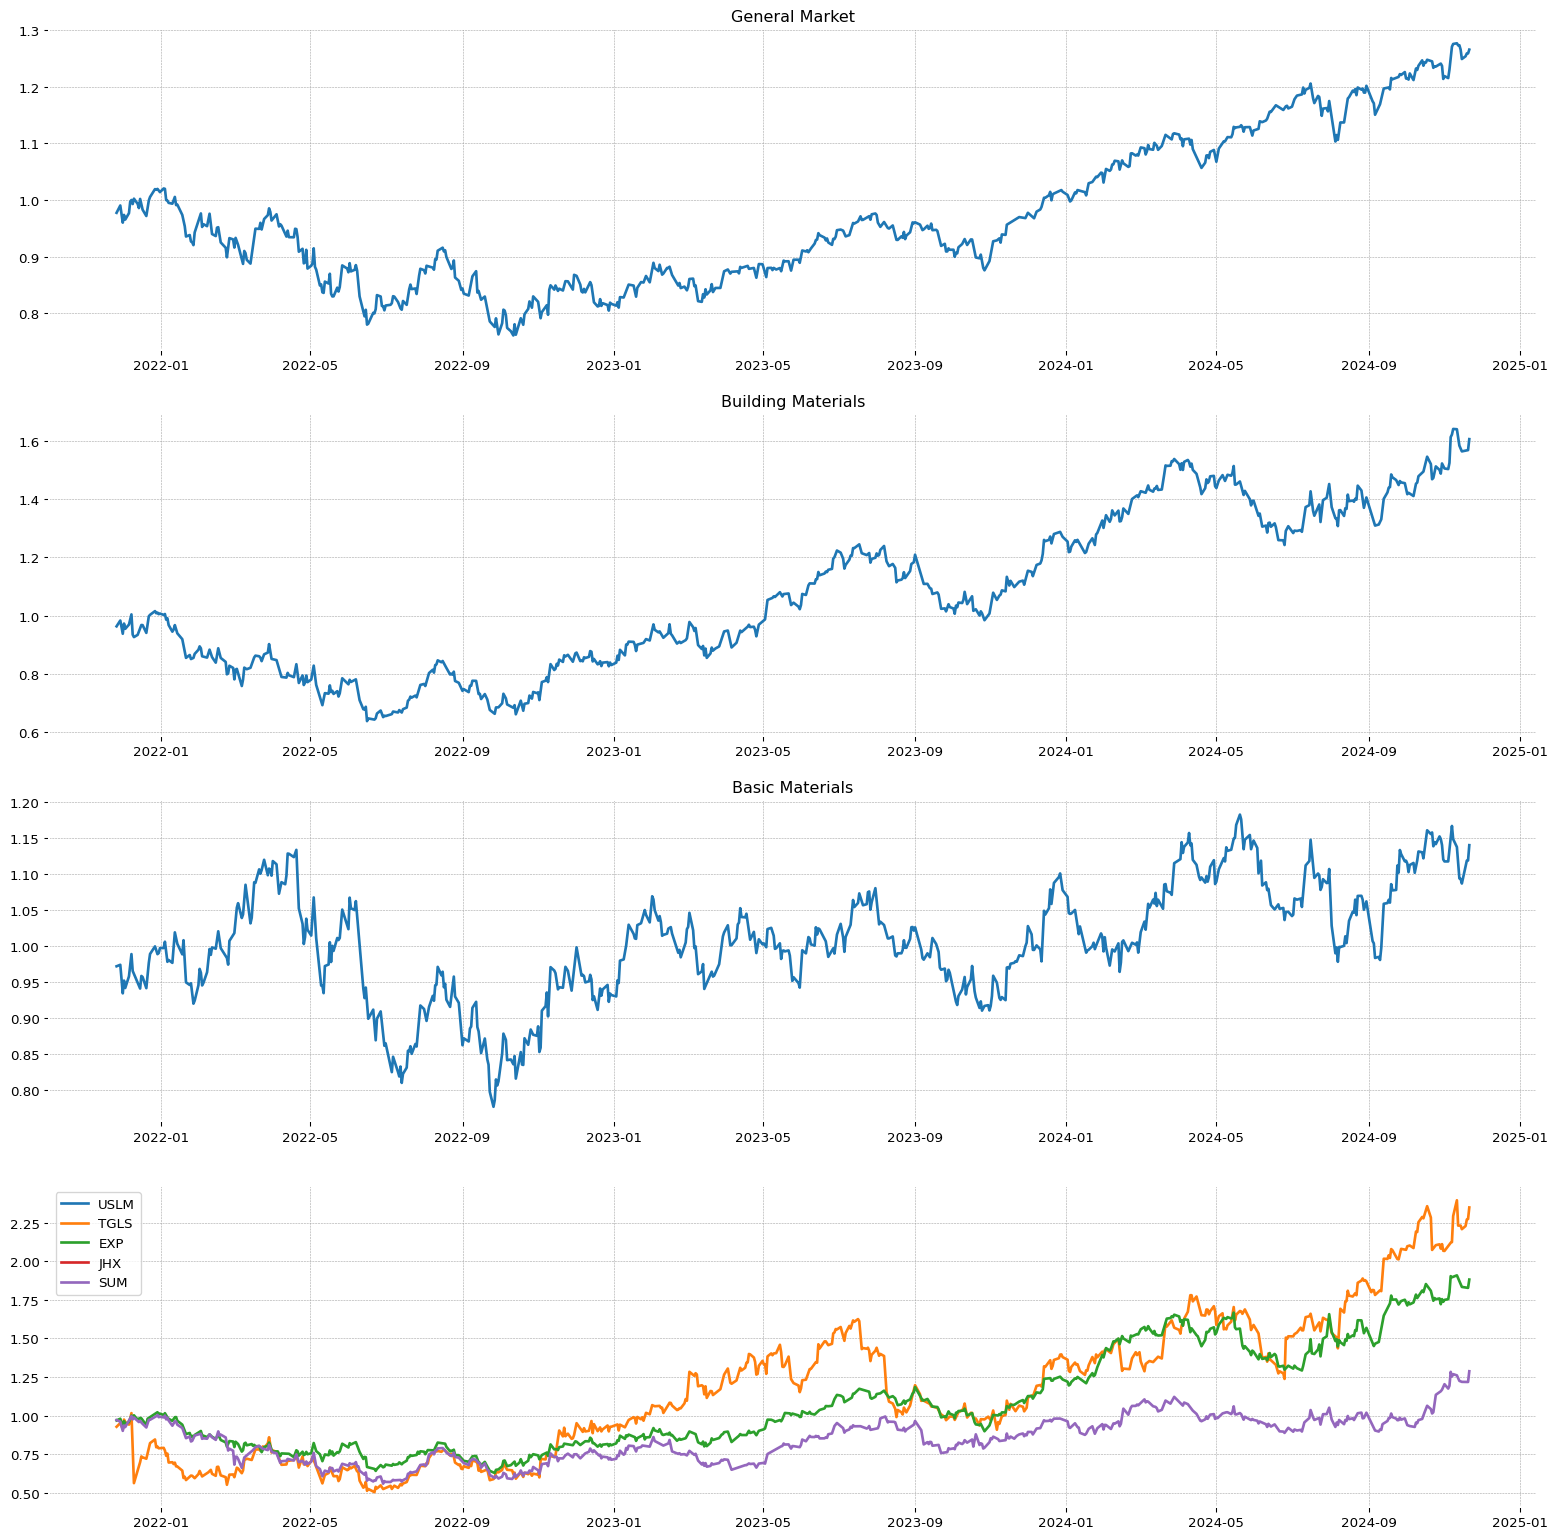 NGVC
NGVC
**** TECNICO ****
NGVC
| Total stock number: | 13.6M |
| Namee: | Natural Grocers by Vitamin Cottage, Inc. |
| IPO date: | 2012-07-25 |
| SMR | EPS | RS |
65.03 | 56.51 | 91 |
| Sector | Sector Position |
| Consumer Defensive | 10/11 |
| Industry | Industry Position - | Stock on industry - | RSI Sector: |
| Grocery Stores | 37/147 | 2/11 | 5/147 |
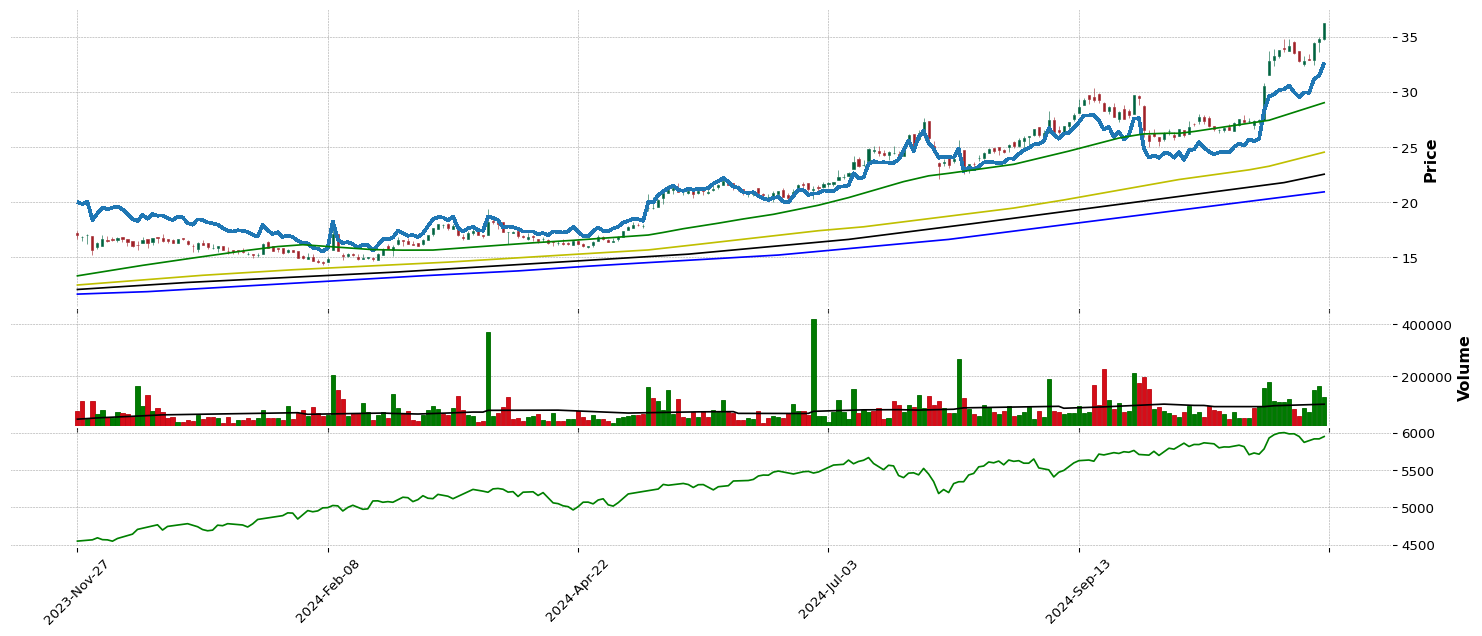
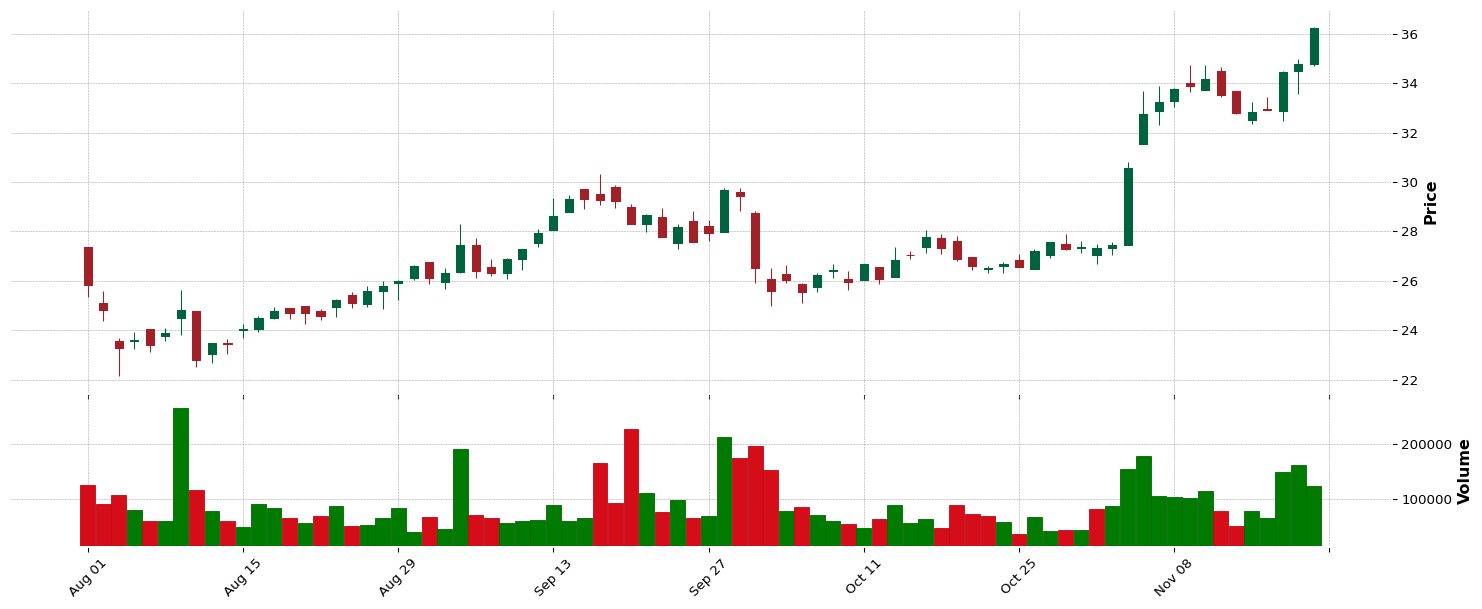
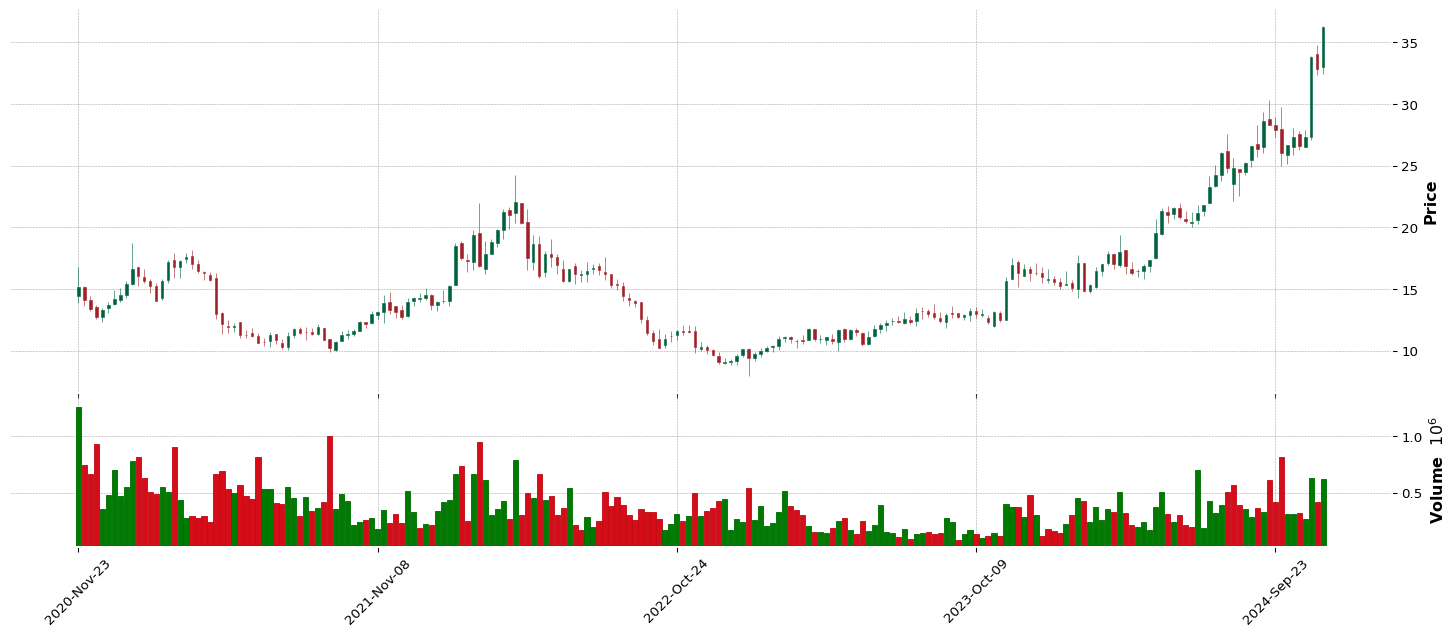
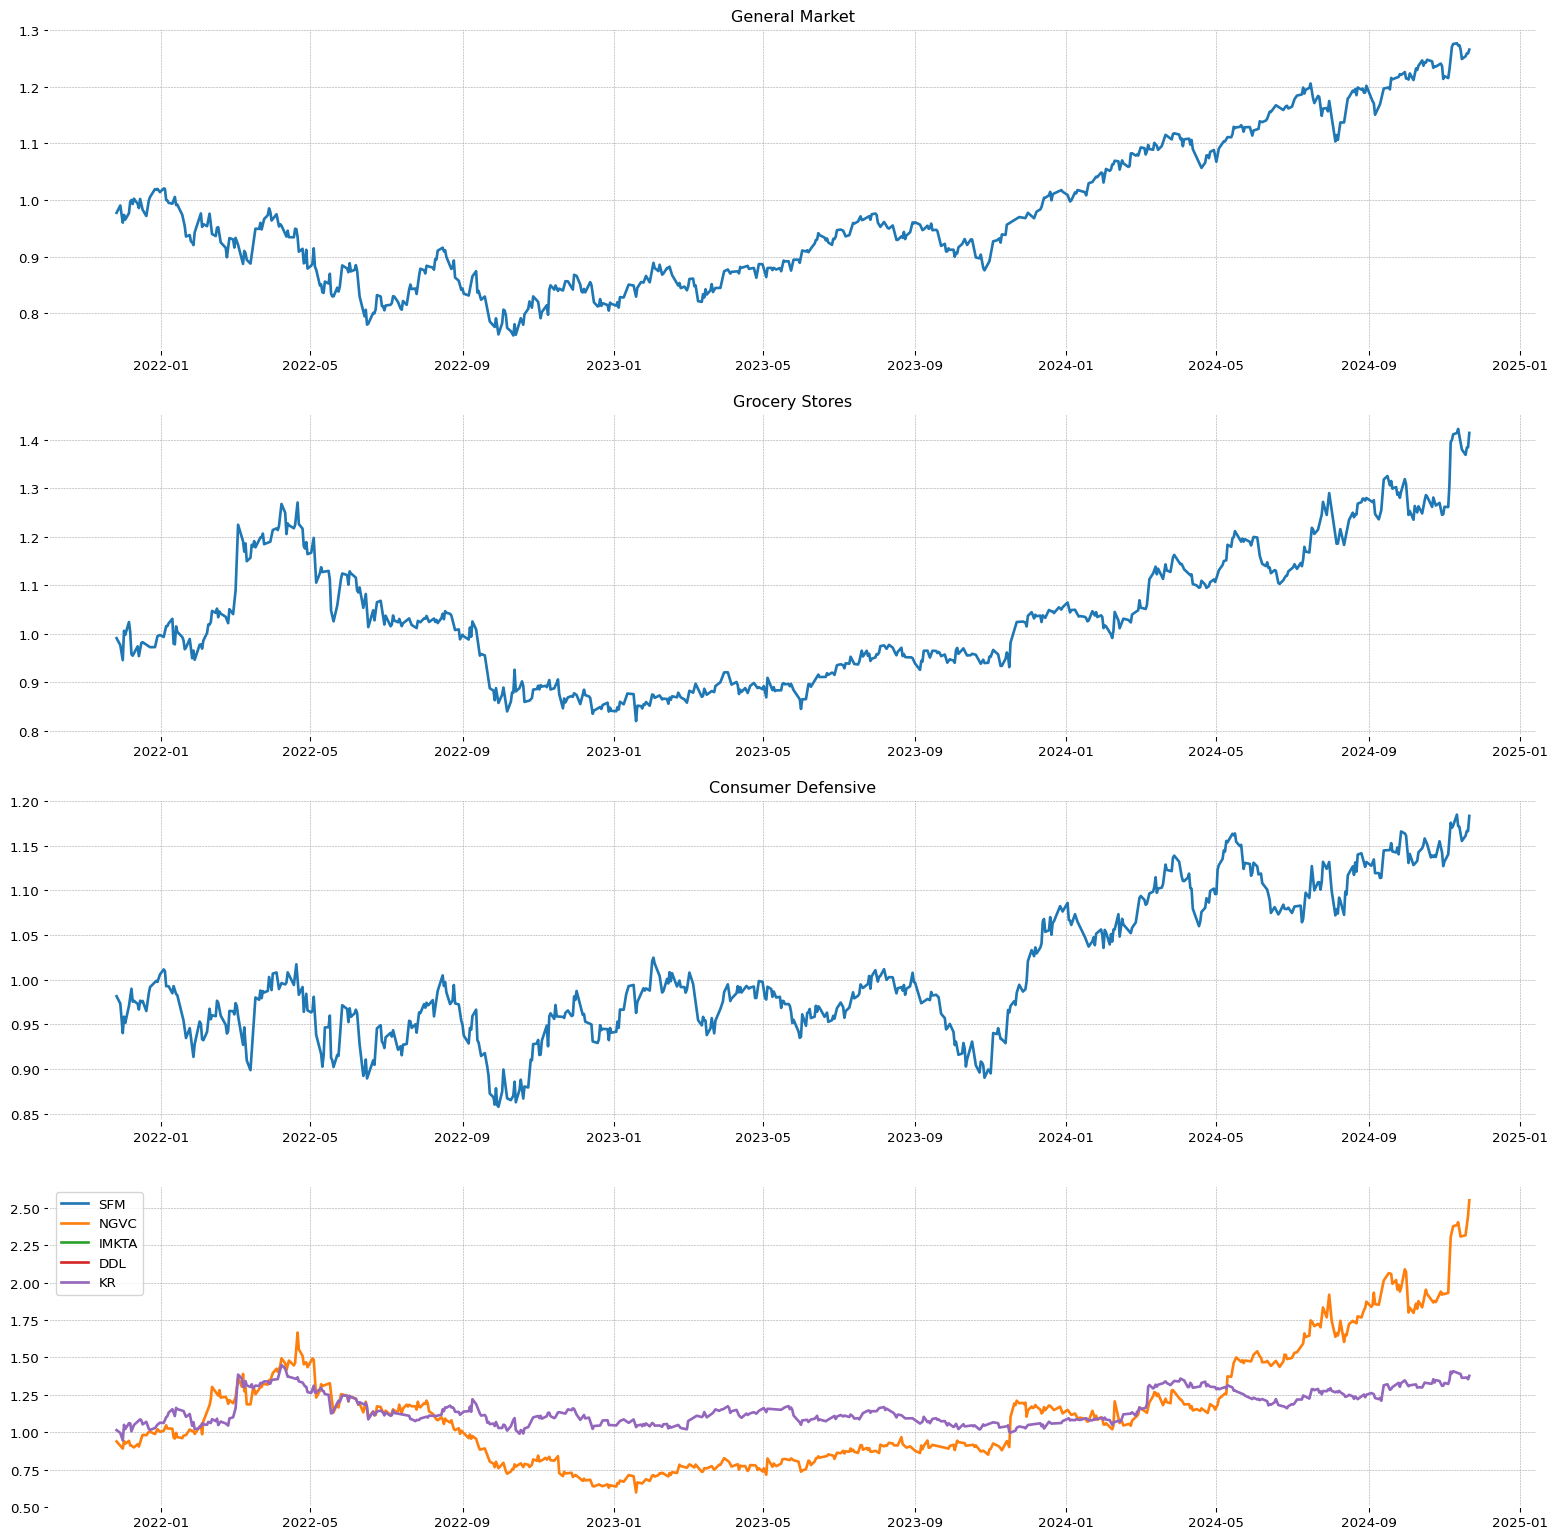 CLBT
CLBT
**** TECNICO ****
CLBT
| Total stock number: | 83.92M |
| Namee: | Cellebrite DI Ltd. |
| IPO date: | 2020-11-06 |
| SMR | EPS | RS |
44.17 | 53.41 | 95 |
| Sector | Sector Position |
| Technology | 2/11 |
| Industry | Industry Position - | Stock on industry - | RSI Sector: |
| Software - Infrastructure | 55/147 | 4/103 | 29/445 |
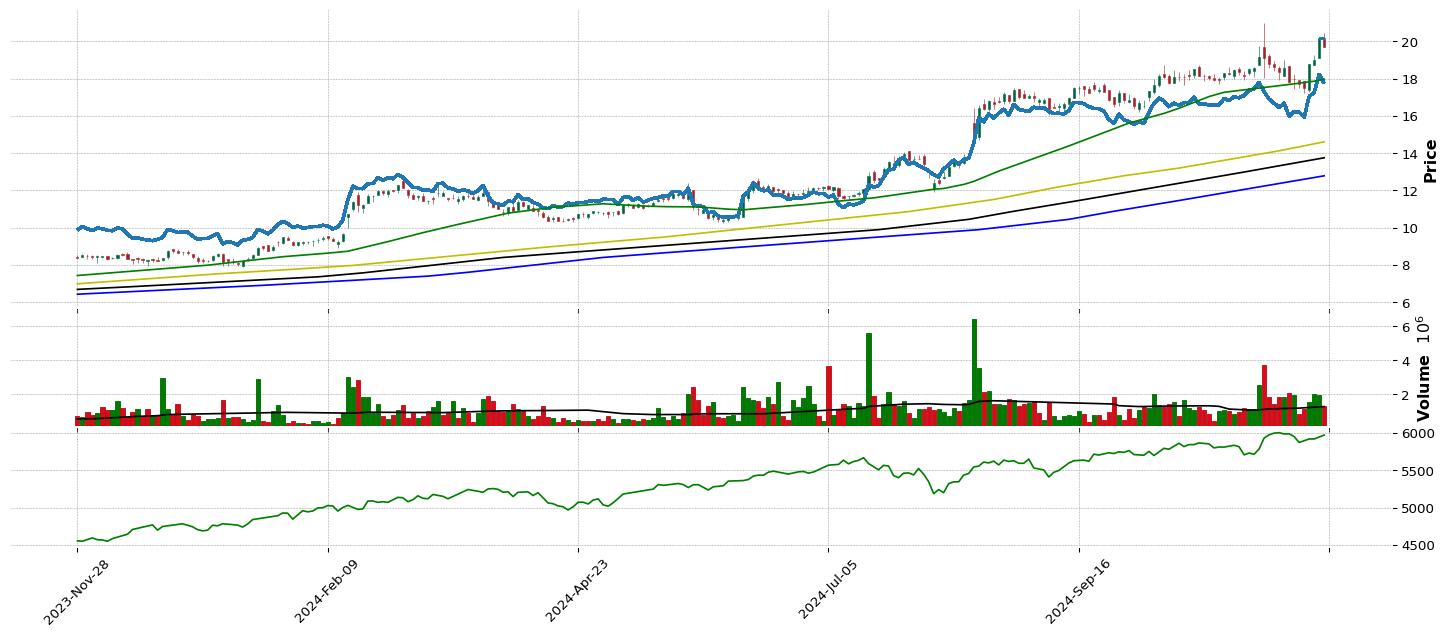
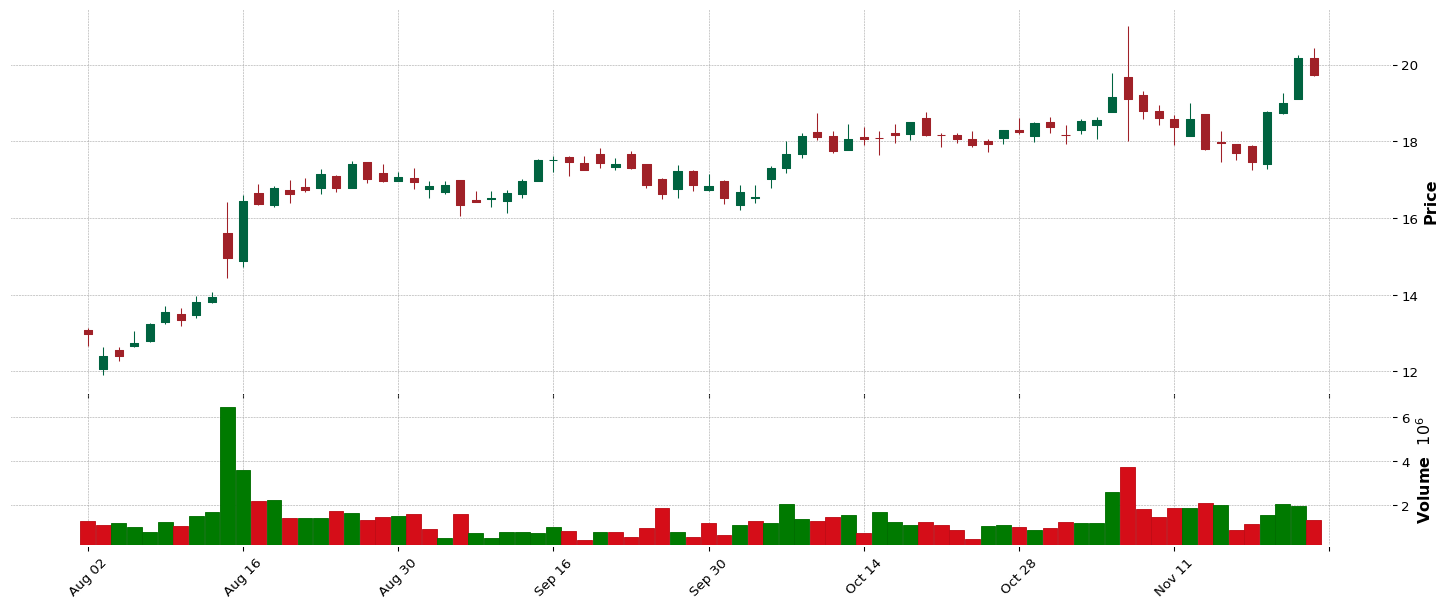
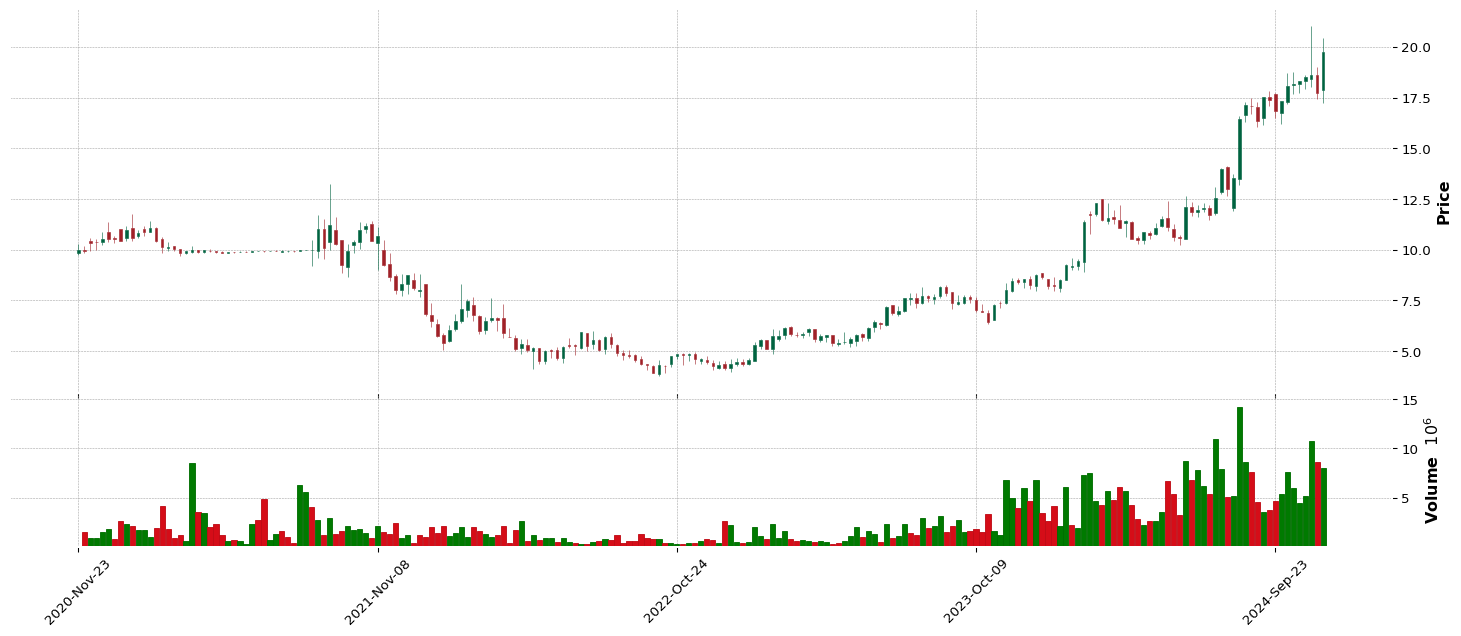
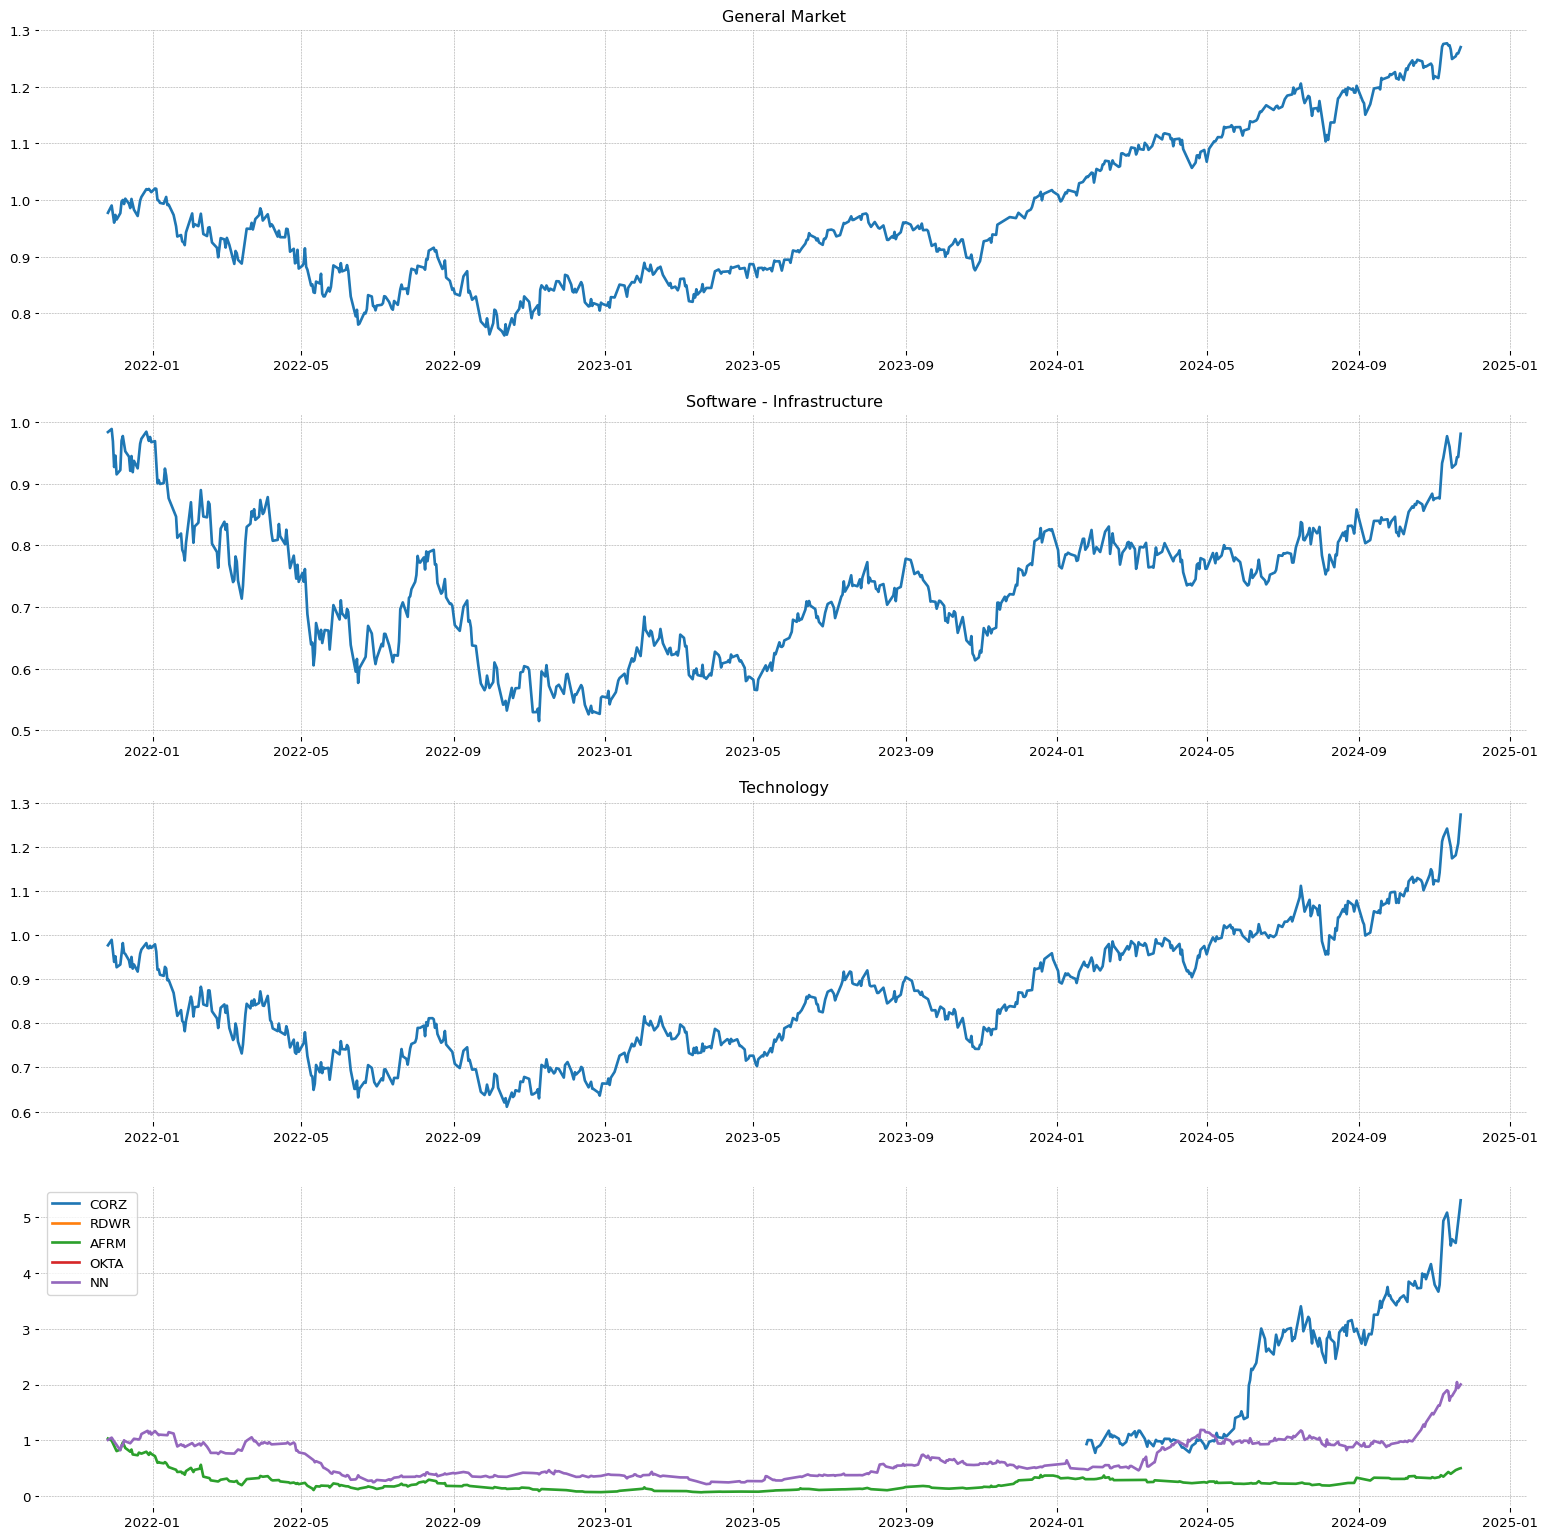 PRCT
PRCT
**** TECNICO ****
PRCT
| Total stock number: | 49.58M |
| Namee: | PROCEPT BioRobotics Corporation |
| IPO date: | 2021-09-15 |
| SMR | EPS | RS |
91.97 | 21.09 | 97 |
| Sector | Sector Position |
| Healthcare | 1/11 |
| Industry | Industry Position - | Stock on industry - | RSI Sector: |
| Medical Devices | 95/147 | 3/57 | 80/487 |
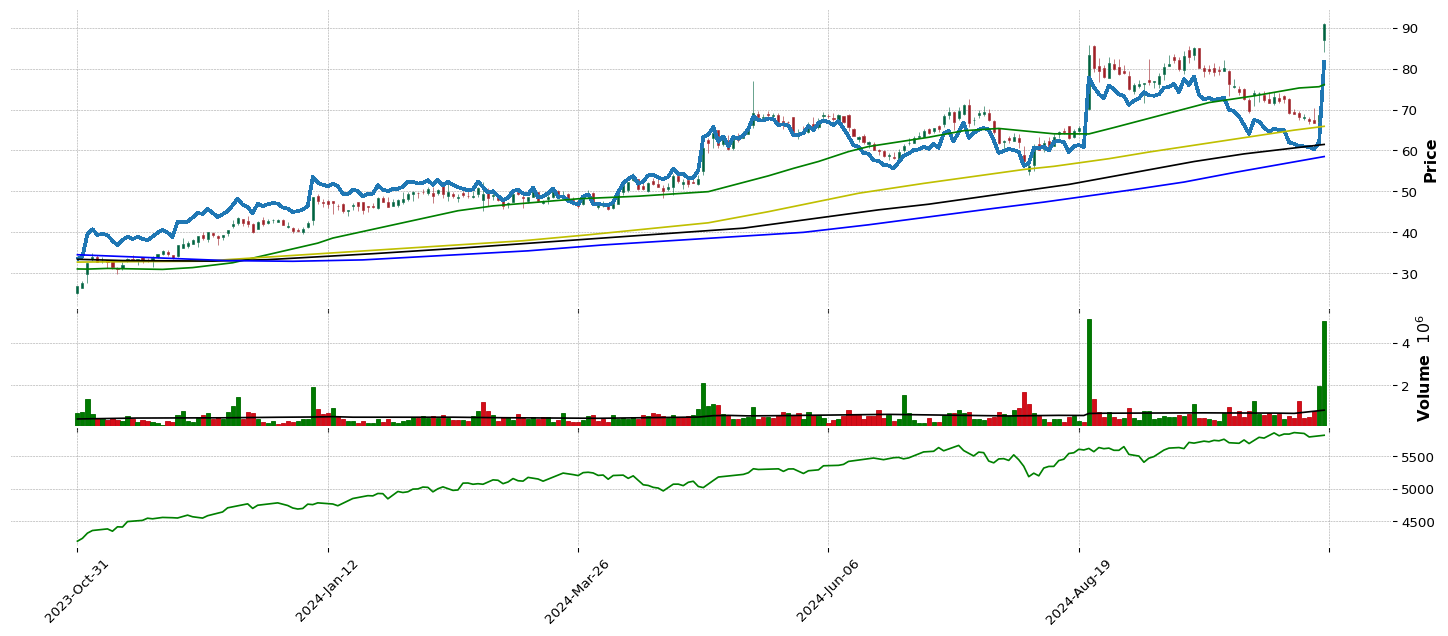
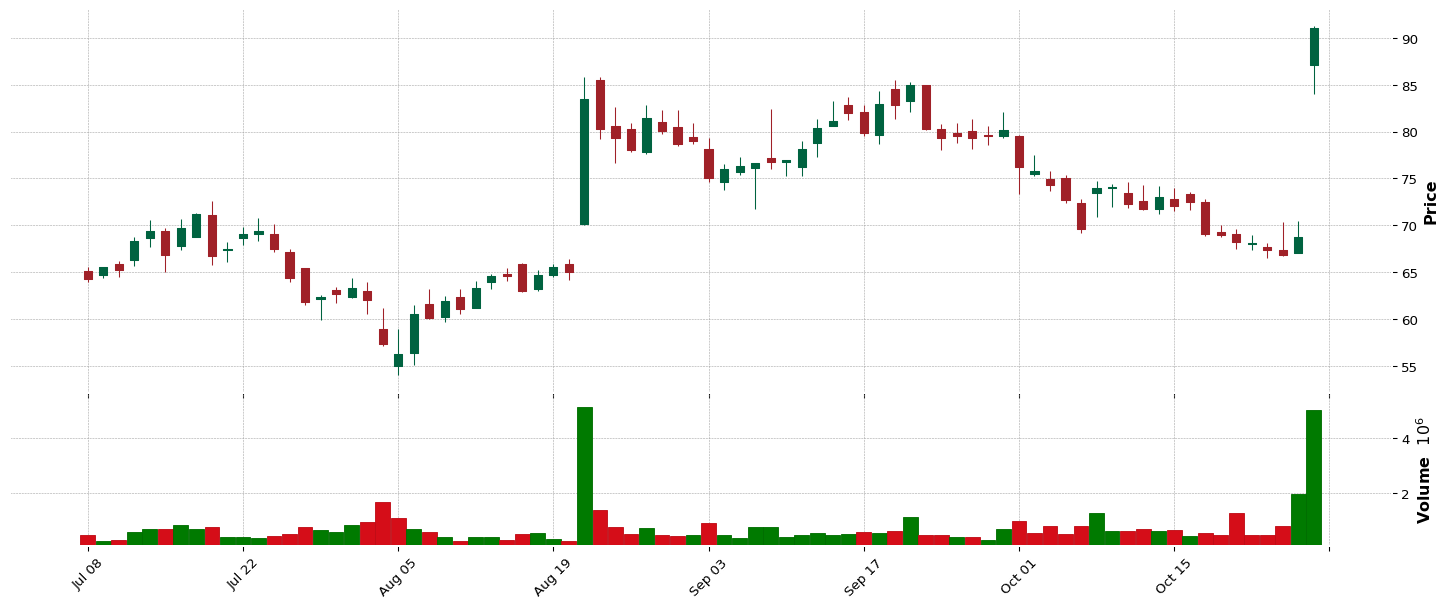
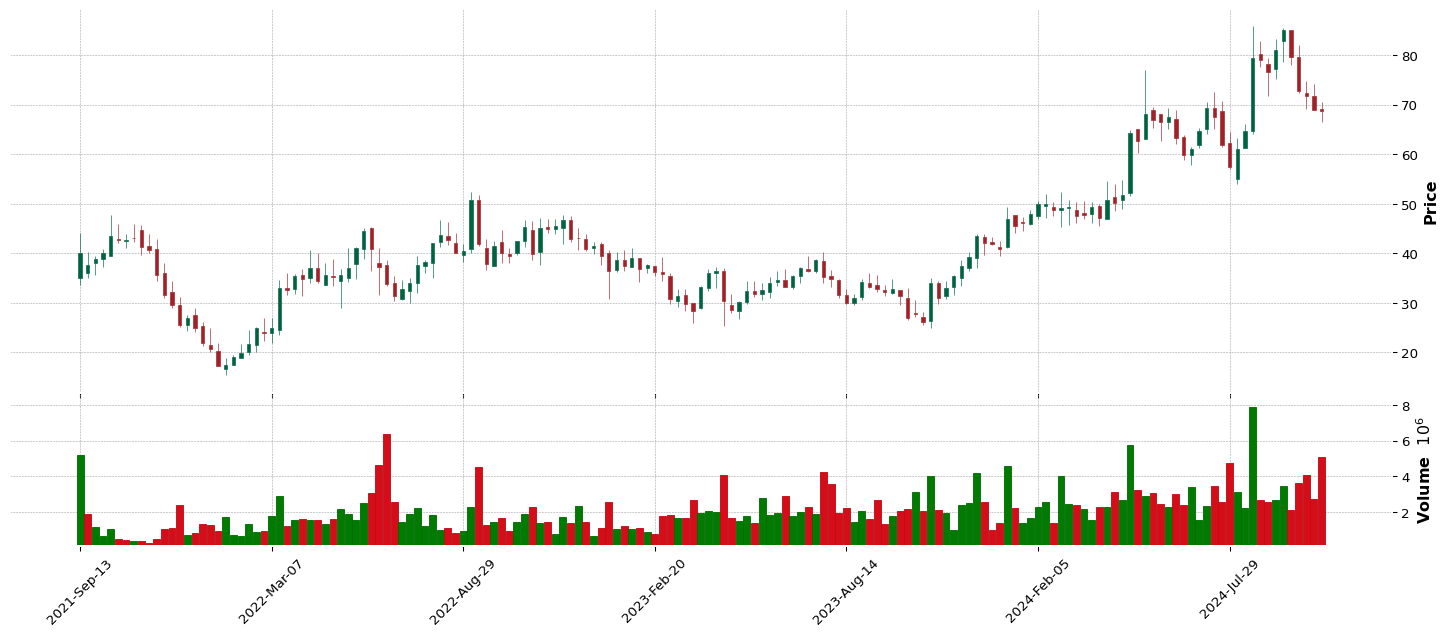
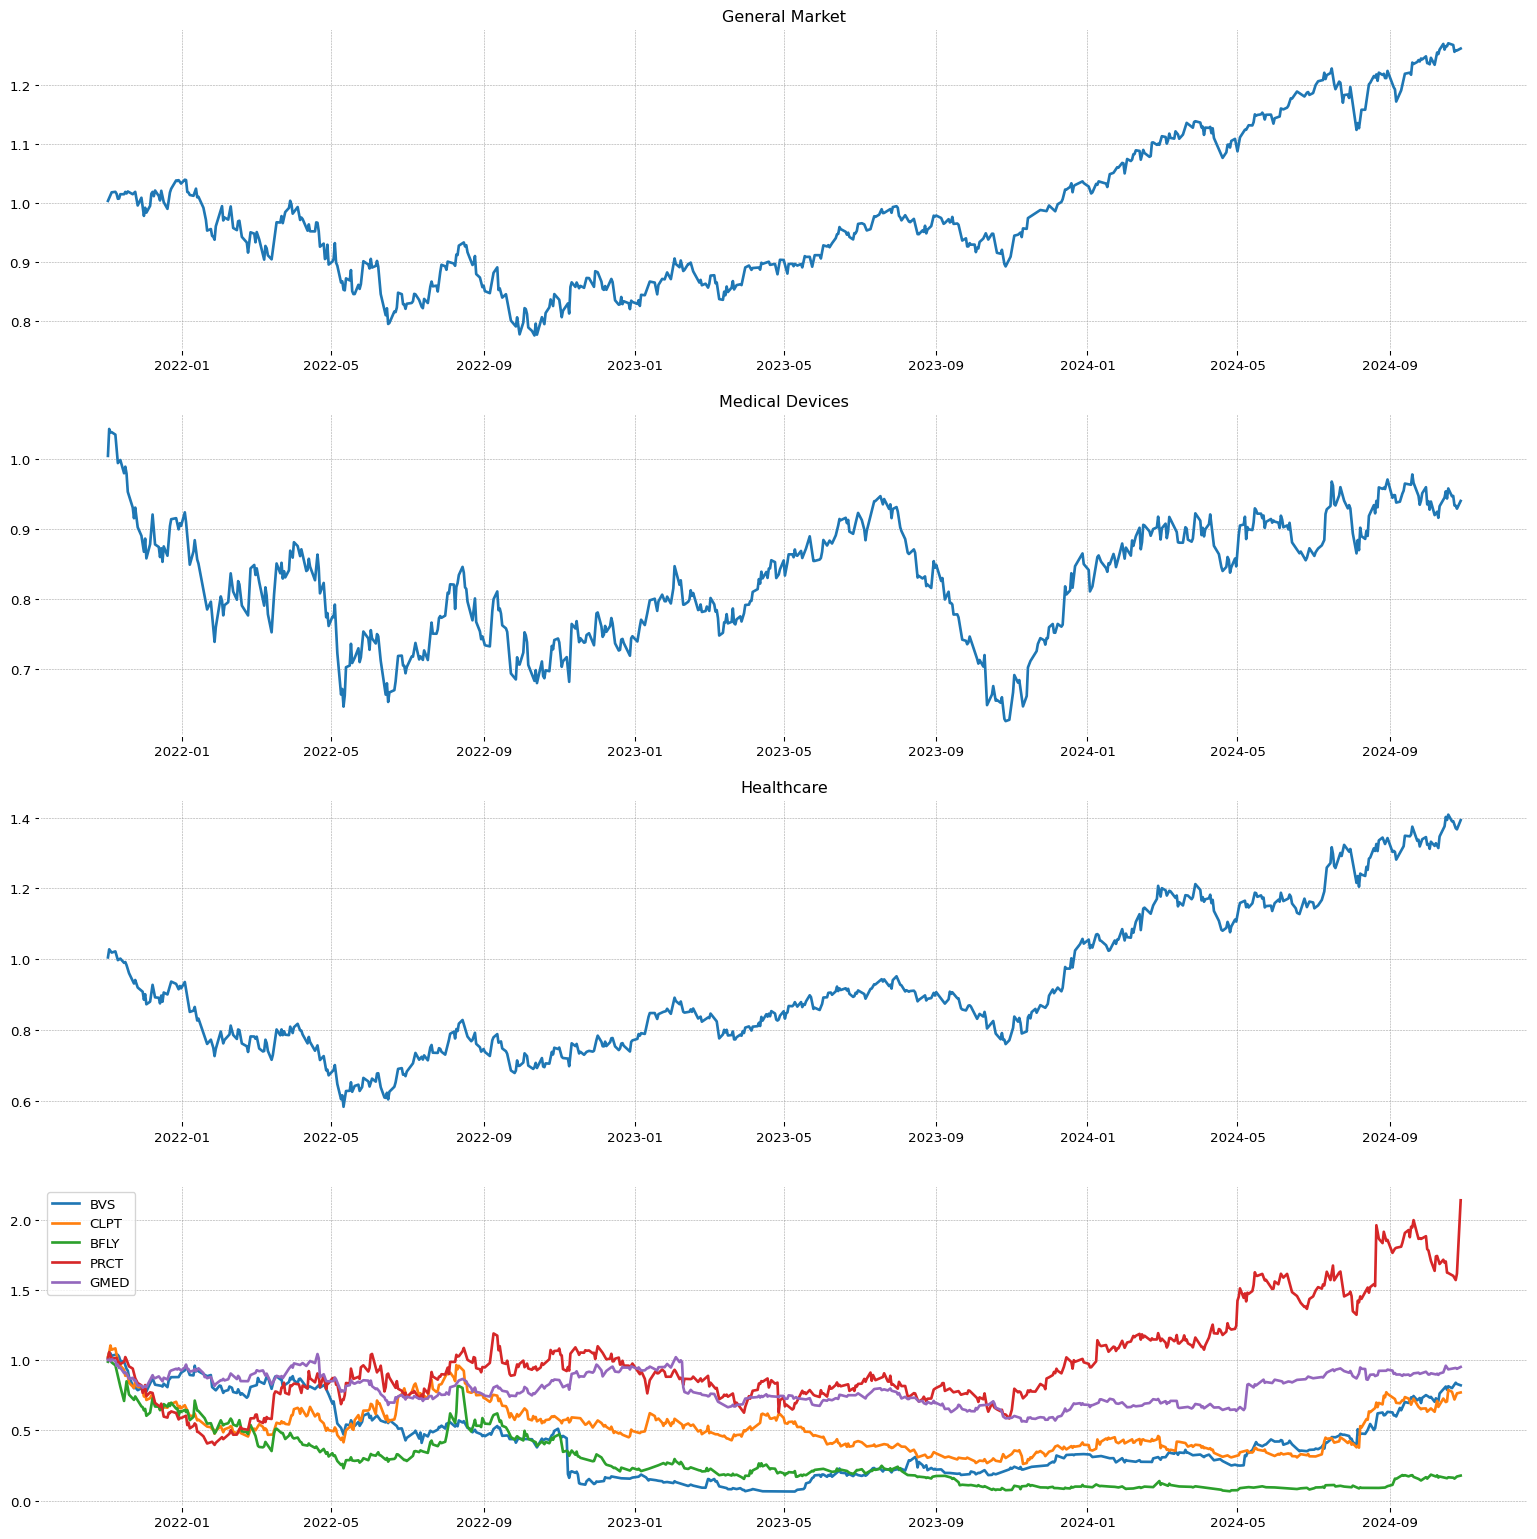 LMB
LMB
**** TECNICO ****
LMB
| Total stock number: | 9.96M |
| Namee: | Limbach Holdings, Inc. |
| IPO date: | 2014-08-08 |
| SMR | EPS | RS |
88.48 | 81.87 | 95 |
| Sector | Sector Position |
| Industrials | 7/11 |
| Industry | Industry Position - | Stock on industry - | RSI Sector: |
| Building Products & Equipment | 58/147 | 2/27 | 18/402 |
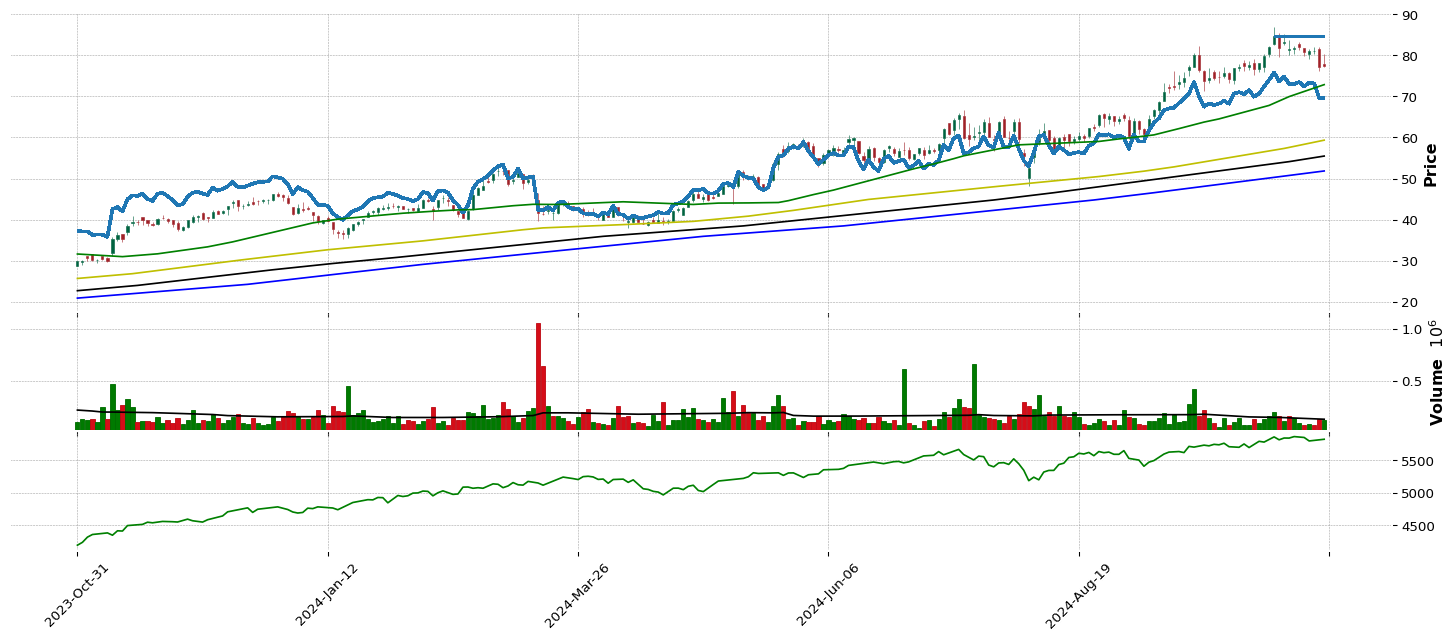
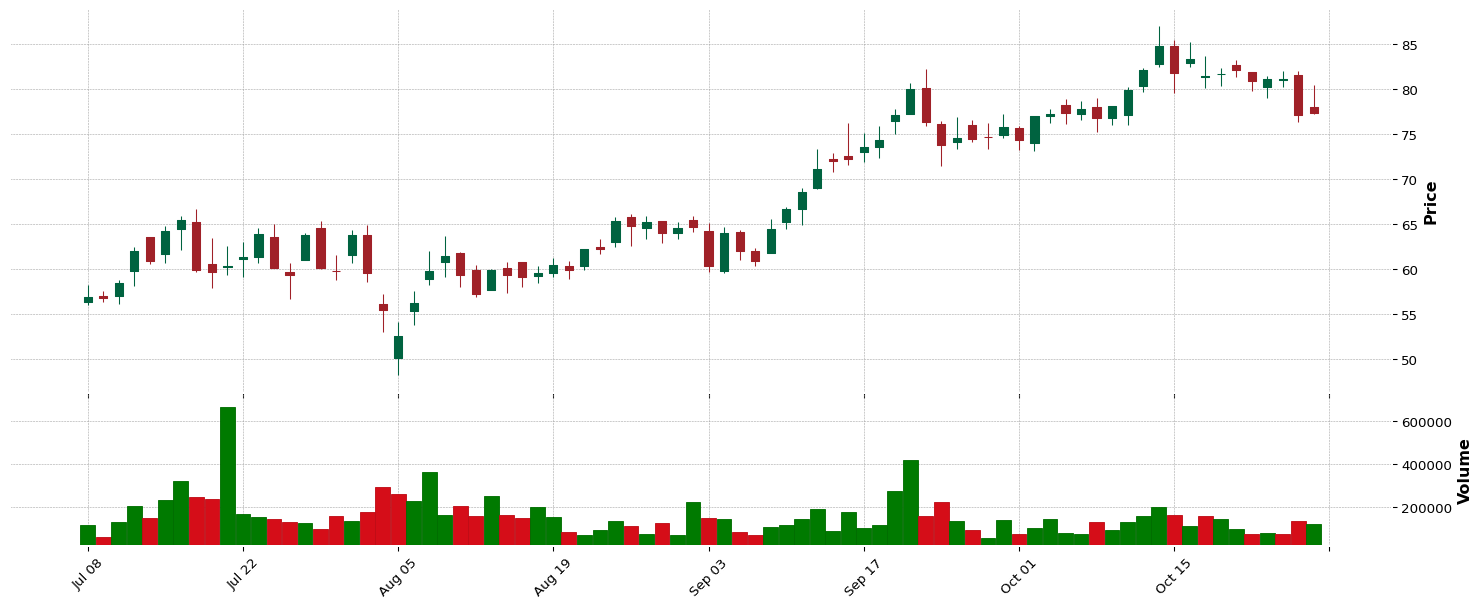
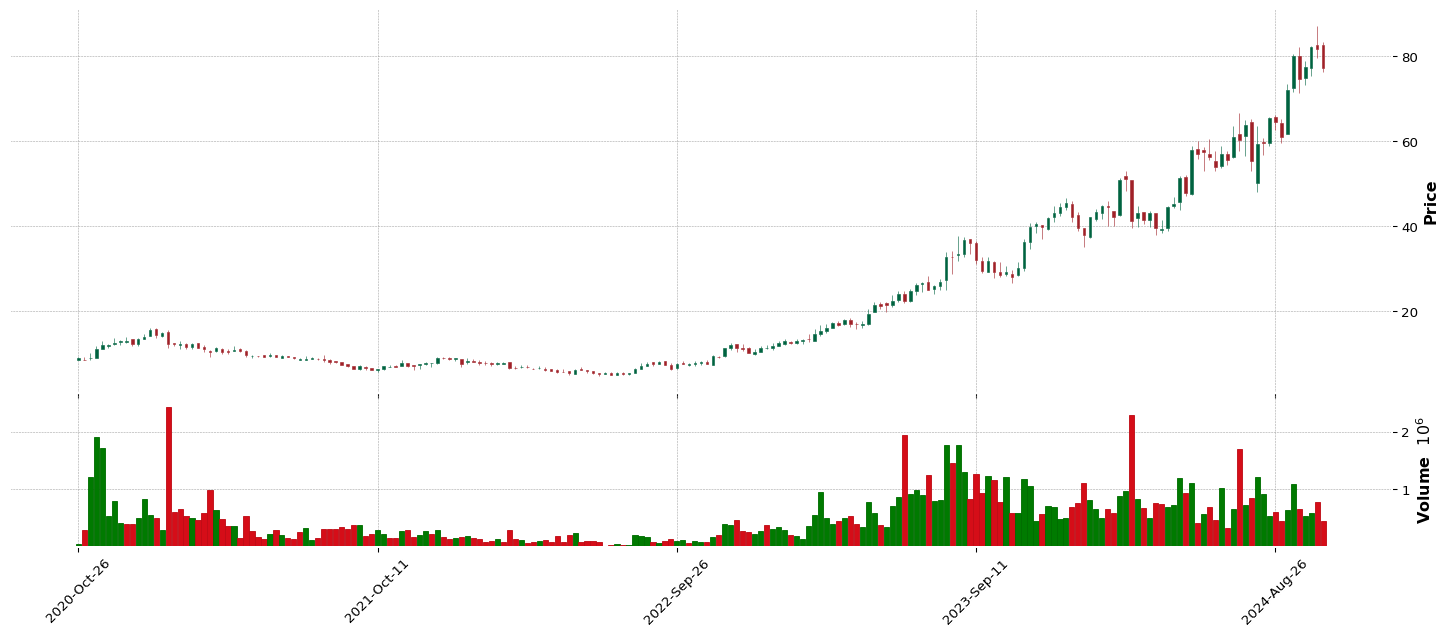
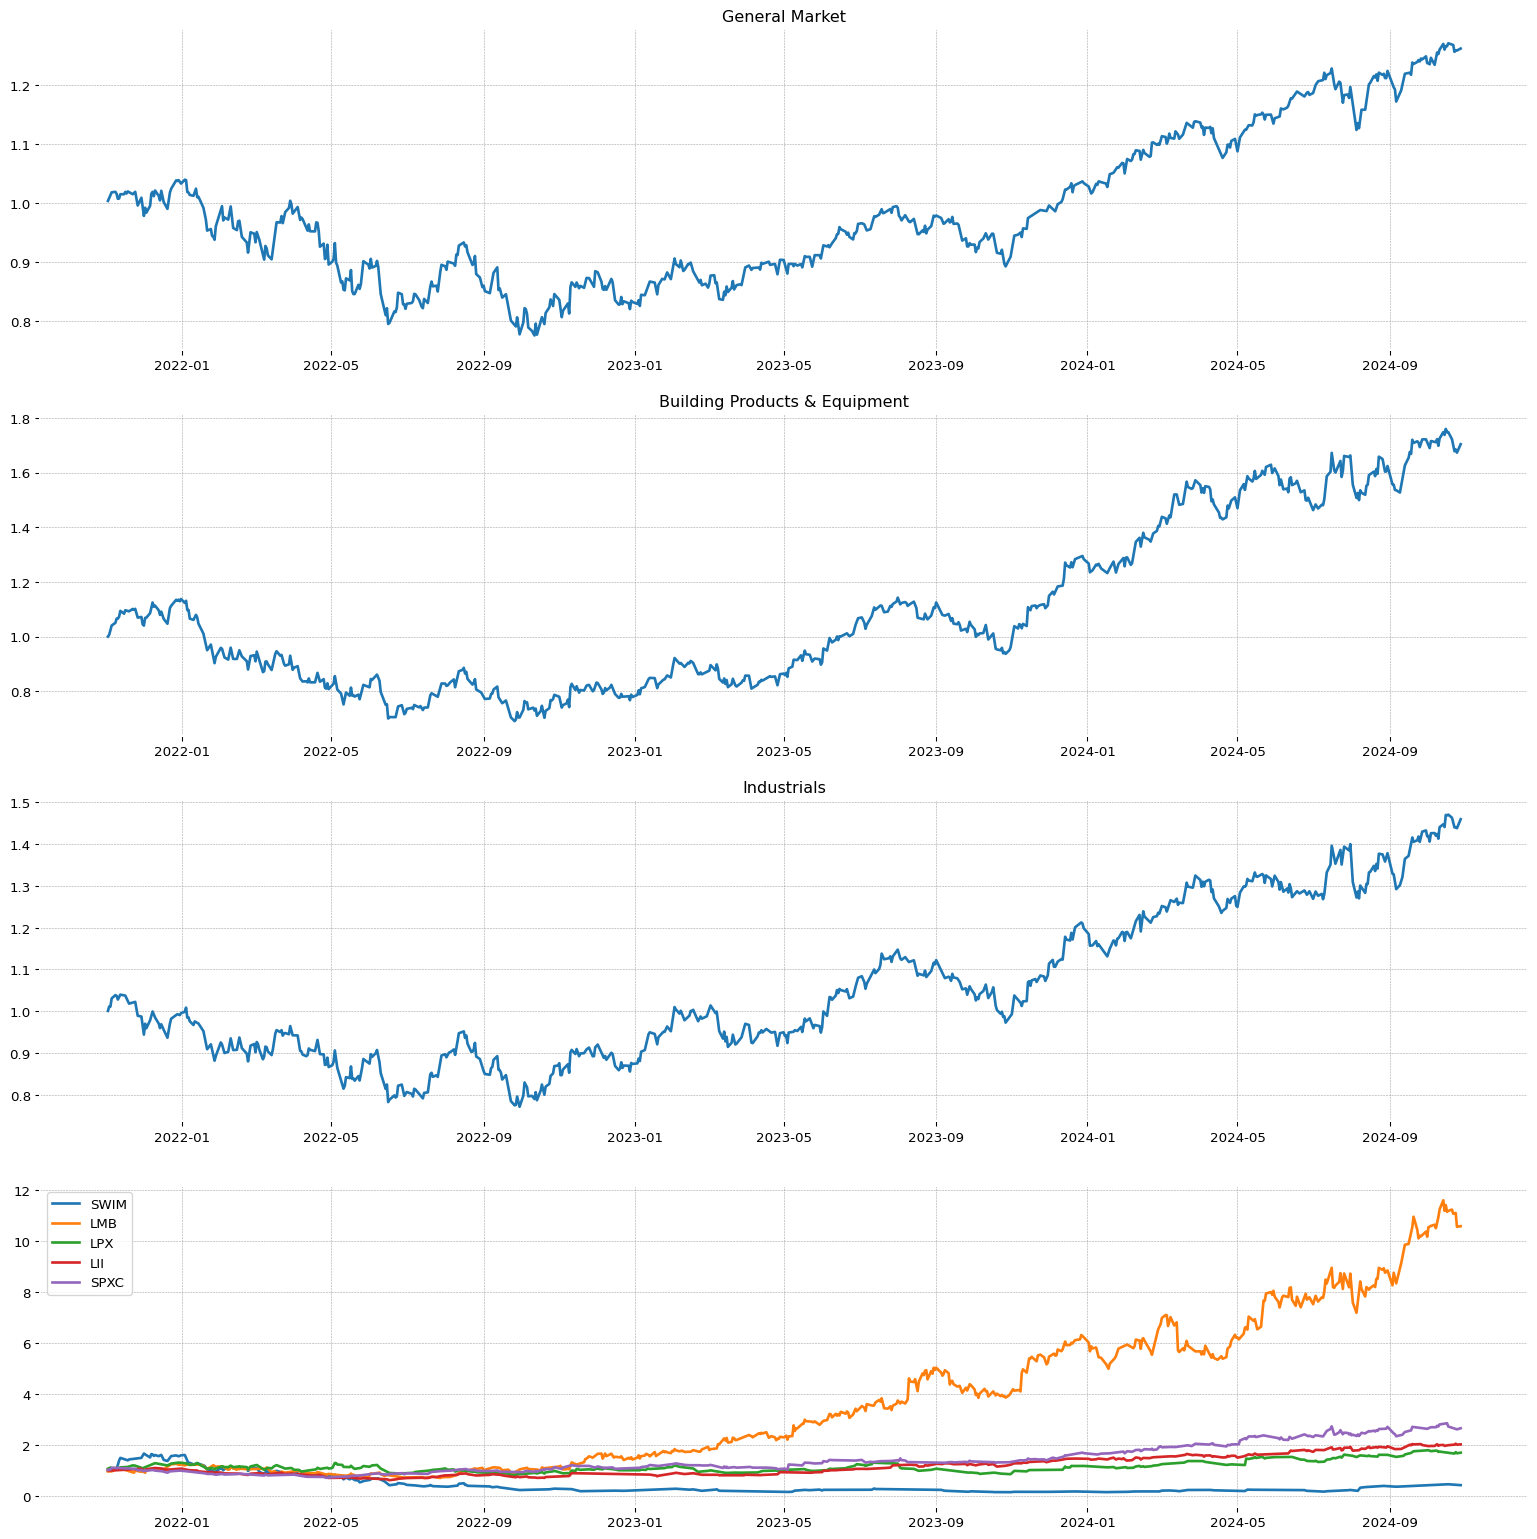 LENZ
LENZ
**** TECNICO ****
LENZ
| Total stock number: | 12.51M |
| Namee: | LENZ Therapeutics, Inc. |
| IPO date: | 2024-03-22 |
| Sector | Sector Position |
| Healthcare | 1/11 |
| Industry | Industry Position - | Stock on industry - | RSI Sector: |
| Biotechnology | 19/147 | 8/232 | 42/487 |


 JXN
JXN
FTAI
**** TECNICO ****
FTAI
| Total stock number: | 100.81M |
| Namee: | FTAI Aviation Ltd. |
| IPO date: | 2015-05-14 |
| Sector | Sector Position |
| Industrials | 7/11 |
| Industry | Industry Position - | Stock on industry - | RSI Sector: |
| Rental & Leasing Services | 74/147 | 1/17 | 10/402 |


 KKR
KKR
TT
**** TECNICO ****
TT
| Total stock number: | 224.95M |
| Namee: | Trane Technologies plc |
| IPO date: | 1980-03-17 |
| SMR | EPS | RS |
86.23 | 89.57 | 90 |
| Sector | Sector Position |
| Industrials | 7/11 |
| Industry | Industry Position - | Stock on industry - | RSI Sector: |
| Building Products & Equipment | 58/147 | 5/27 | 101/402 |


 QTWO
QTWO
**** TECNICO ****
QTWO
| Total stock number: | 58.61M |
| Namee: | Q2 Holdings, Inc. |
| IPO date: | 2014-03-20 |
| Sector | Sector Position |
| Technology | 2/11 |
| Industry | Industry Position - | Stock on industry - | RSI Sector: |
| Software - Application | 76/147 | 5/129 | 36/445 |
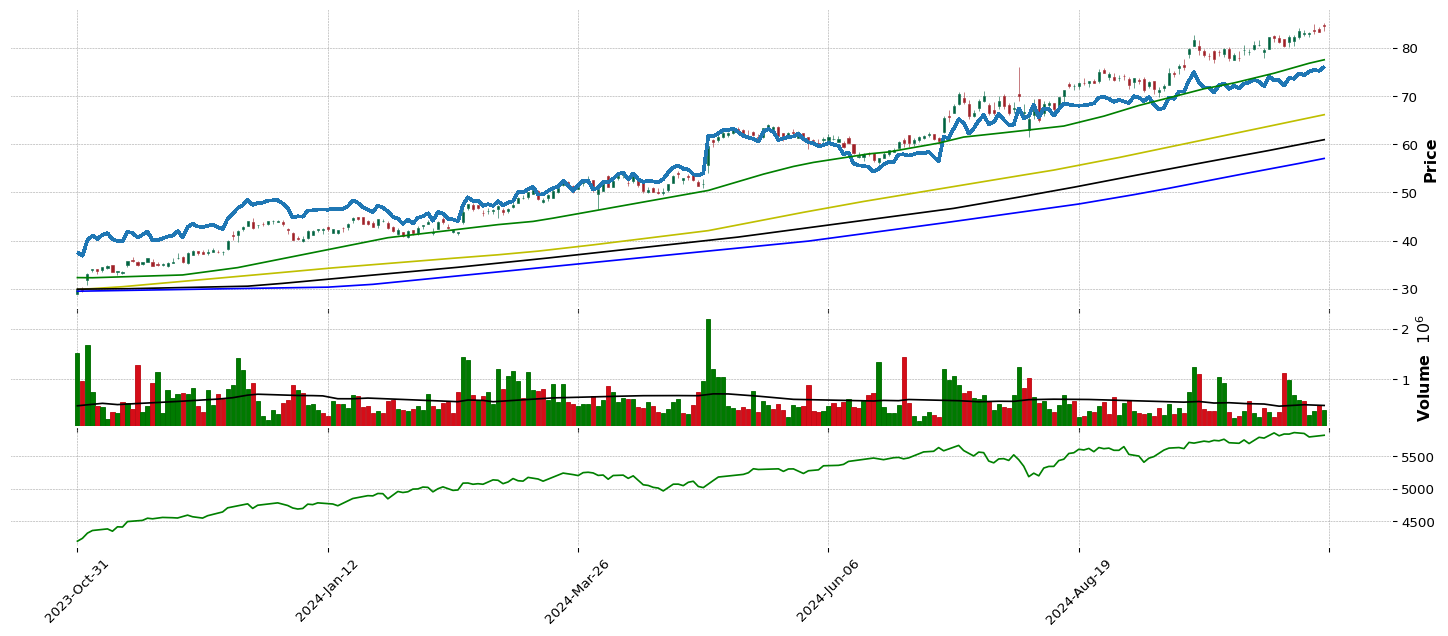
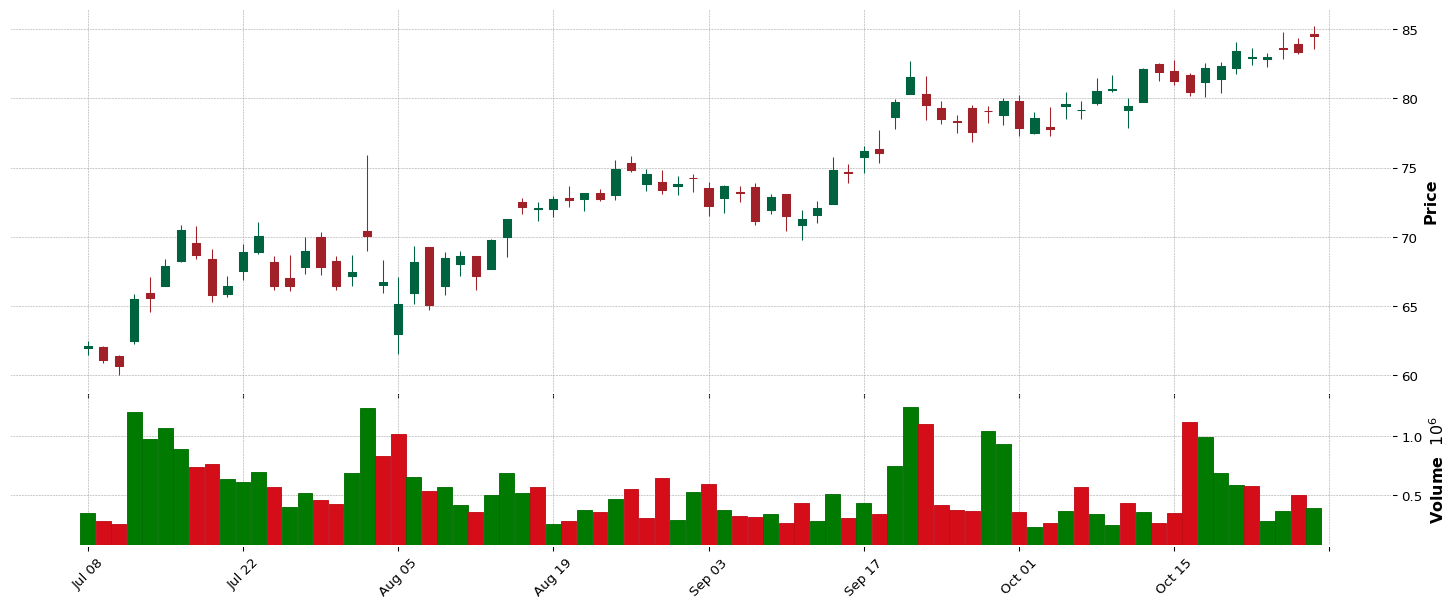
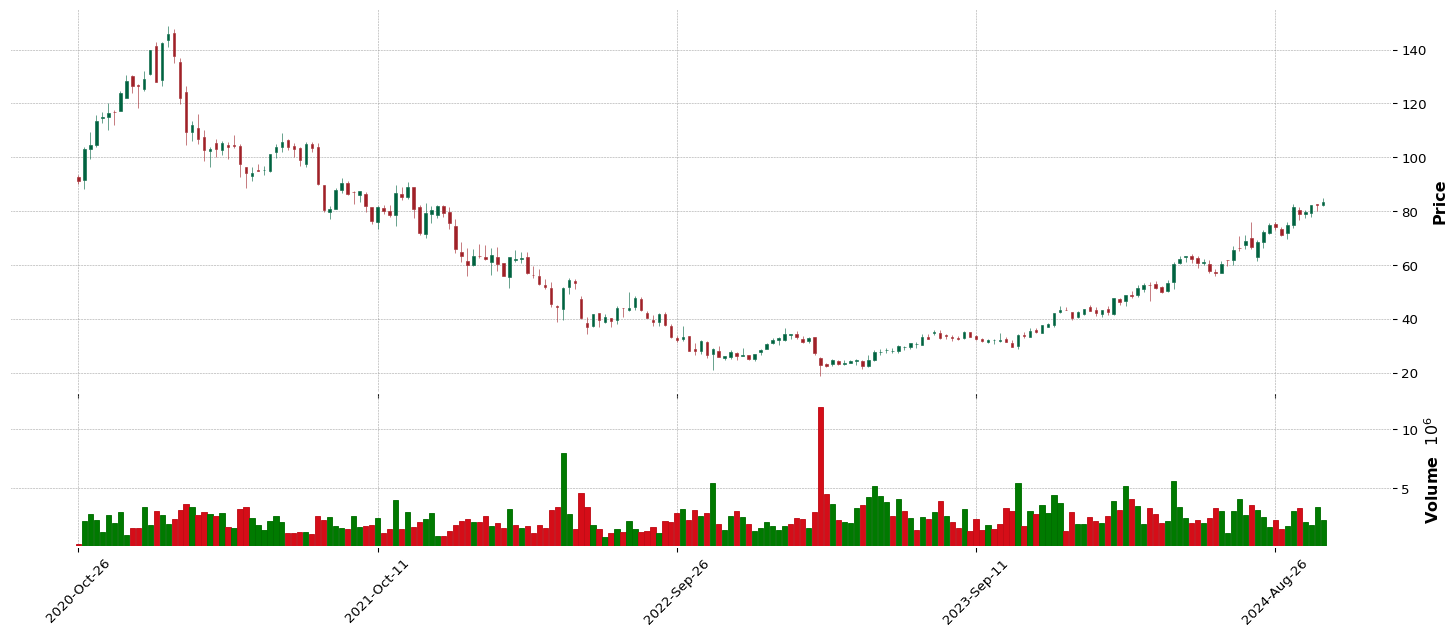
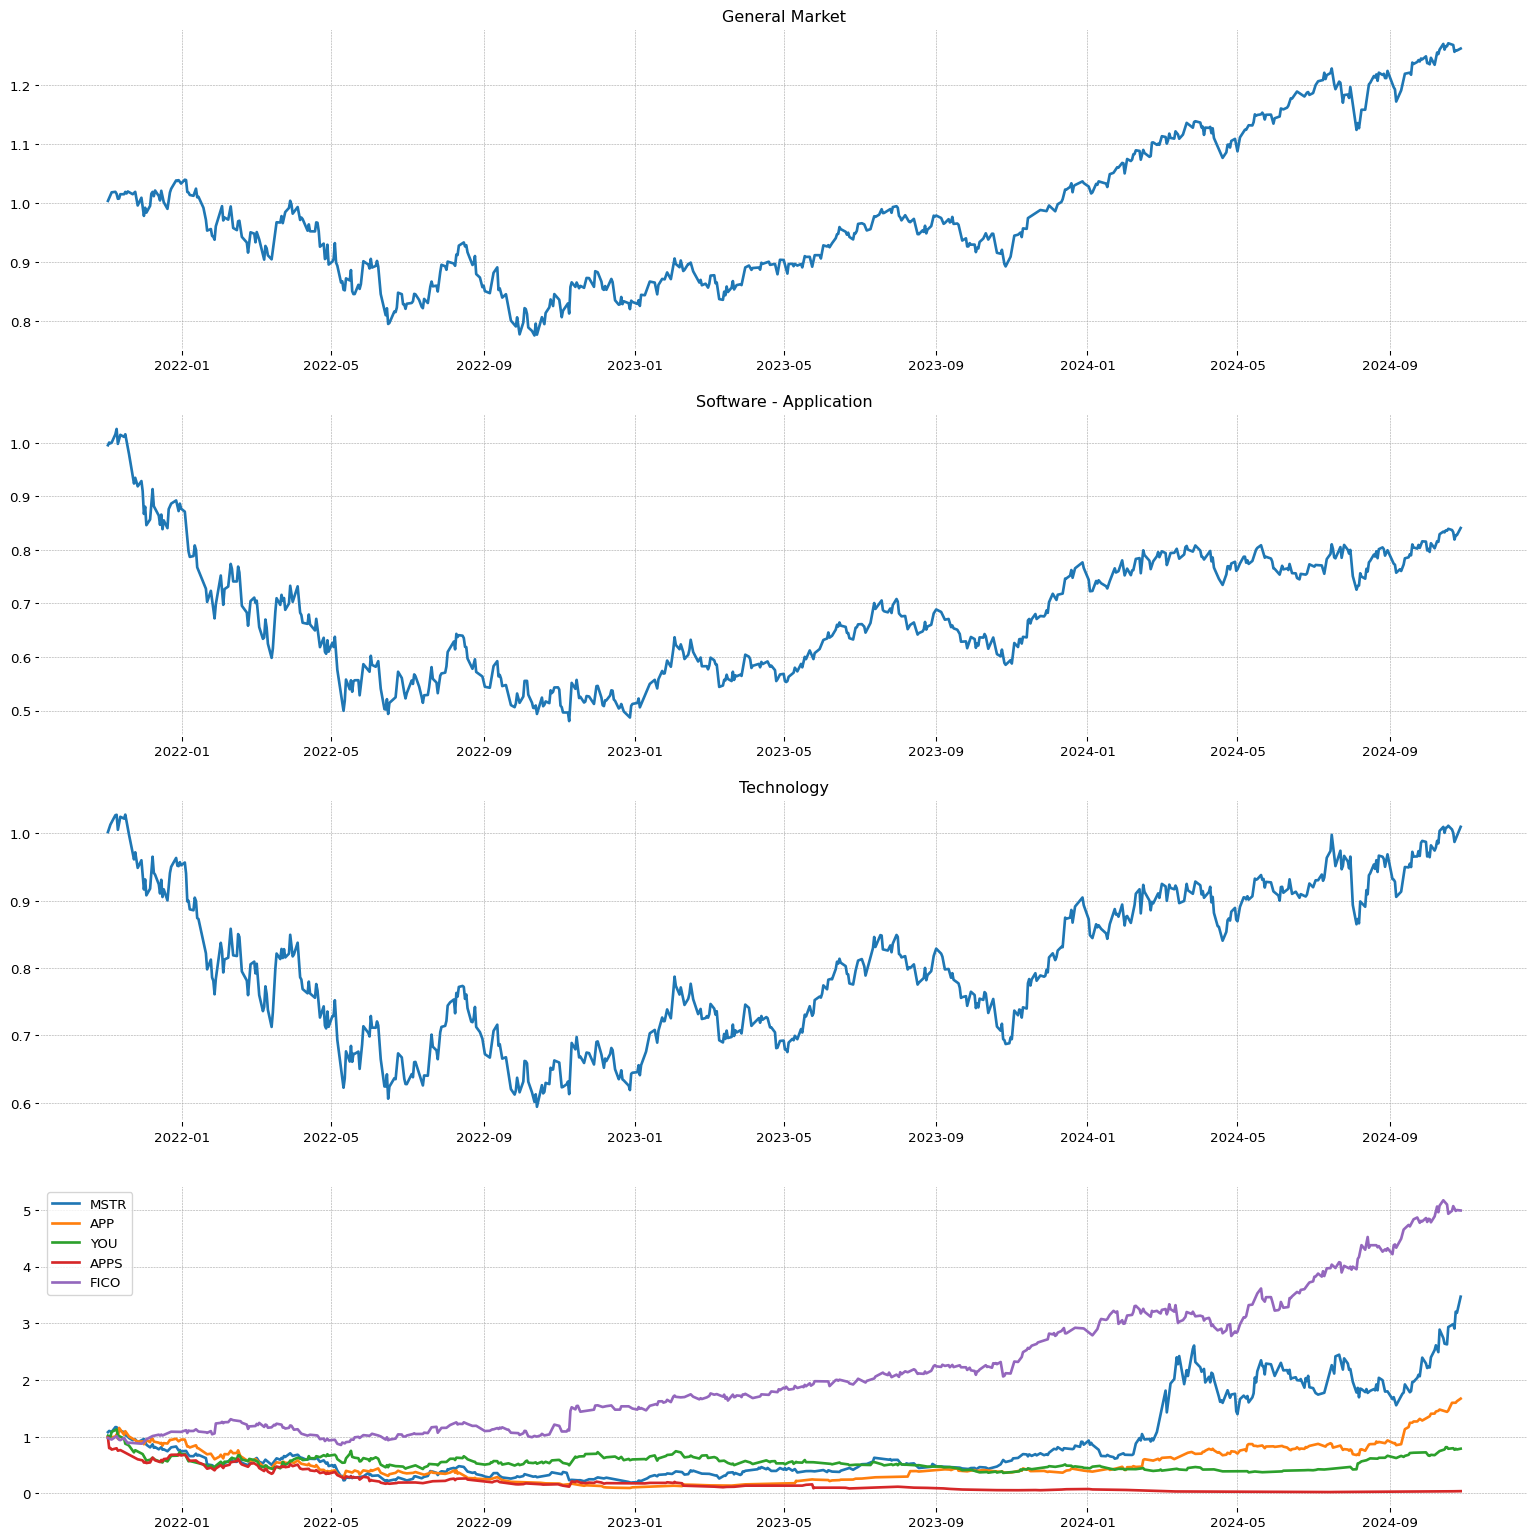 ARM
ARM
**** TECNICO ****
ARM
| Total stock number: | 123.31M |
| Namee: | Arm Holdings plc American Depositary Shares |
| IPO date: | 2023-09-14 |
| Sector | Sector Position |
| Technology | 2/11 |
| Industry | Industry Position - | Stock on industry - | RSI Sector: |
| Semiconductors | 79/147 | 4/47 | 43/445 |
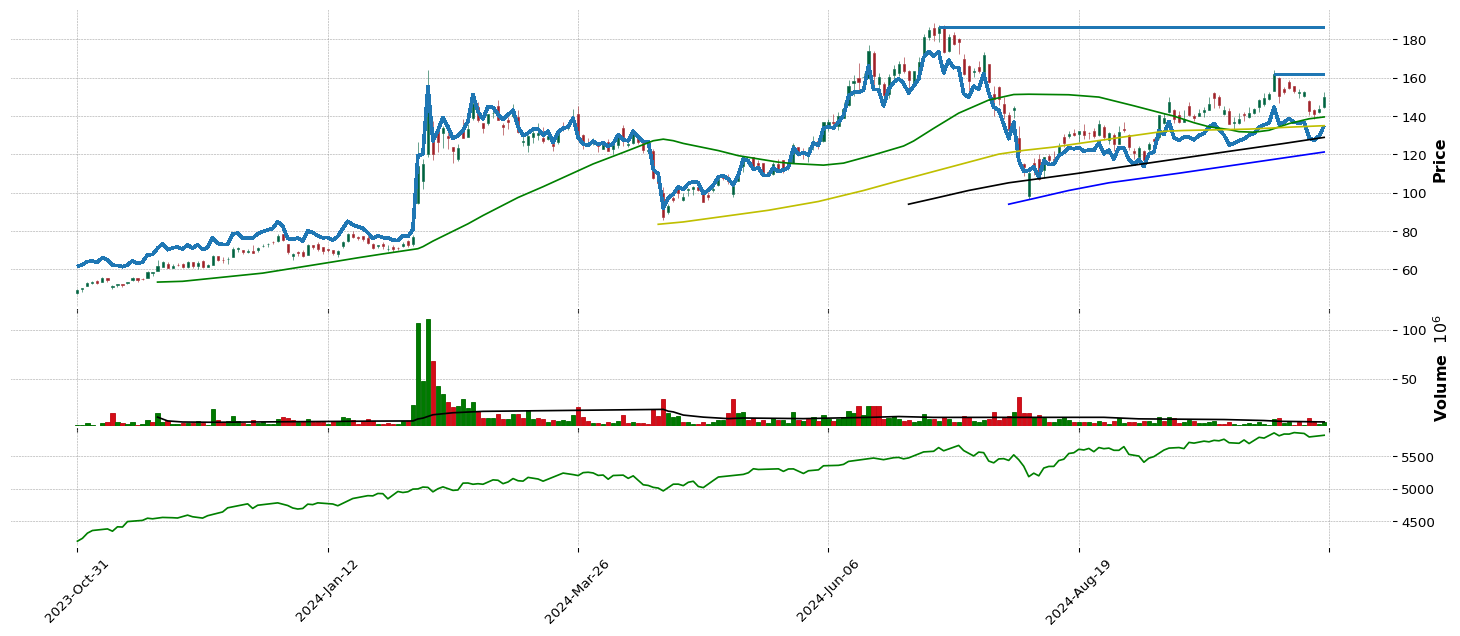
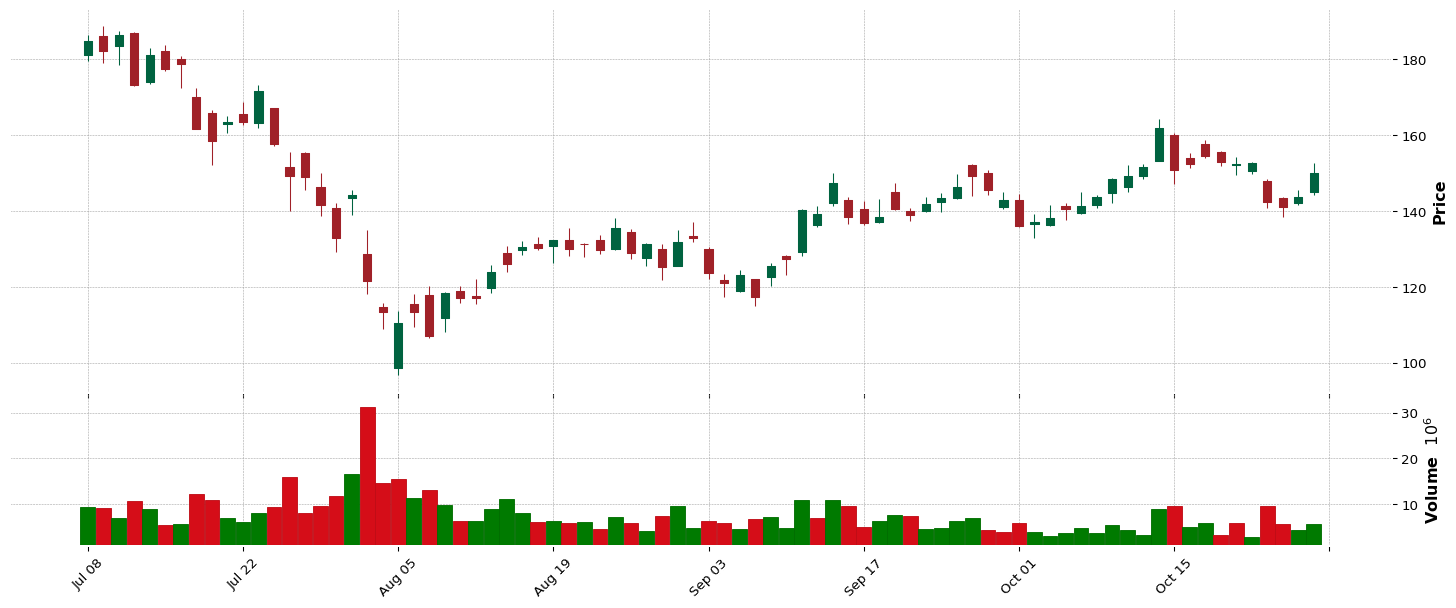
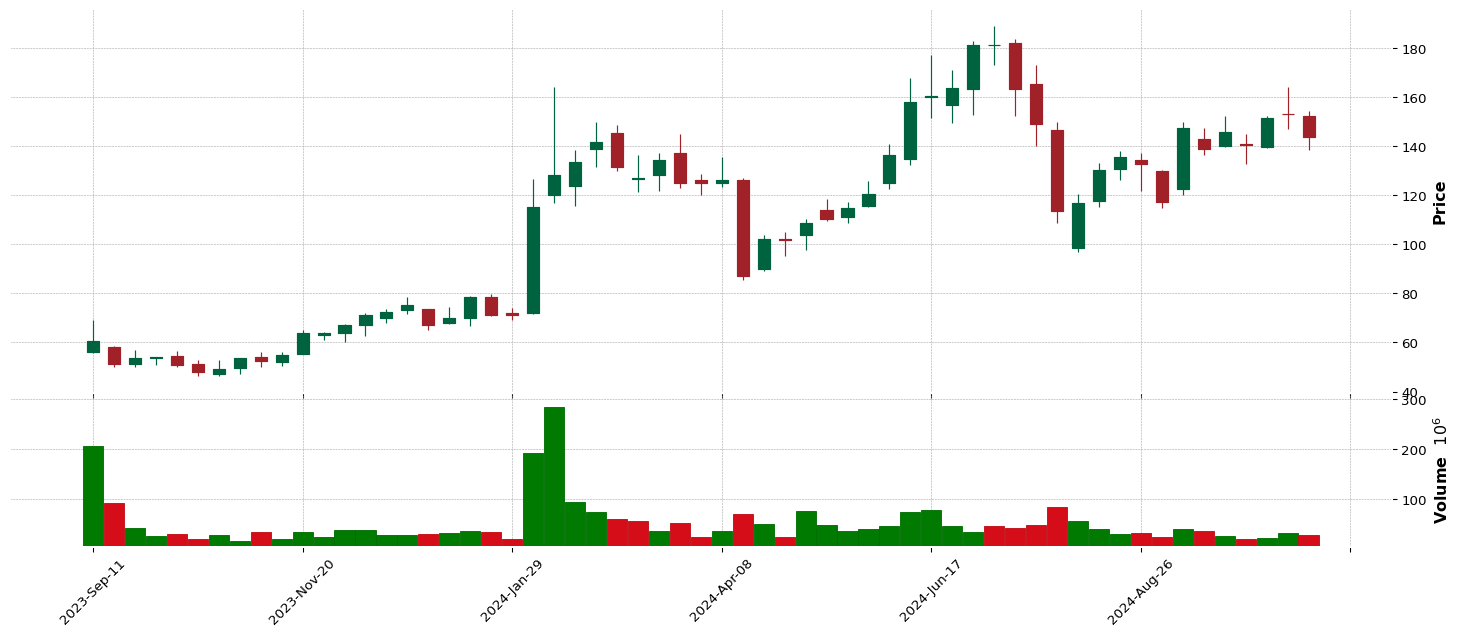
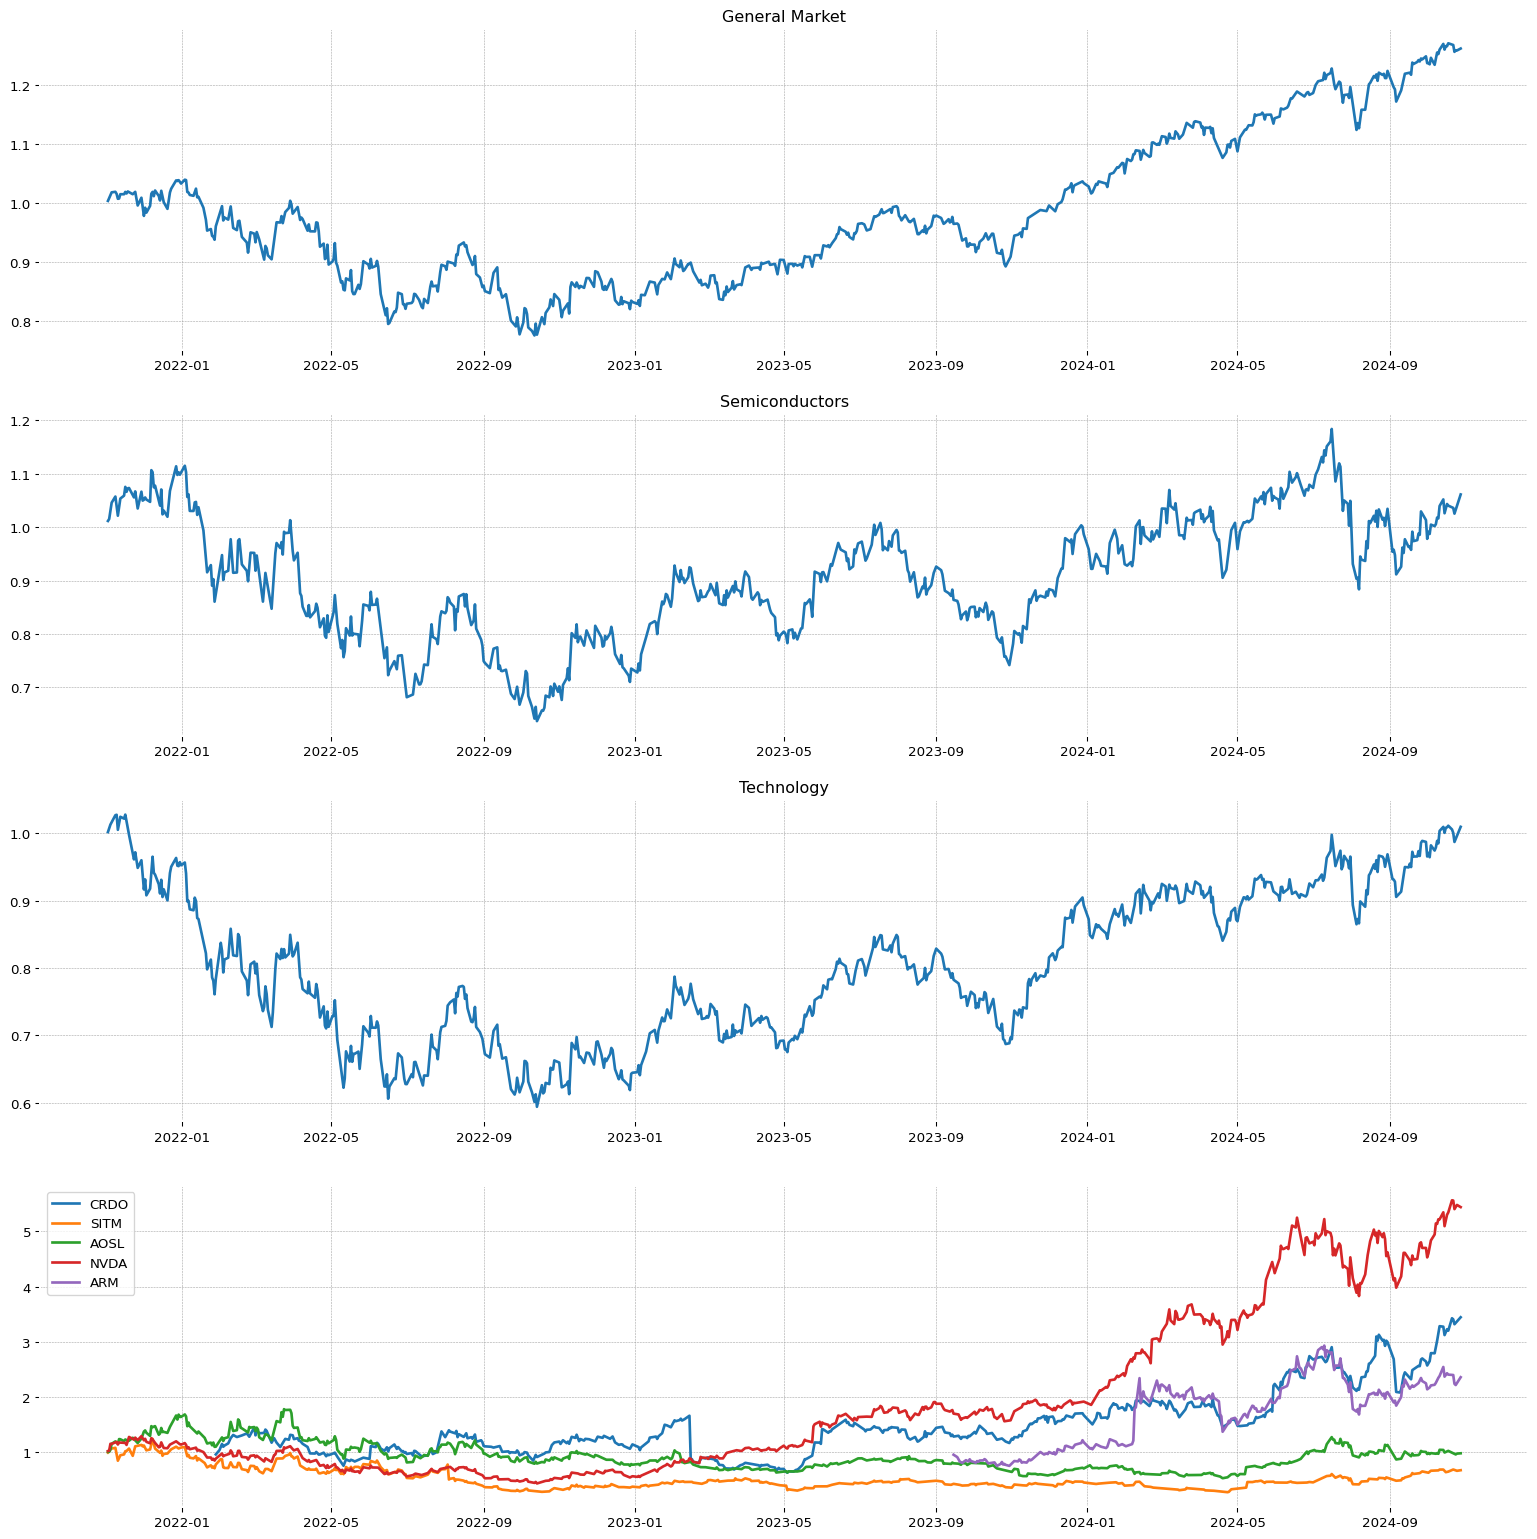 SFM
SFM
**** TECNICO ****
SFM
| Total stock number: | 99.69M |
| Namee: | Sprouts Farmers Market, Inc. |
| IPO date: | 2013-08-01 |
| Sector | Sector Position |
| Consumer Defensive | 10/11 |
| Industry | Industry Position - | Stock on industry - | RSI Sector: |
| Grocery Stores | 37/147 | 1/11 | 3/147 |
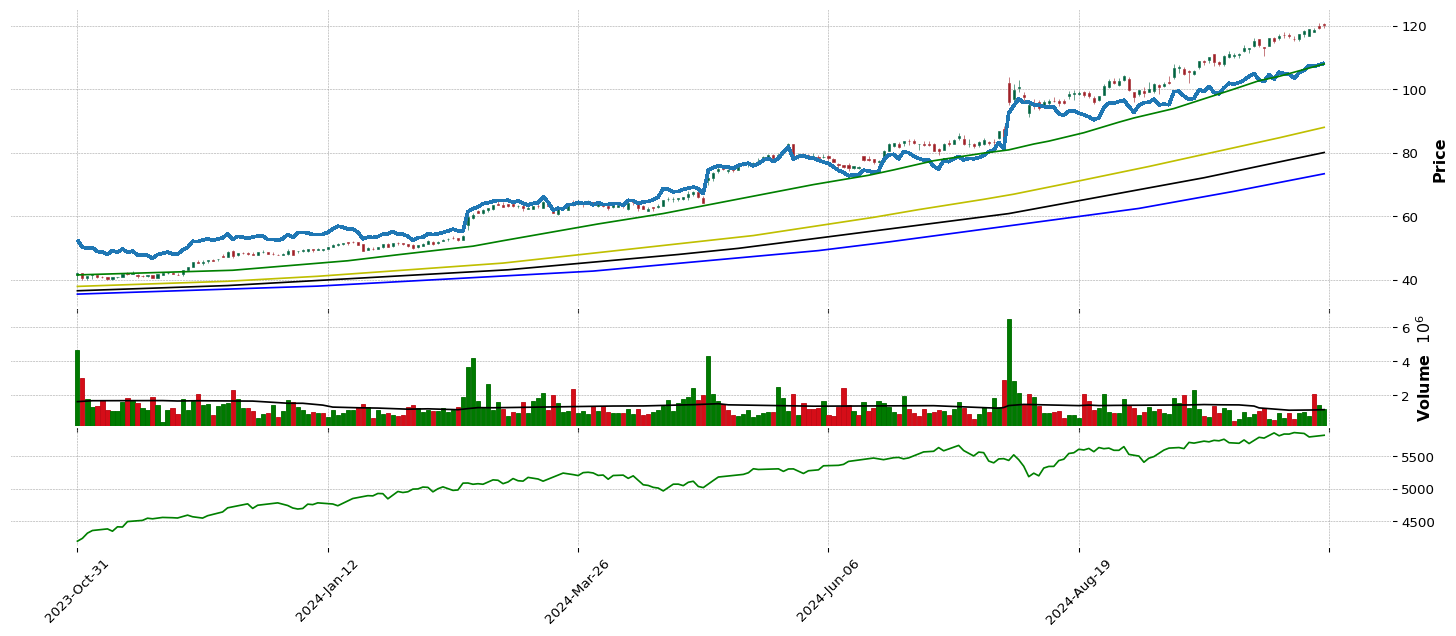
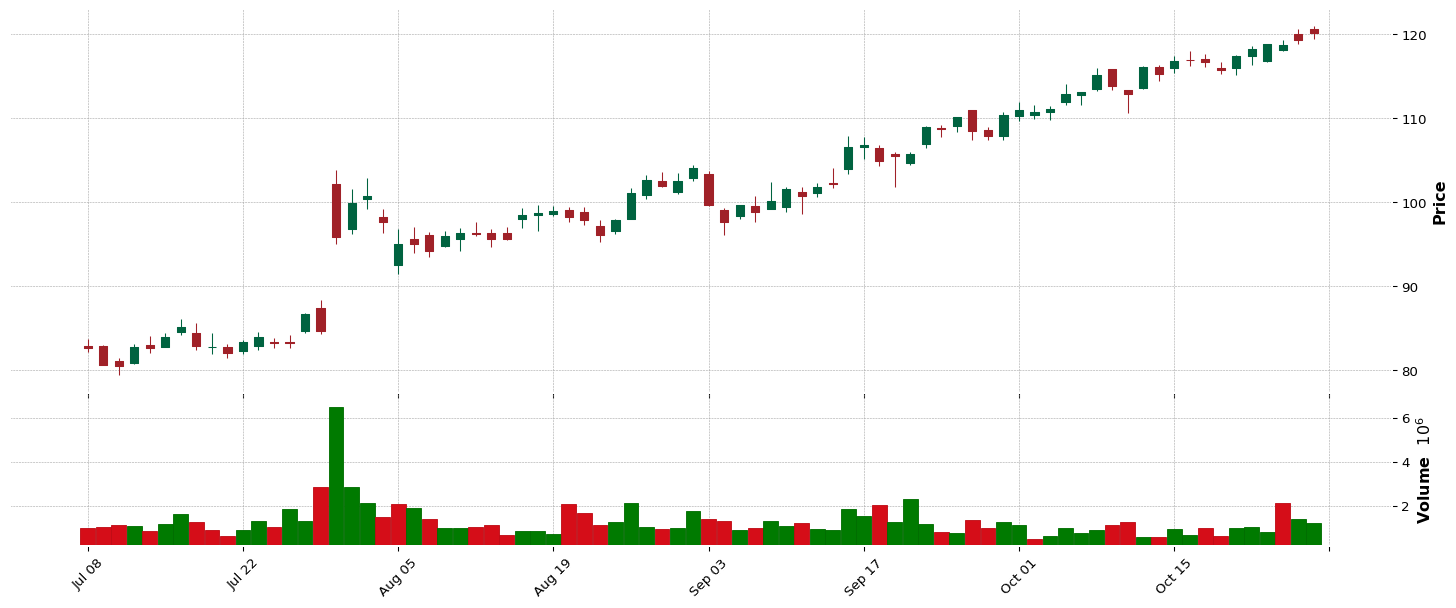
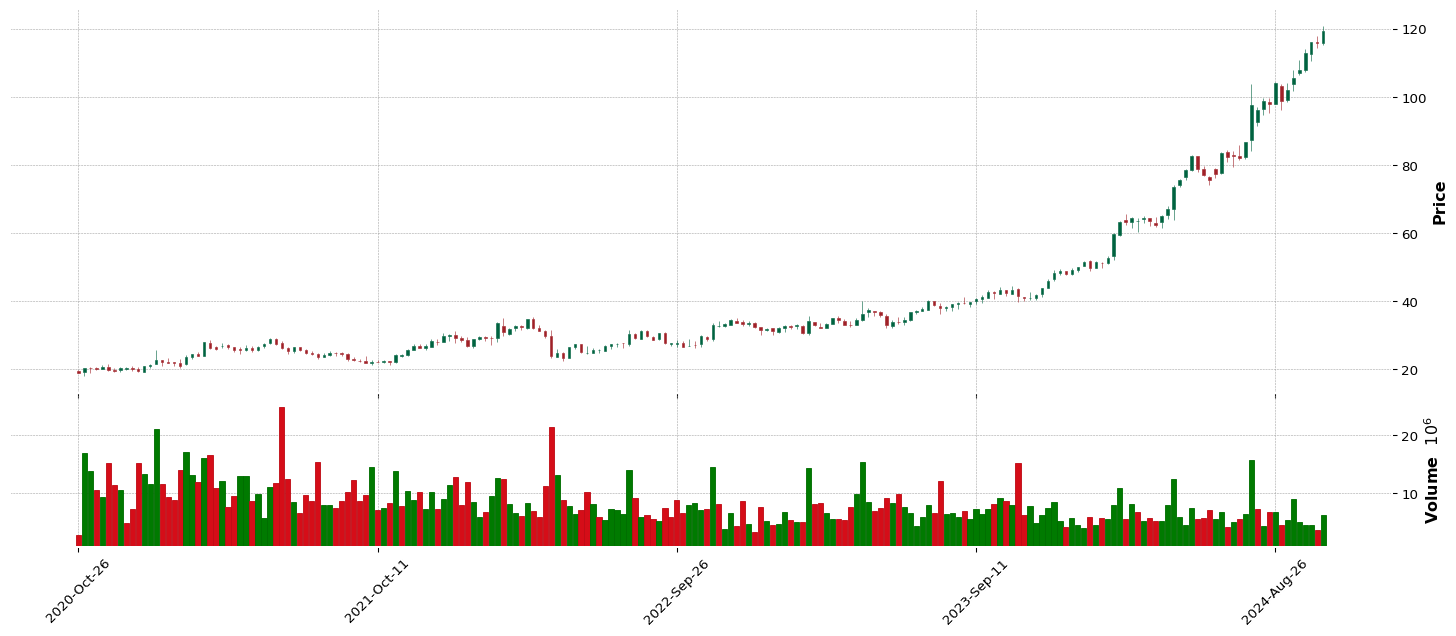
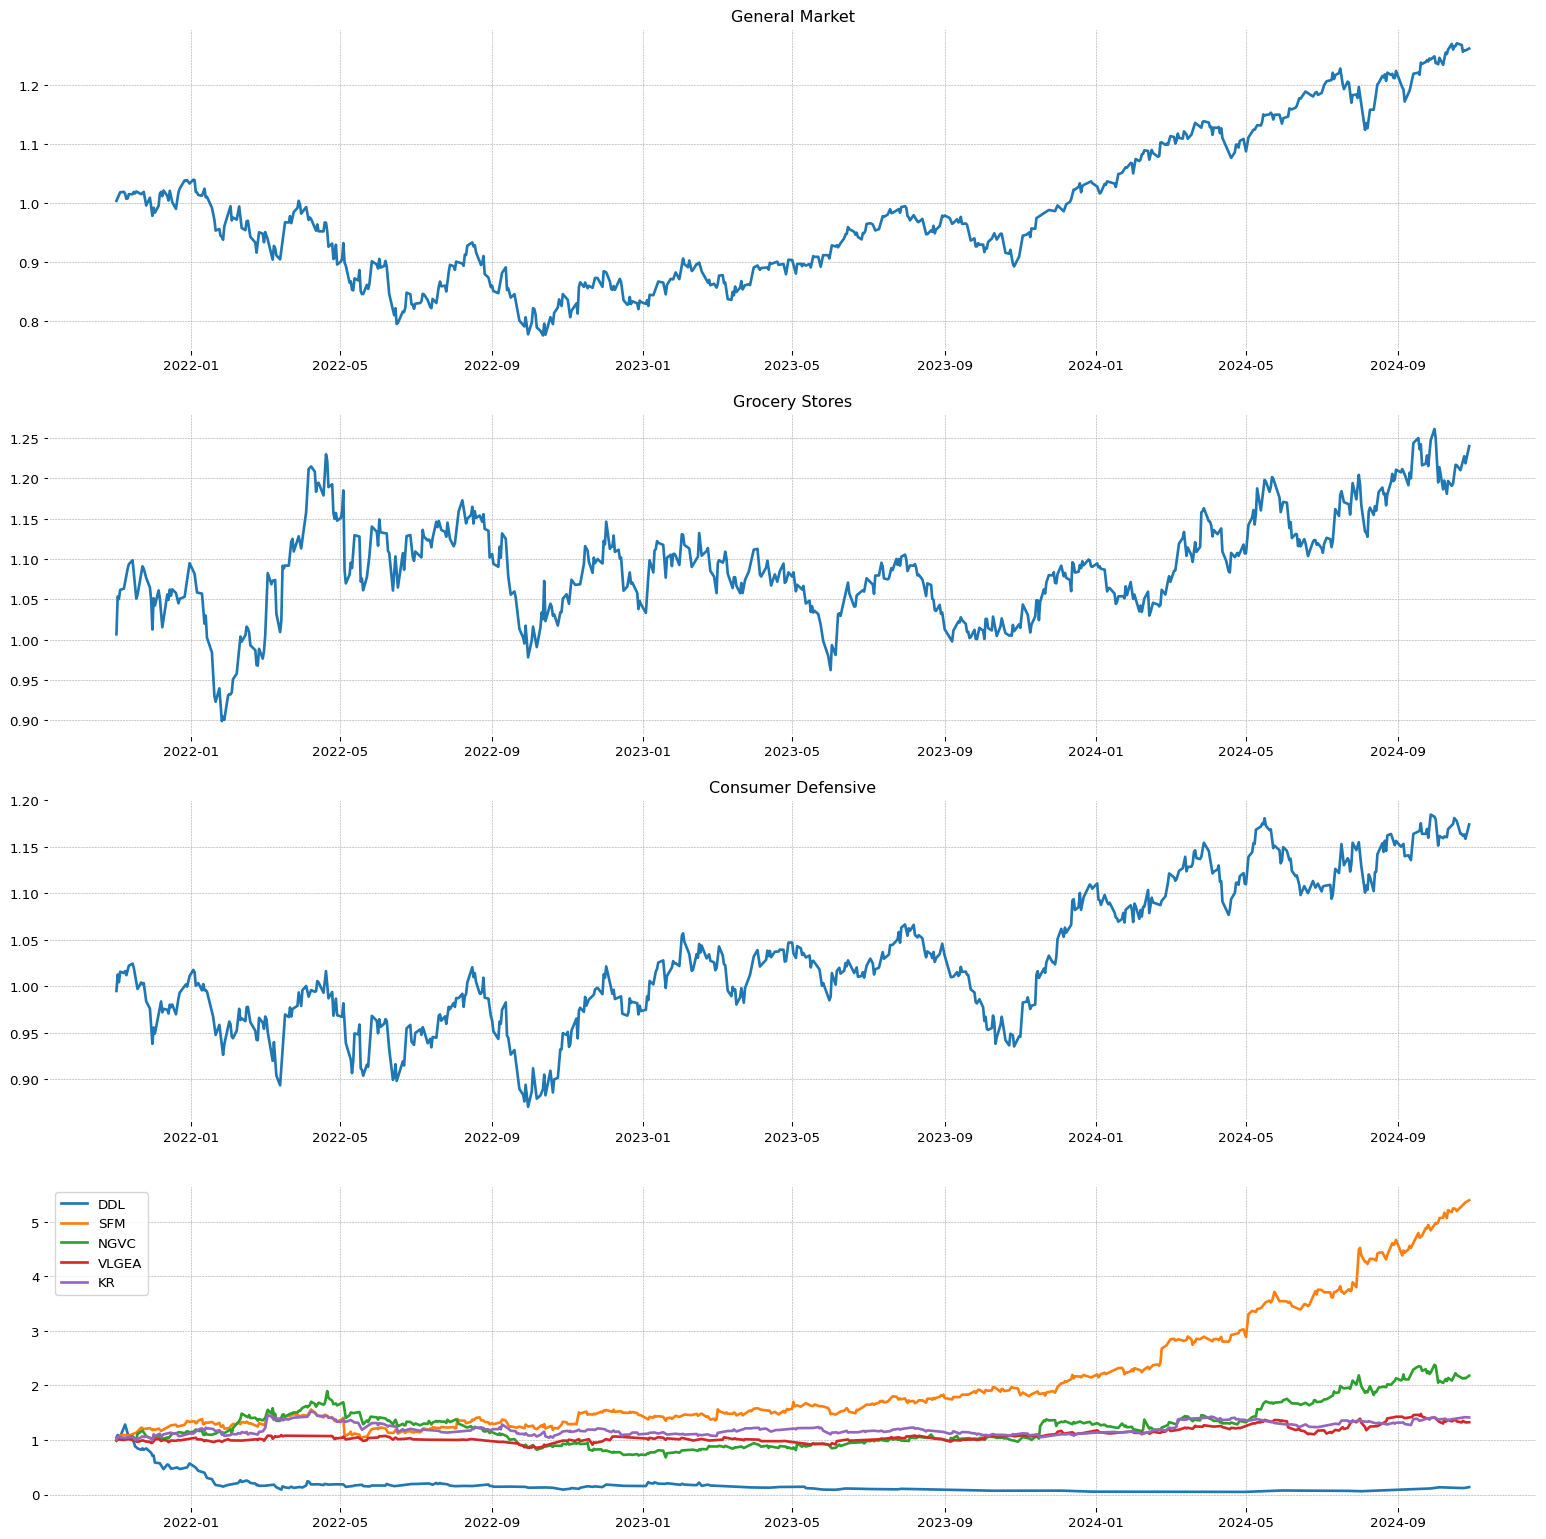 AGX
AGX
**** TECNICO ****
AGX
| Total stock number: | 12.91M |
| Namee: | Argan, Inc. |
| IPO date: | 1995-08-18 |
| Sector | Sector Position |
| Industrials | 7/11 |
| Industry | Industry Position - | Stock on industry - | RSI Sector: |
| Engineering & Construction | 21/147 | 3/31 | 9/402 |
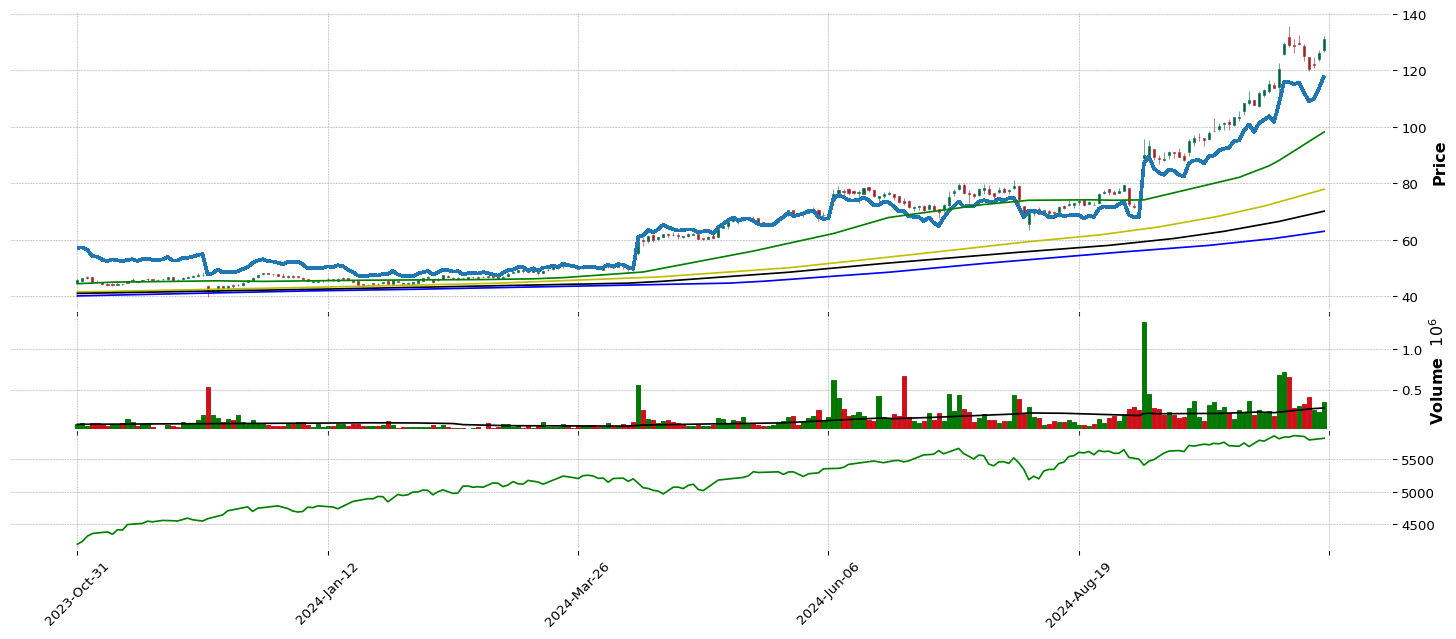
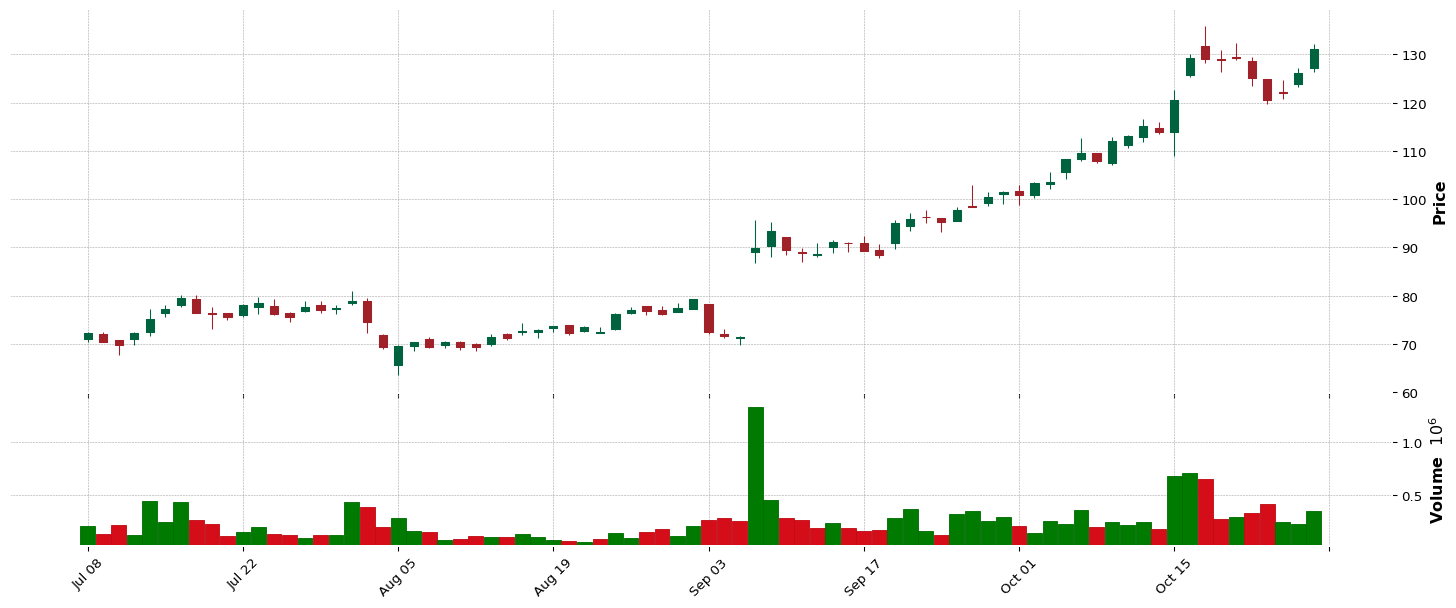
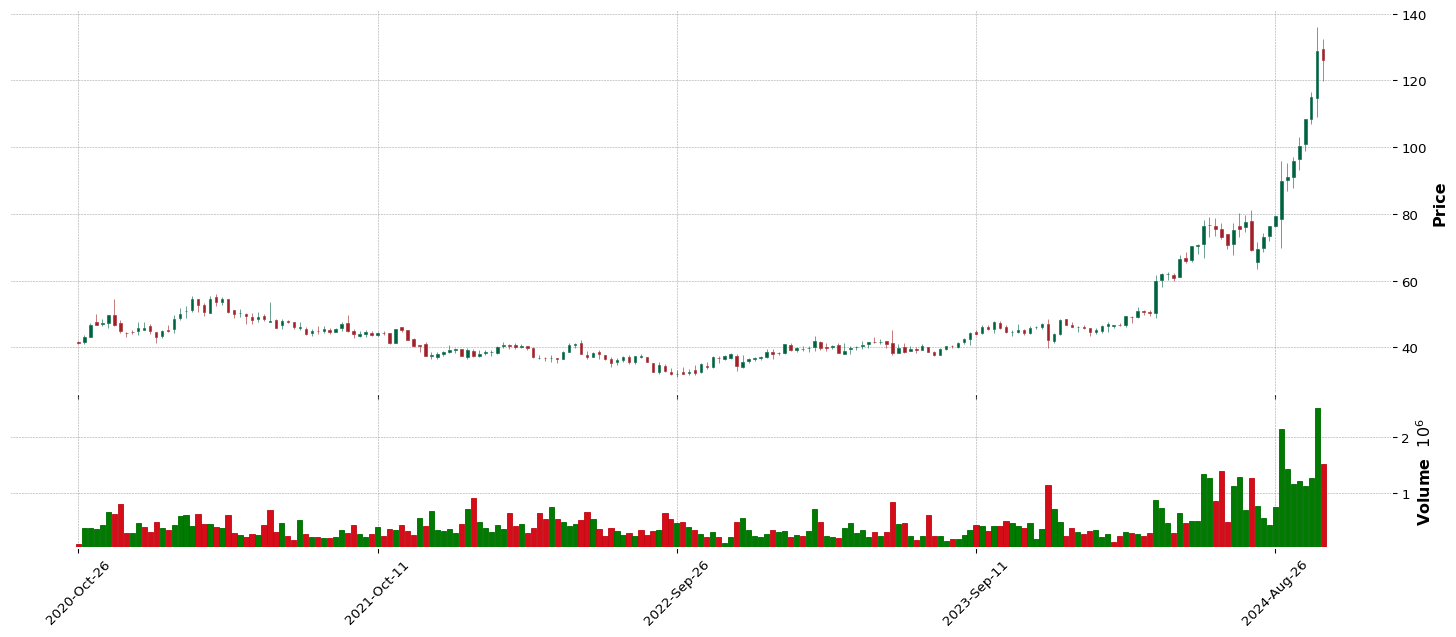
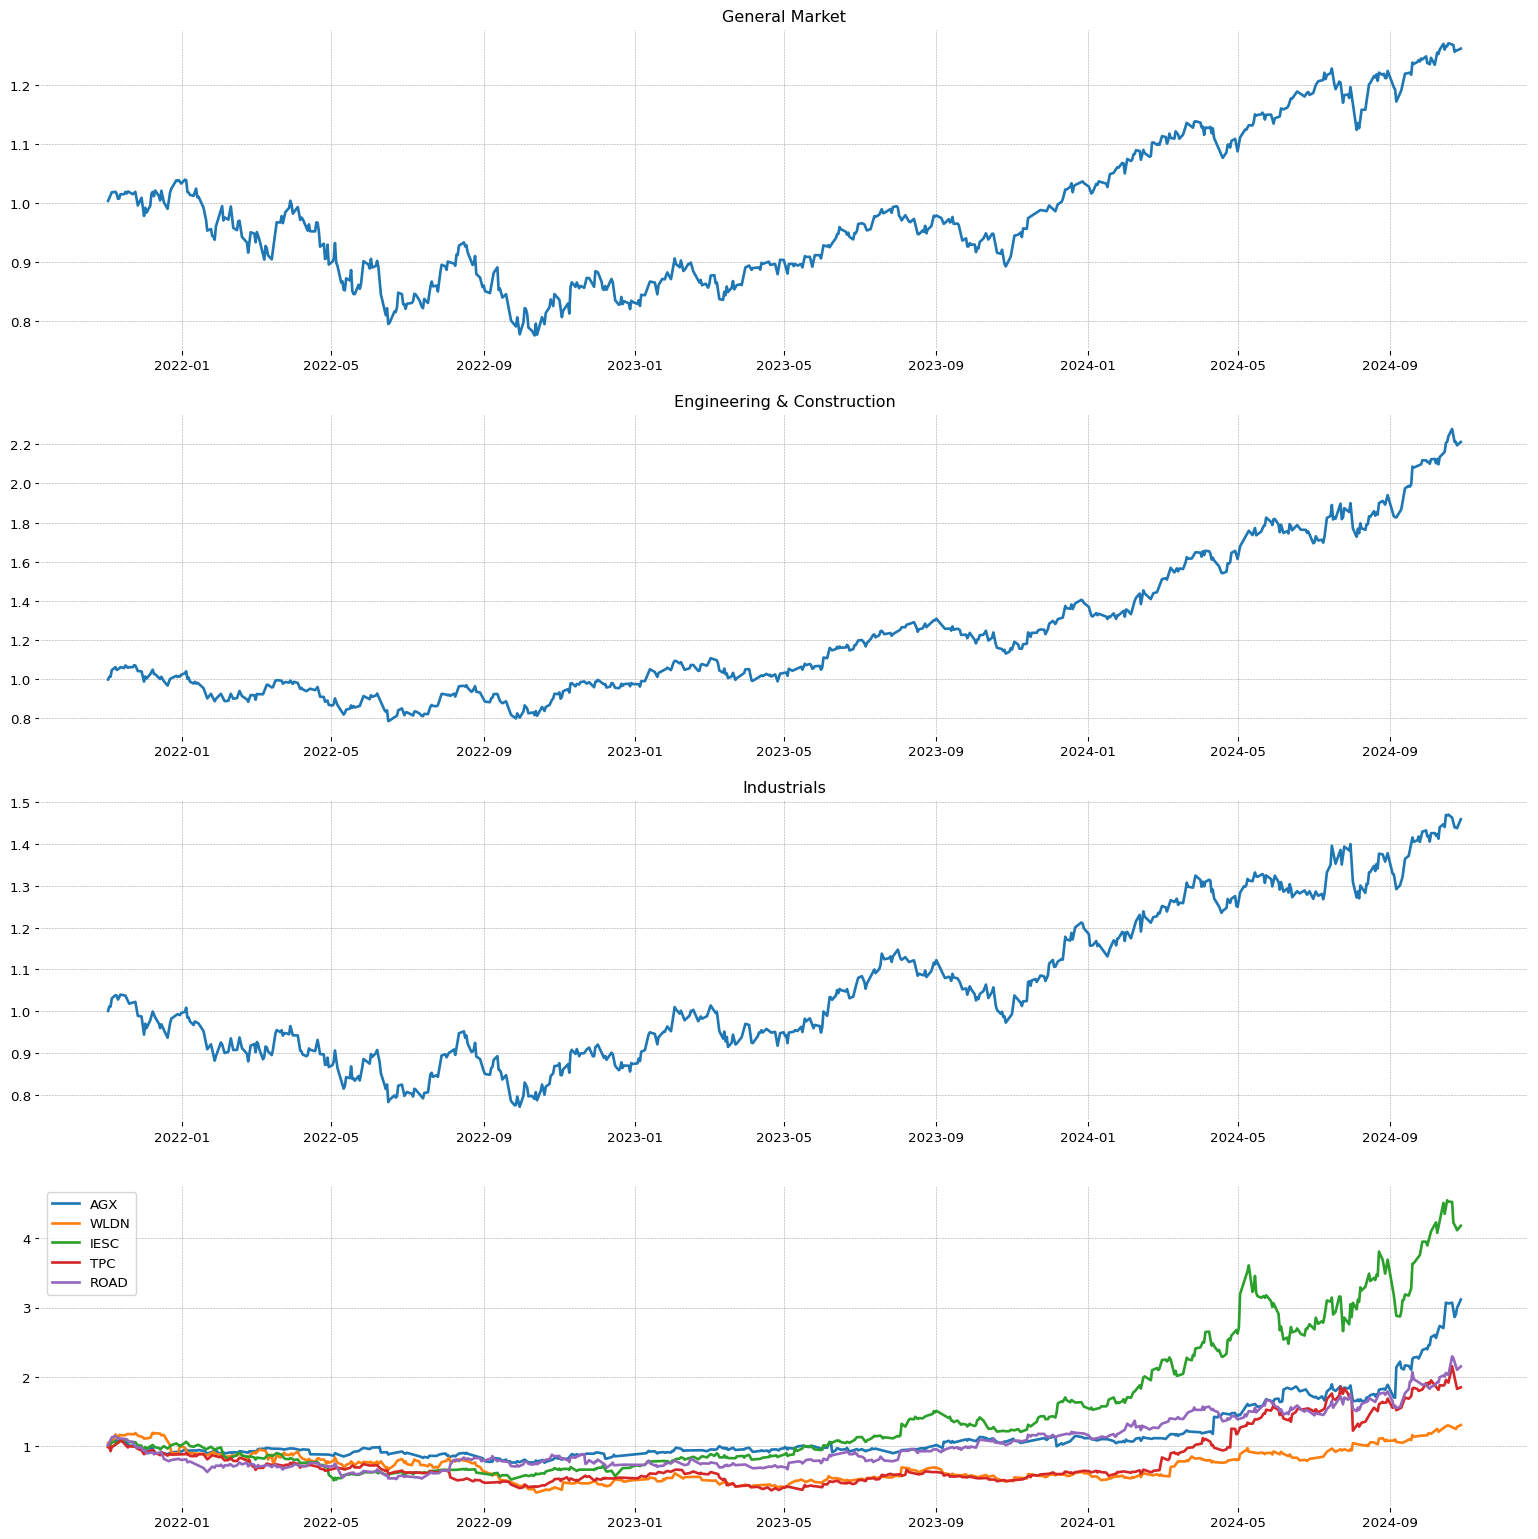 BV
BV
**** TECNICO ****
BV
| Total stock number: | 58.12M |
| Namee: | BrightView Holdings, Inc. |
| IPO date: | 2018-06-28 |
| SMR | EPS | RS |
18.28 | 29.35 | 94 |
| Sector | Sector Position |
| Industrials | 7/11 |
| Industry | Industry Position - | Stock on industry - | RSI Sector: |
| Specialty Business Services | 98/147 | 1/22 | 43/402 |
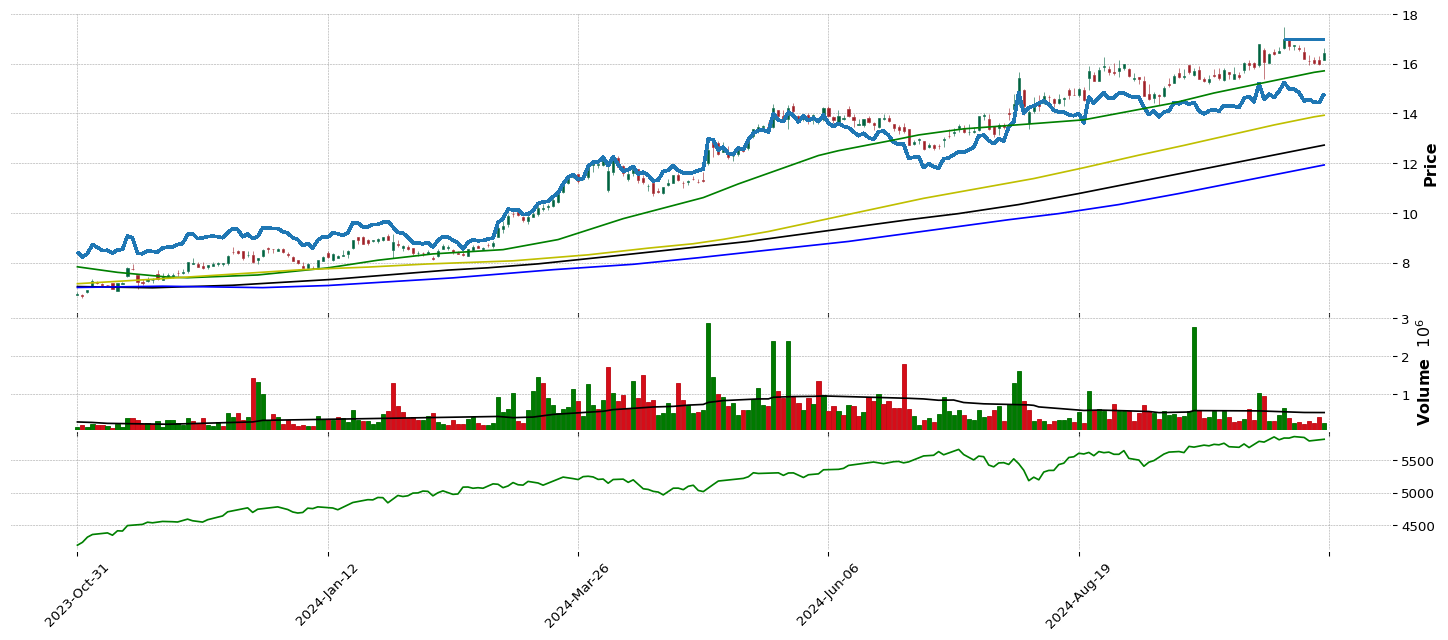
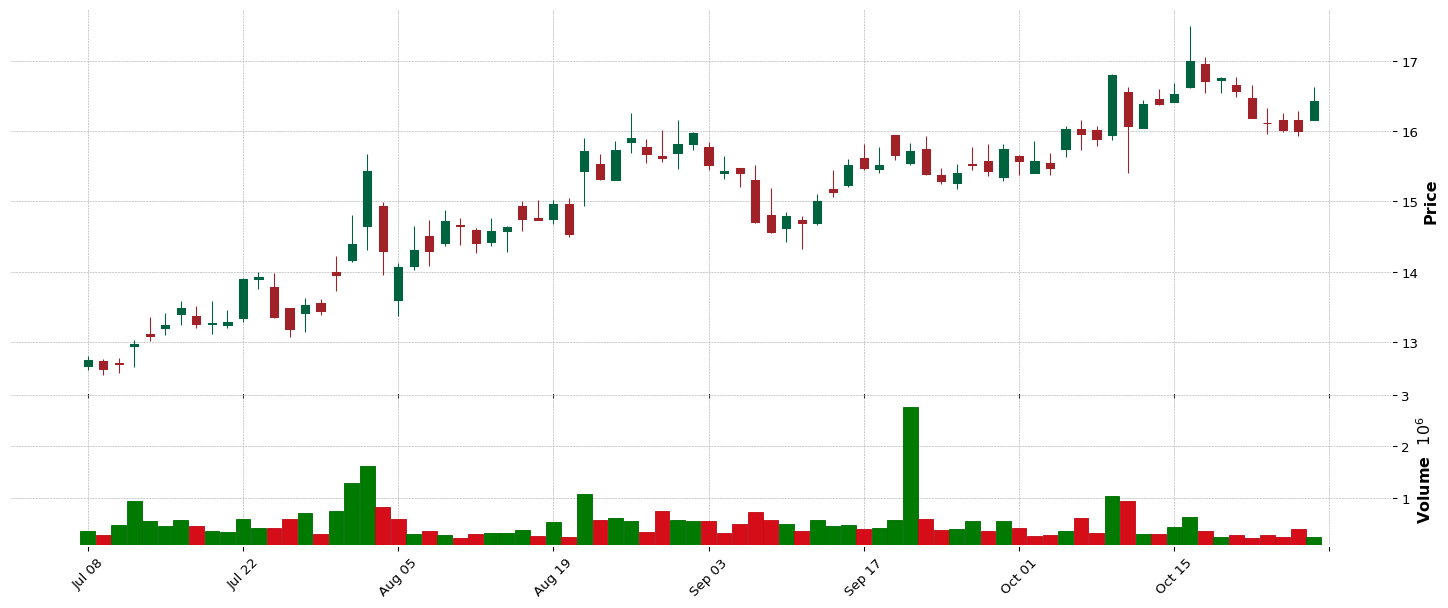
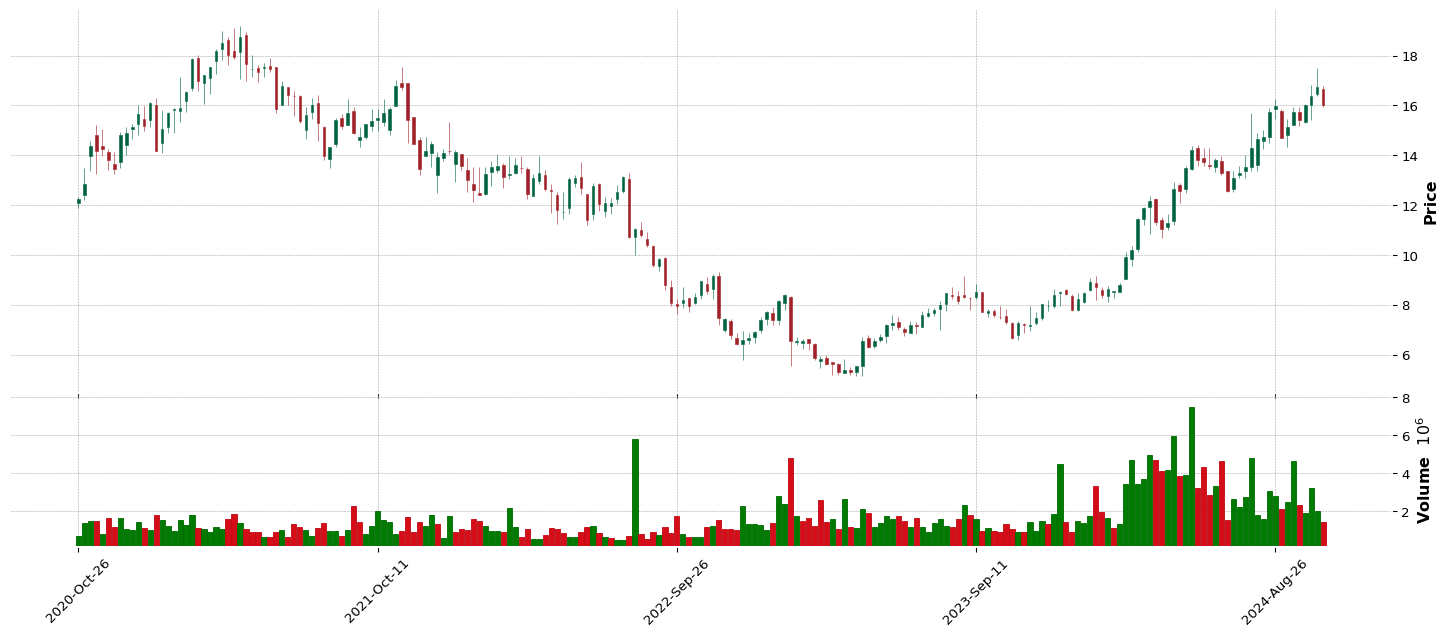
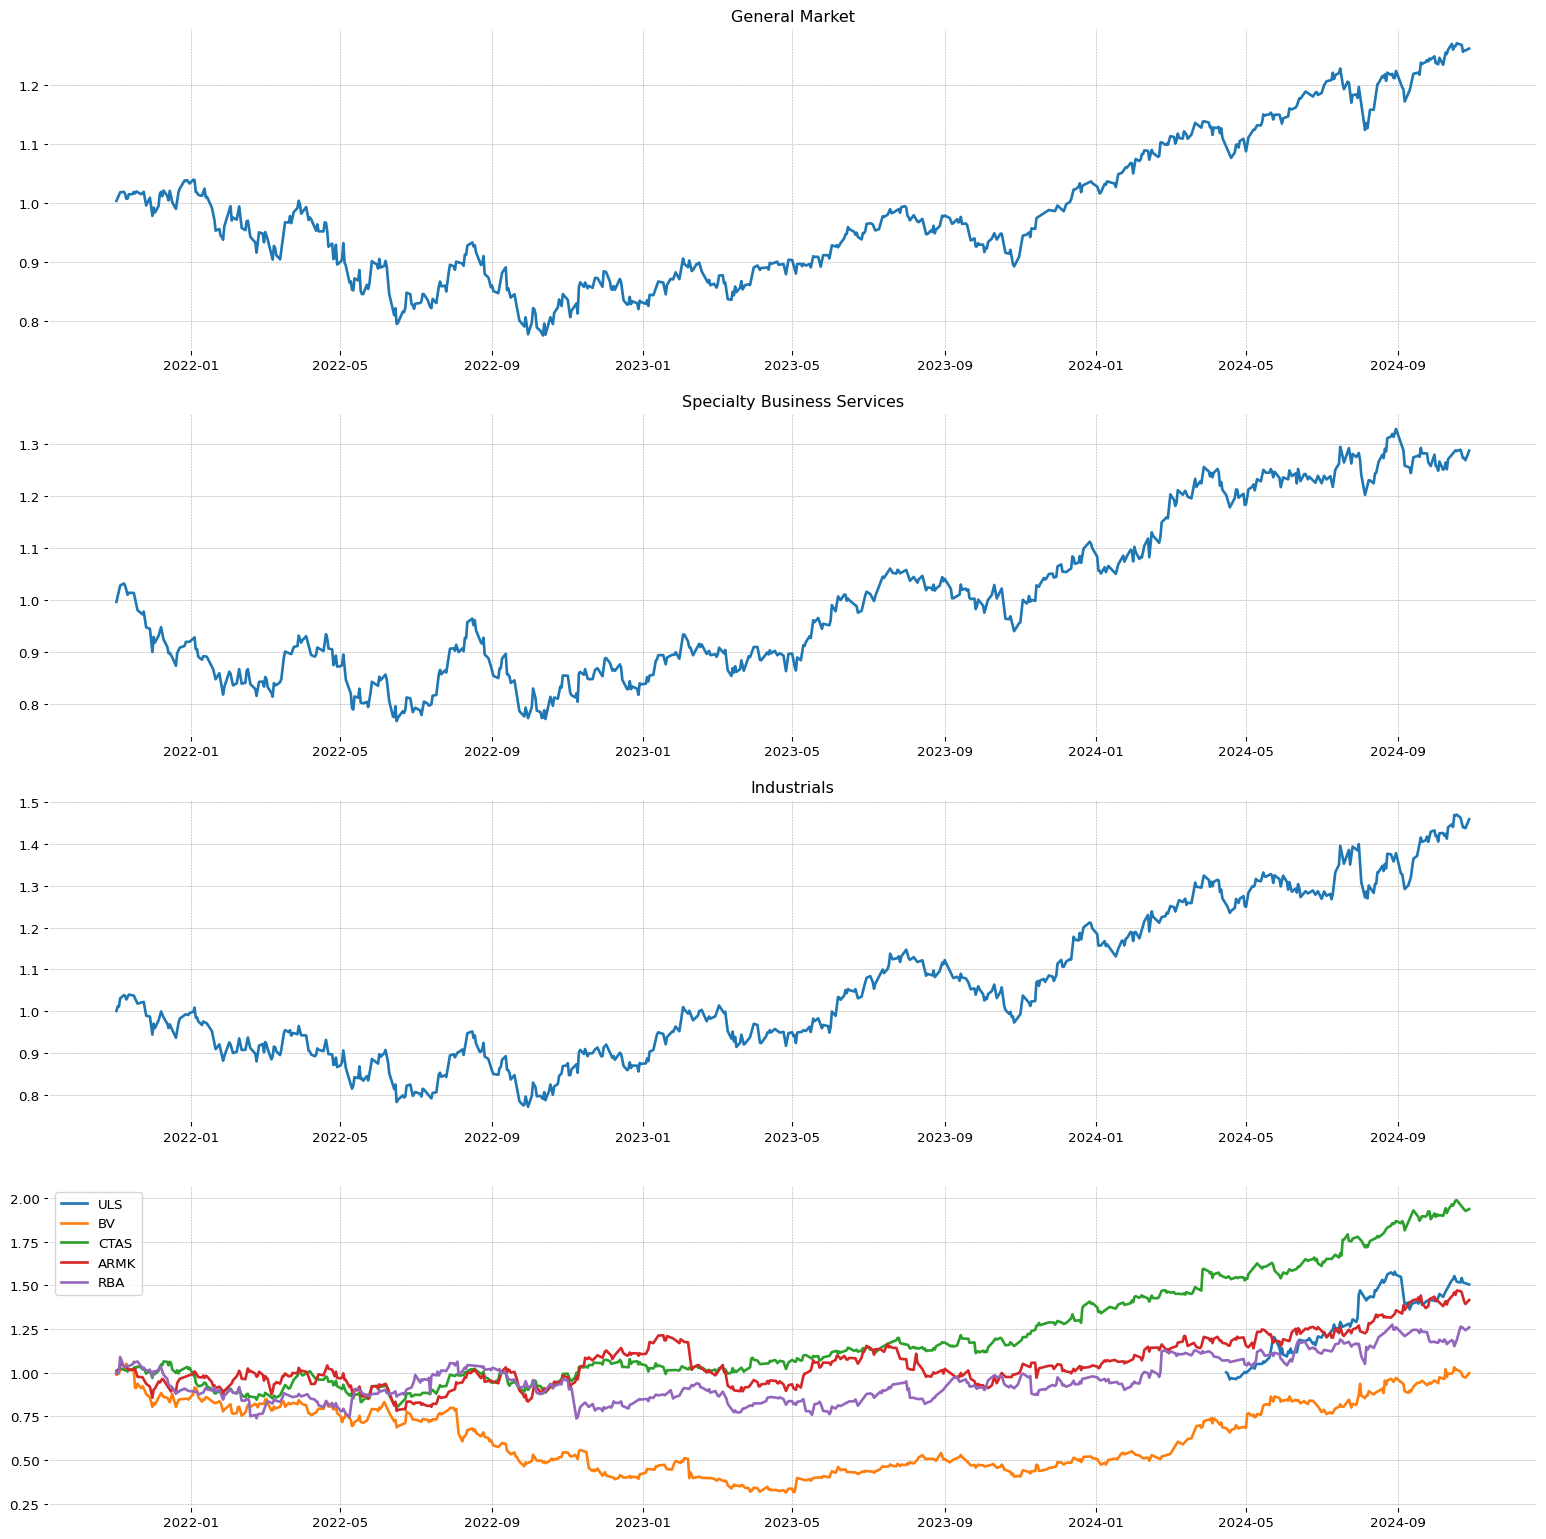 QFIN
QFIN
TOL
**** TECNICO ****
TOL
| Total stock number: | 100.31M |
| Namee: | Toll Brothers, Inc. |
| IPO date: | 1986-07-08 |
| SMR | EPS | RS |
72.31 | 89.48 | 91 |
| Sector | Sector Position |
| Consumer Cyclical | 6/11 |
| Industry | Industry Position - | Stock on industry - | RSI Sector: |
| Residential Construction | 42/147 | 2/19 | 86/351 |


 HBB
HBB
**** TECNICO ****
HBB
| Total stock number: | 6.37M |
| Namee: | Hamilton Beach Brands Holding Company |
| IPO date: | 2017-09-26 |
| SMR | EPS | RS |
86.65 | 72.74 | 94 |
| Sector | Sector Position |
| Consumer Cyclical | 6/11 |
| Industry | Industry Position - | Stock on industry - | RSI Sector: |
| Furnishings, Fixtures & Appliances | 32/147 | 3/14 | 34/351 |


 MLI
MLI
**** TECNICO ****
MLI
| Total stock number: | 110.8M |
| Namee: | Mueller Industries, Inc. |
| IPO date: | 1991-02-25 |
| SMR | EPS | RS |
12.25 | 63.13 | 92 |
| Sector | Sector Position |
| Industrials | 7/11 |
| Industry | Industry Position - | Stock on industry - | RSI Sector: |
| Metal Fabrication | 26/147 | 3/12 | 40/402 |
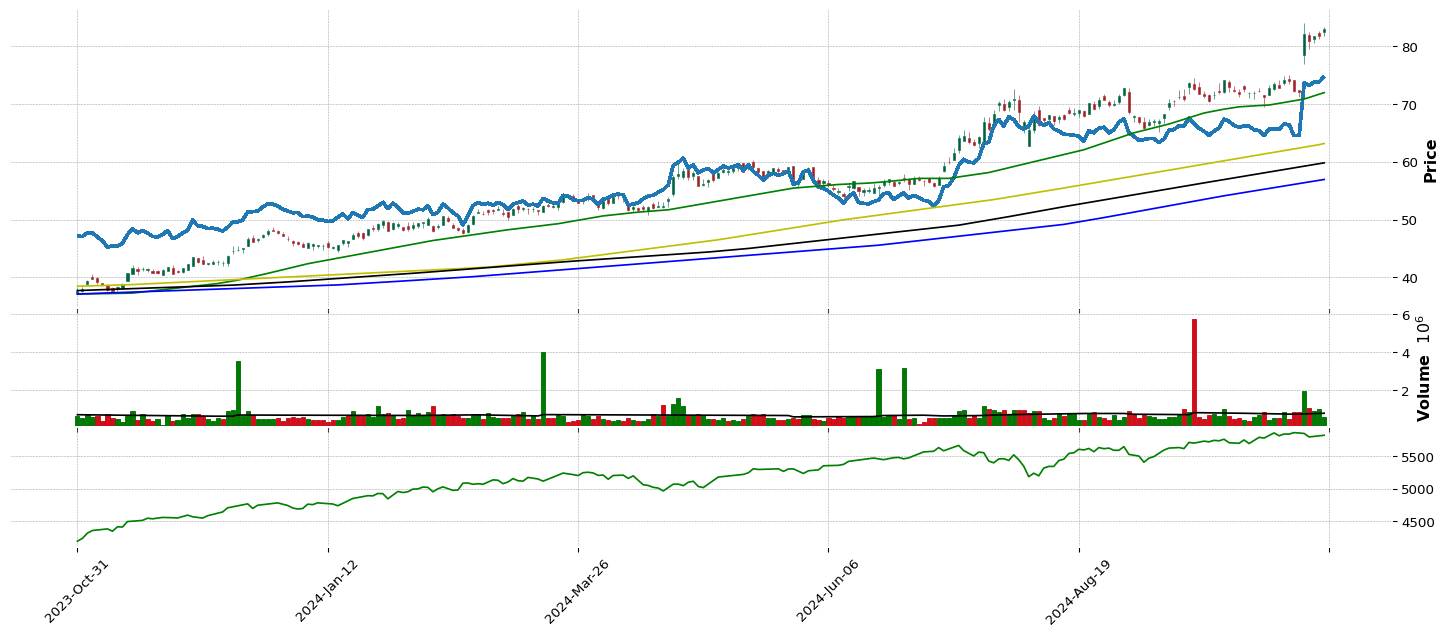
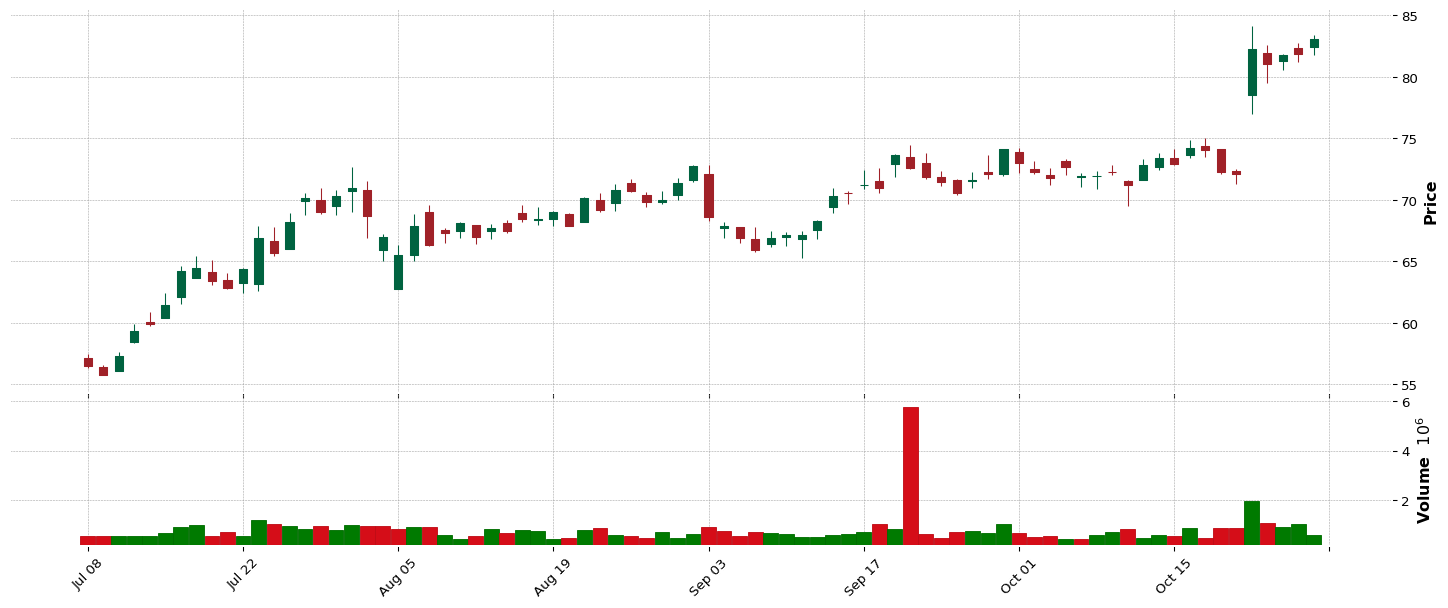
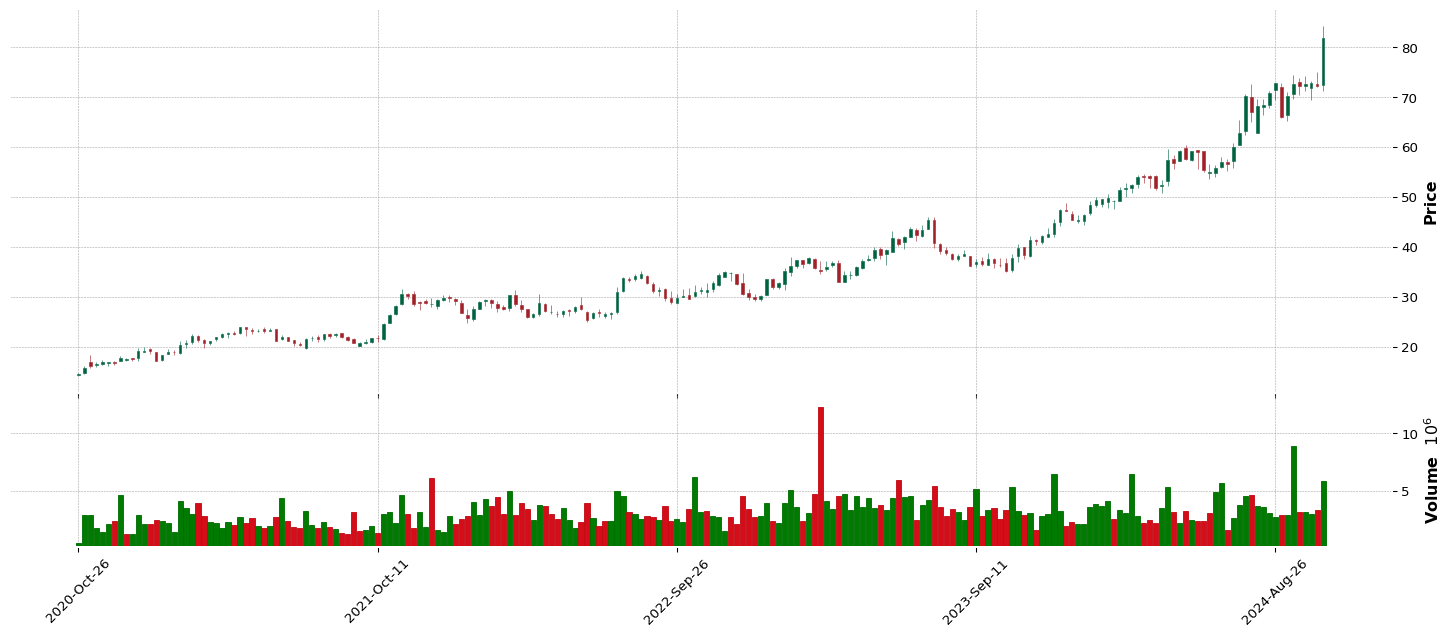
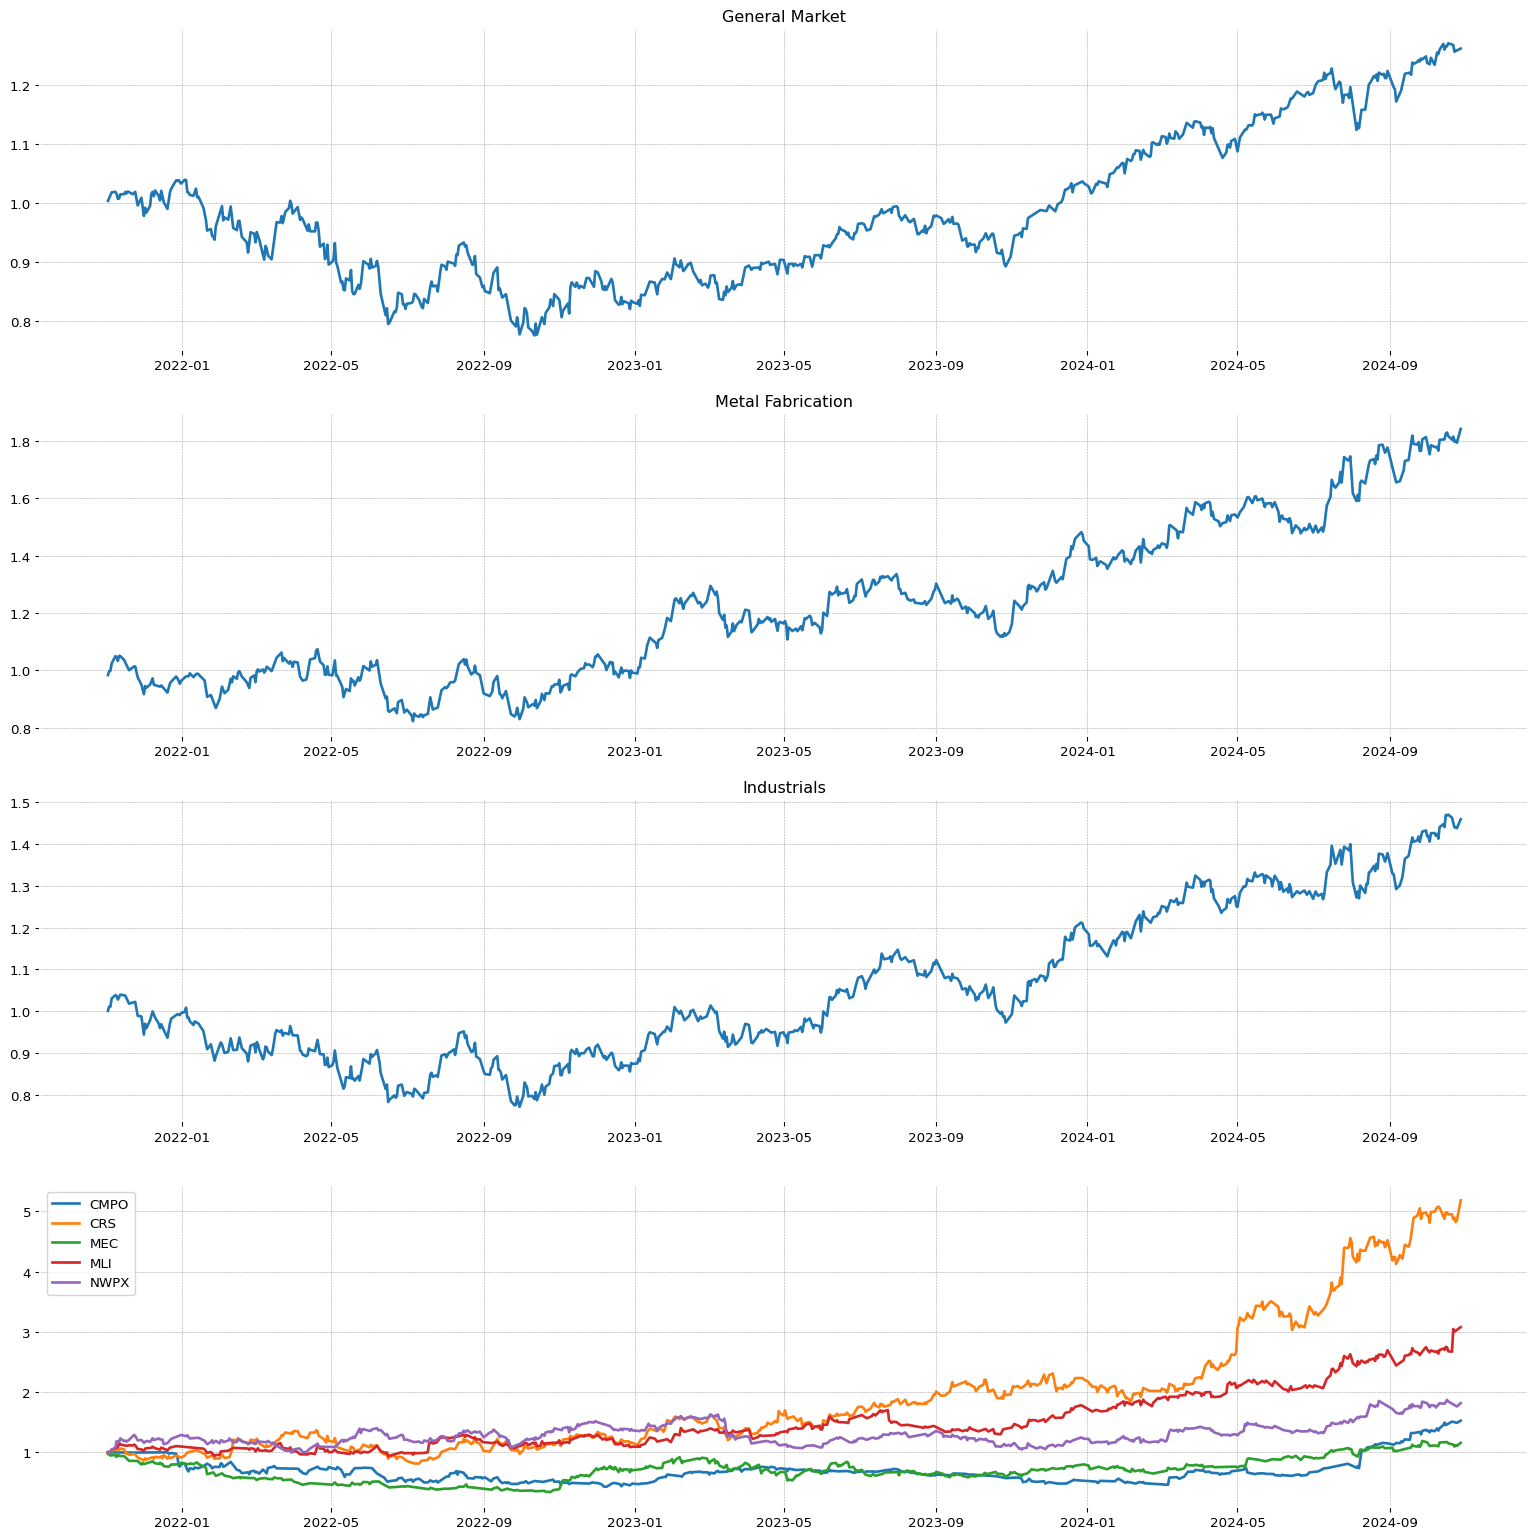 CVNA
CVNA
**** TECNICO ****
CVNA
| Total stock number: | 113.56M |
| Namee: | Carvana Co. |
| IPO date: | 2017-04-28 |
| SMR | EPS | RS |
76.45 | 77.54 | 99 |
| Sector | Sector Position |
| Consumer Cyclical | 6/11 |
| Industry | Industry Position - | Stock on industry - | RSI Sector: |
| Auto & Truck Dealerships | 34/147 | 1/20 | 6/351 |


 DOGZ
DOGZ
**** TECNICO ****
DOGZ
| Total stock number: | 1.66M |
| Namee: | Dogness (International) Corporation |
| IPO date: | 2017-12-19 |
| Sector | Sector Position |
| Consumer Cyclical | 6/11 |
| Industry | Industry Position - | Stock on industry - | RSI Sector: |
| Leisure | 3/147 | 1/18 | 1/351 |
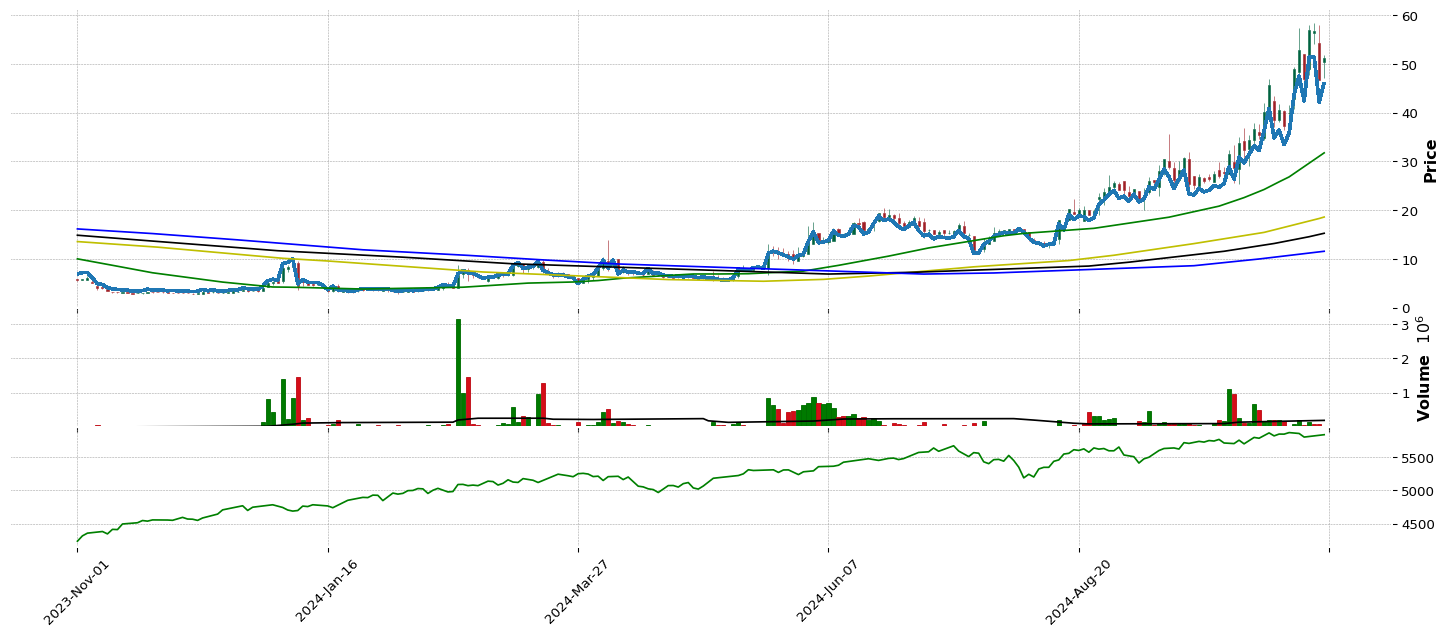
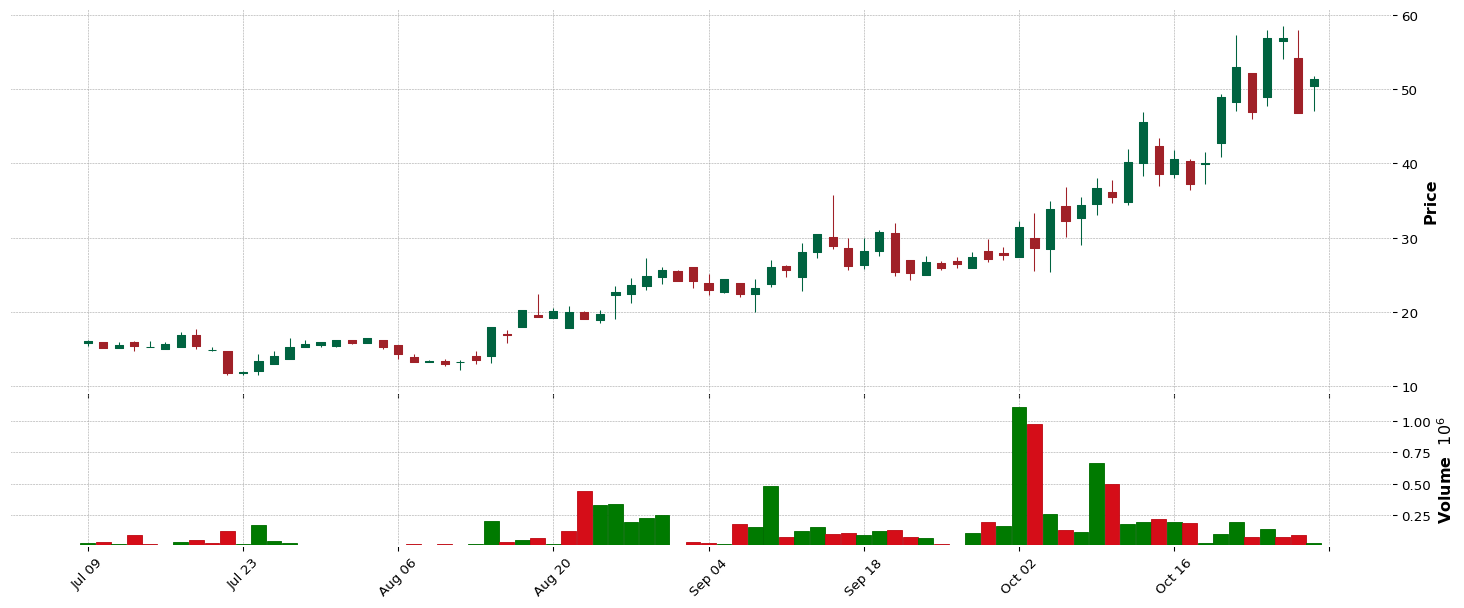
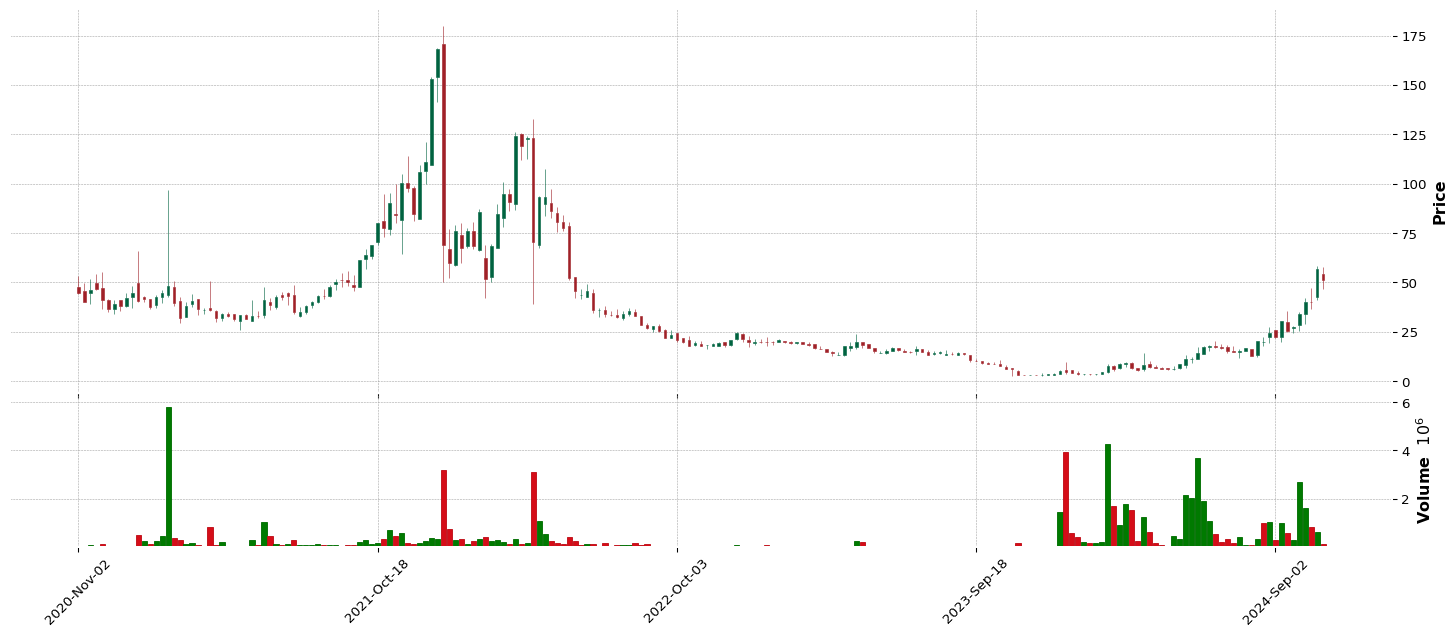
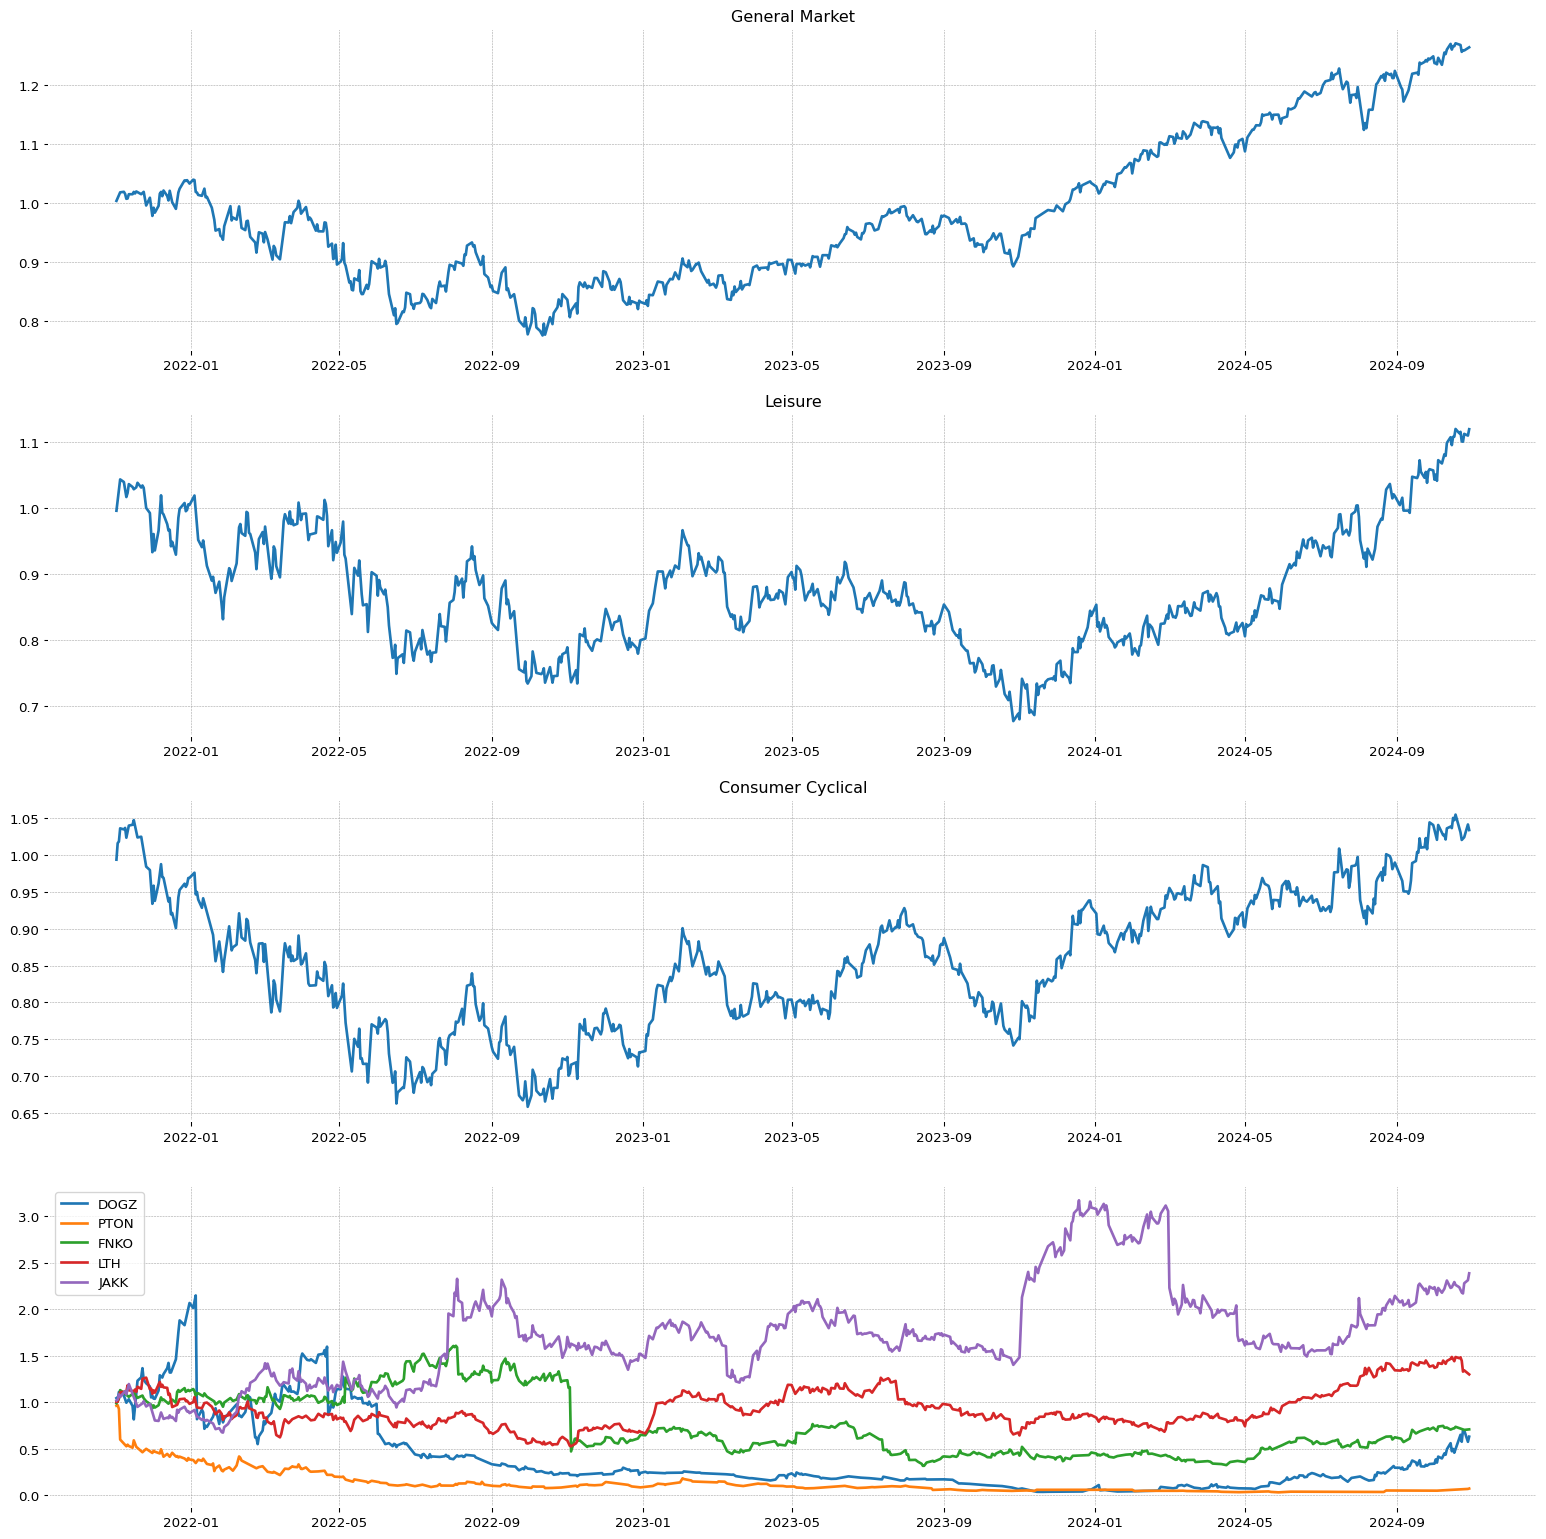 VST
VST
**** TECNICO ****
VST
| Total stock number: | 340.48M |
| Namee: | Vistra Corp. |
| IPO date: | 2016-10-05 |
| SMR | EPS | RS |
29.29 | 13.67 | 98 |
| Sector | Sector Position |
| Utilities | 8/11 |
| Industry | Industry Position - | Stock on industry - | RSI Sector: |
| Utilities - Independent Power Producers | 5/147 | 1/6 | 4/96 |
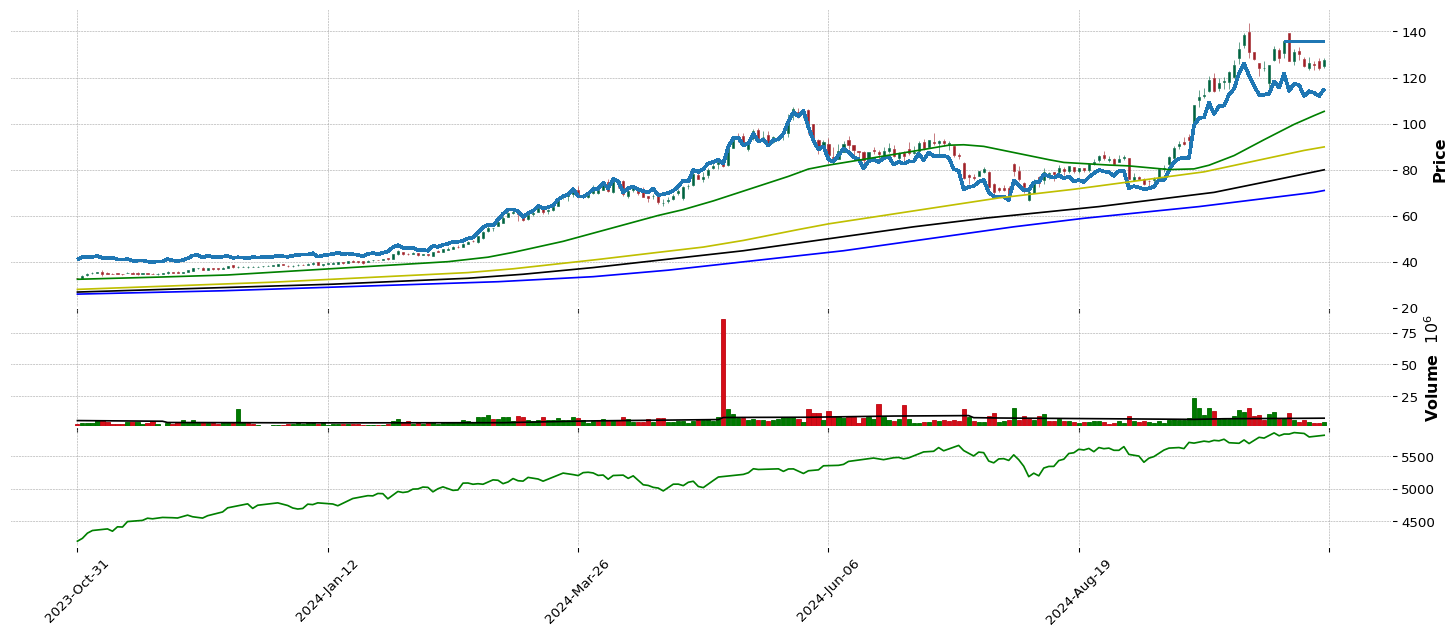
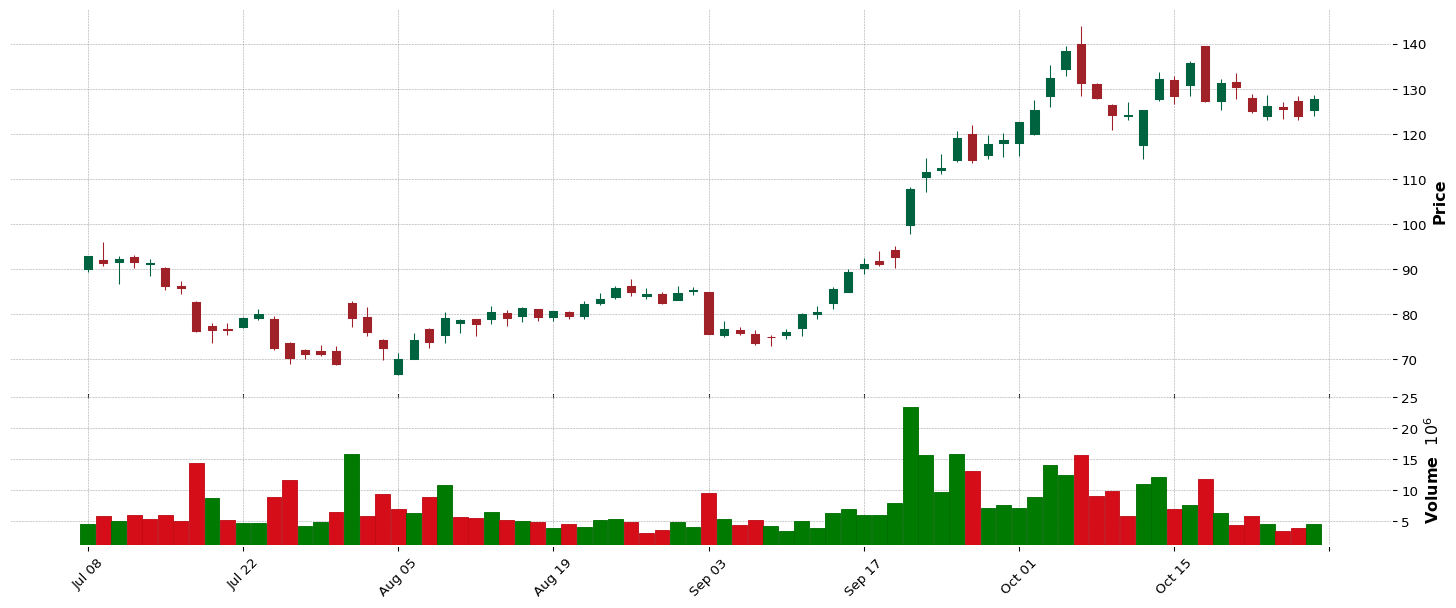
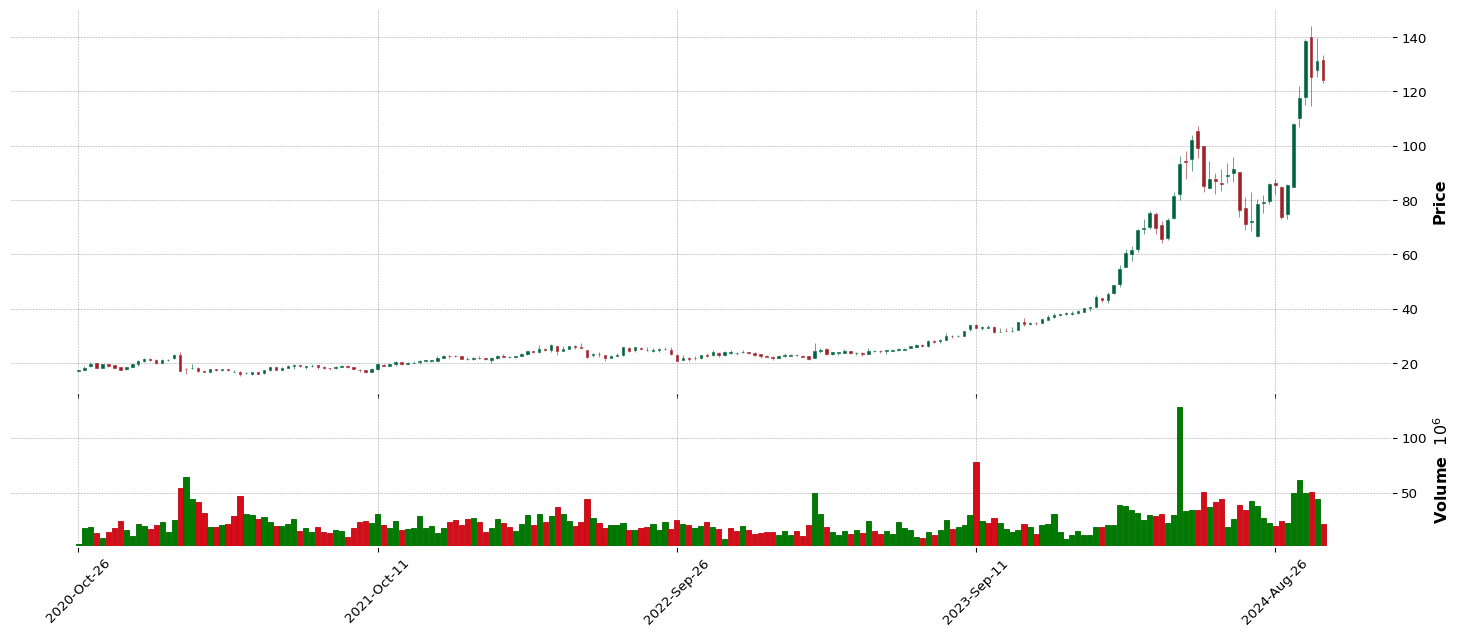
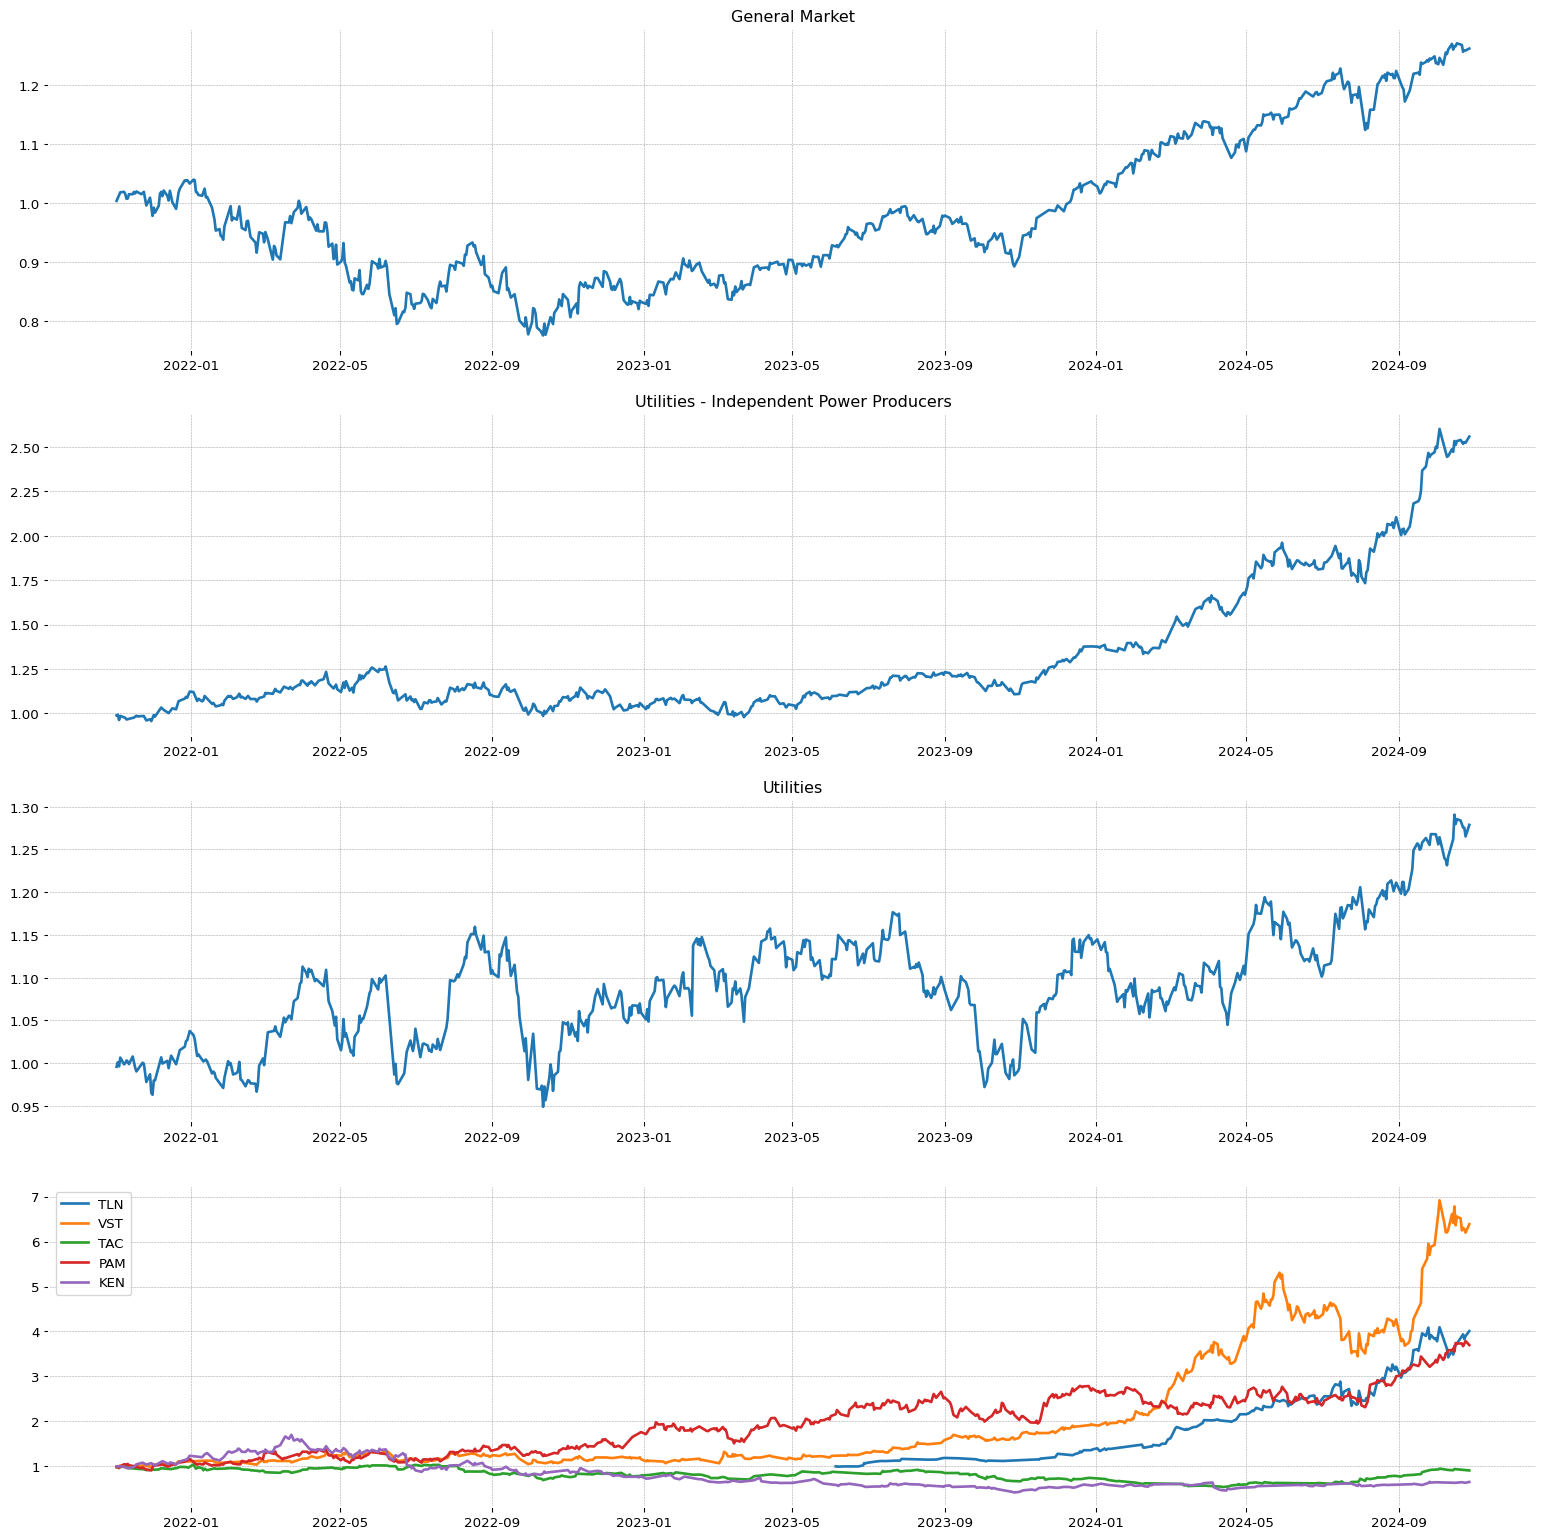 RDNT
RDNT
**** TECNICO ****
RDNT
| Total stock number: | 65.98M |
| Namee: | RadNet, Inc. |
| IPO date: | 1997-01-03 |
| Sector | Sector Position |
| Healthcare | 1/11 |
| Industry | Industry Position - | Stock on industry - | RSI Sector: |
| Diagnostics & Research | 48/147 | 4/28 | 112/487 |
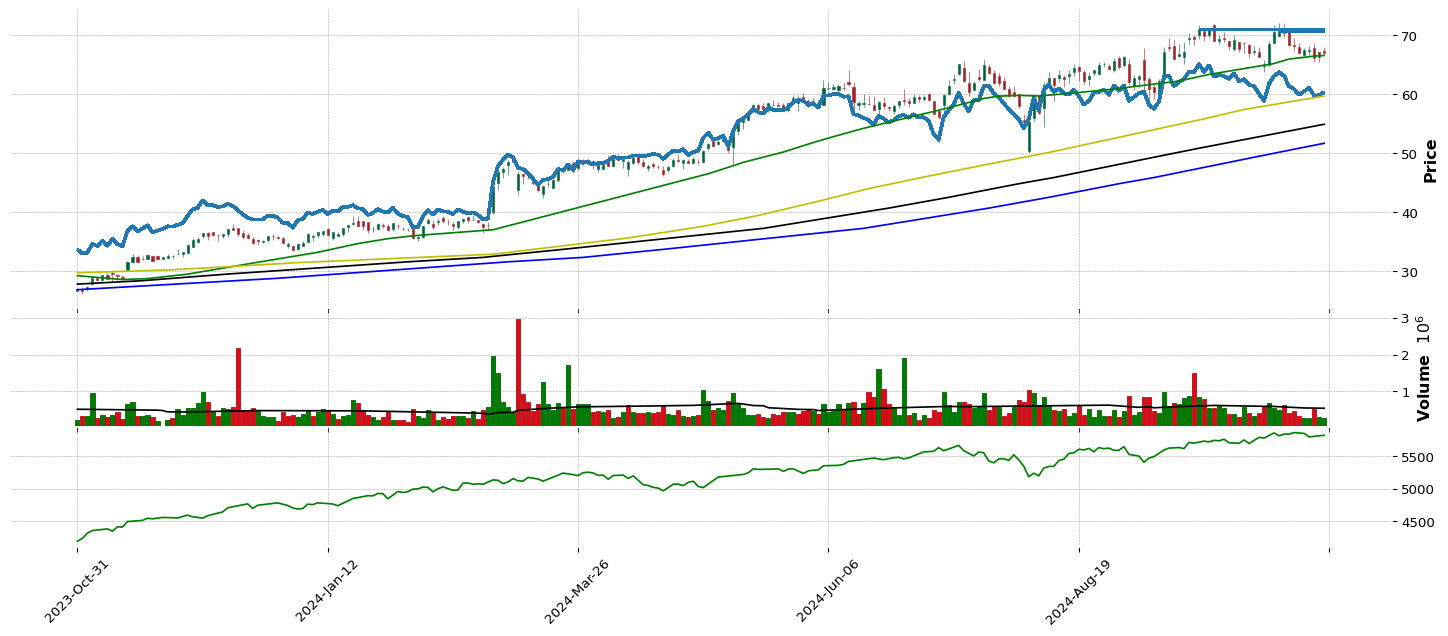
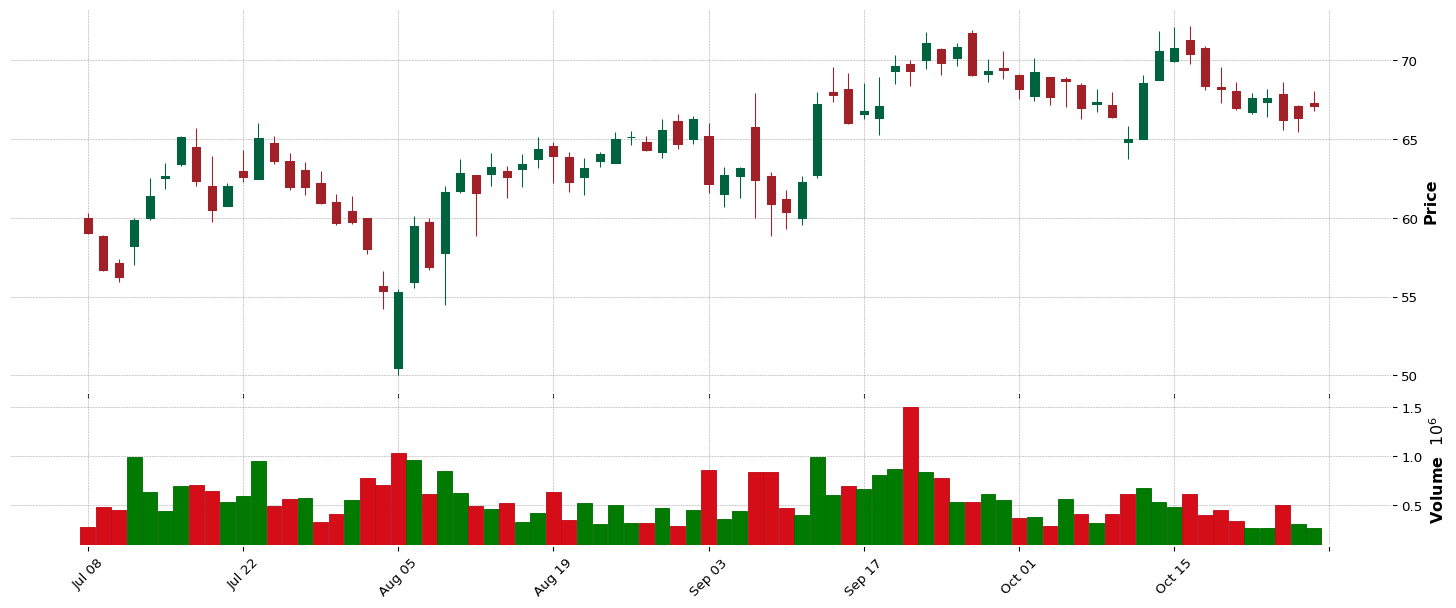
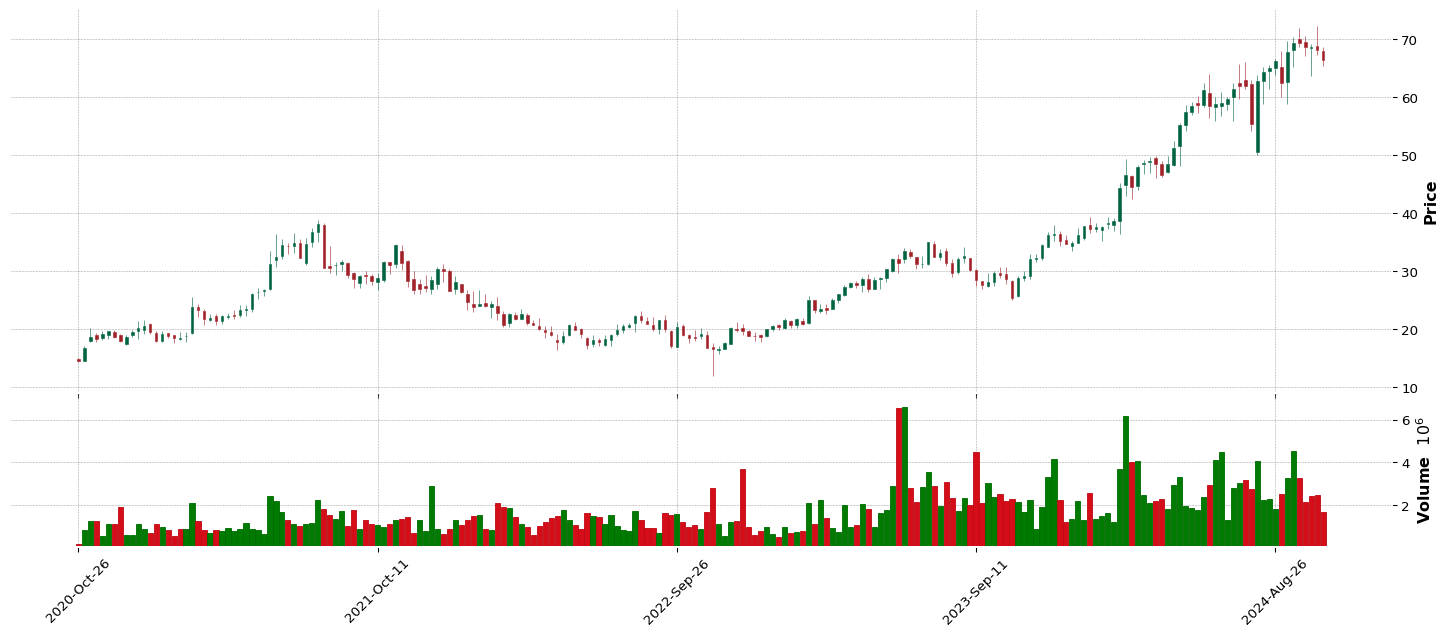
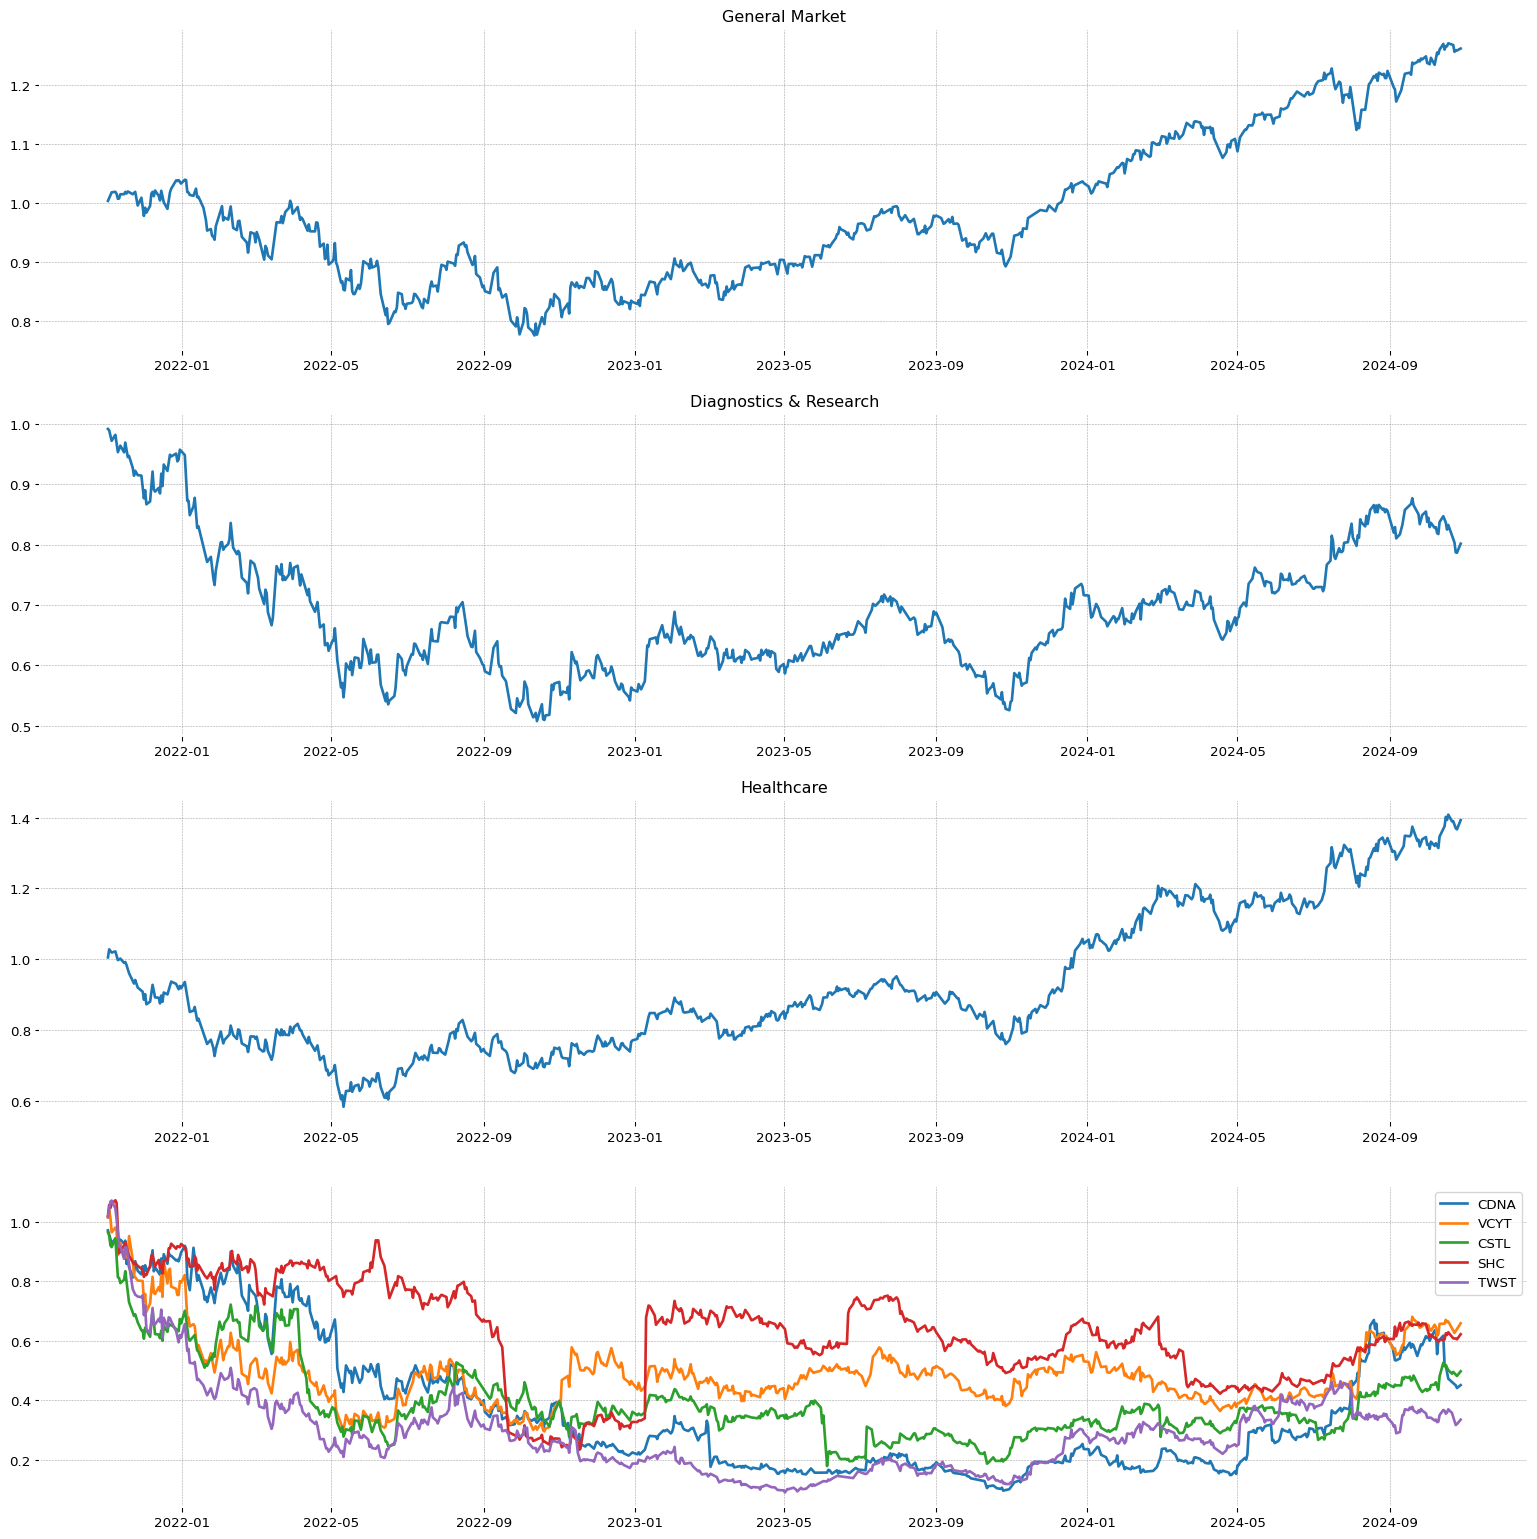 RCL
RCL
**** TECNICO ****
RCL
| Total stock number: | 242.61M |
| Namee: | Royal Caribbean Cruises Ltd. |
| IPO date: | 1993-04-28 |
| Sector | Sector Position |
| Consumer Cyclical | 6/11 |
| Industry | Industry Position - | Stock on industry - | RSI Sector: |
| Travel Services | 16/147 | 2/13 | 40/351 |
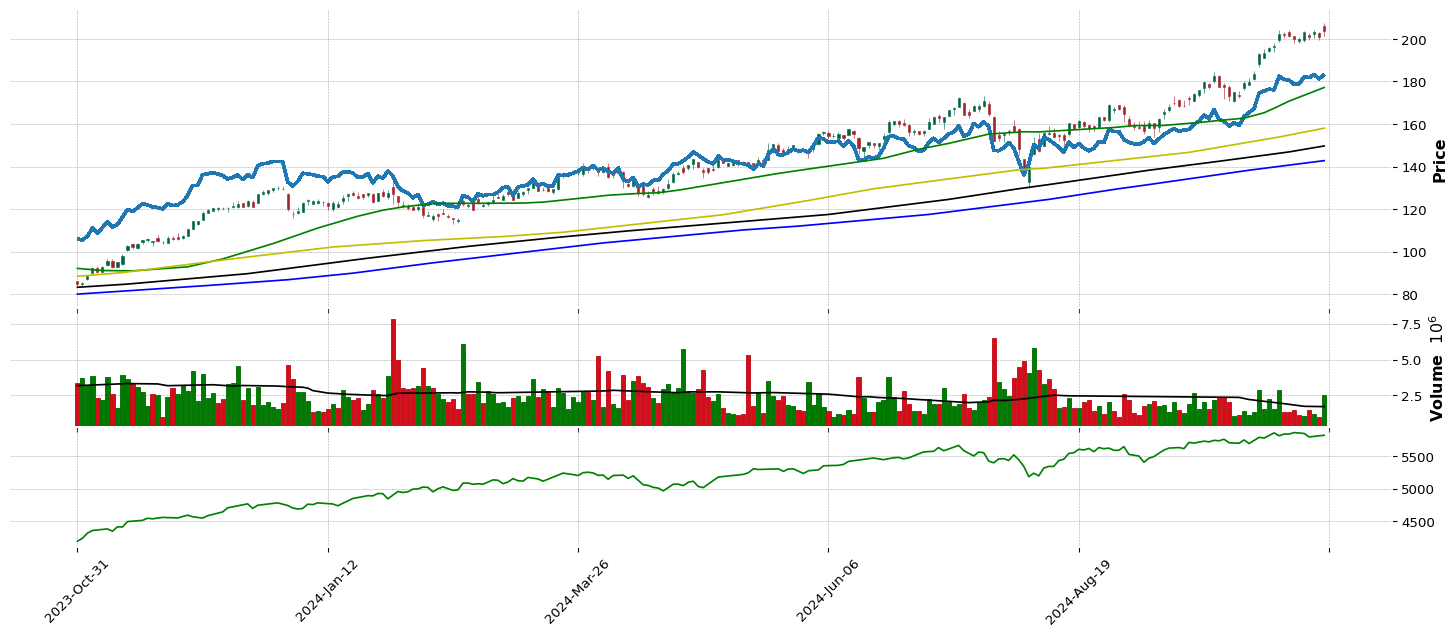
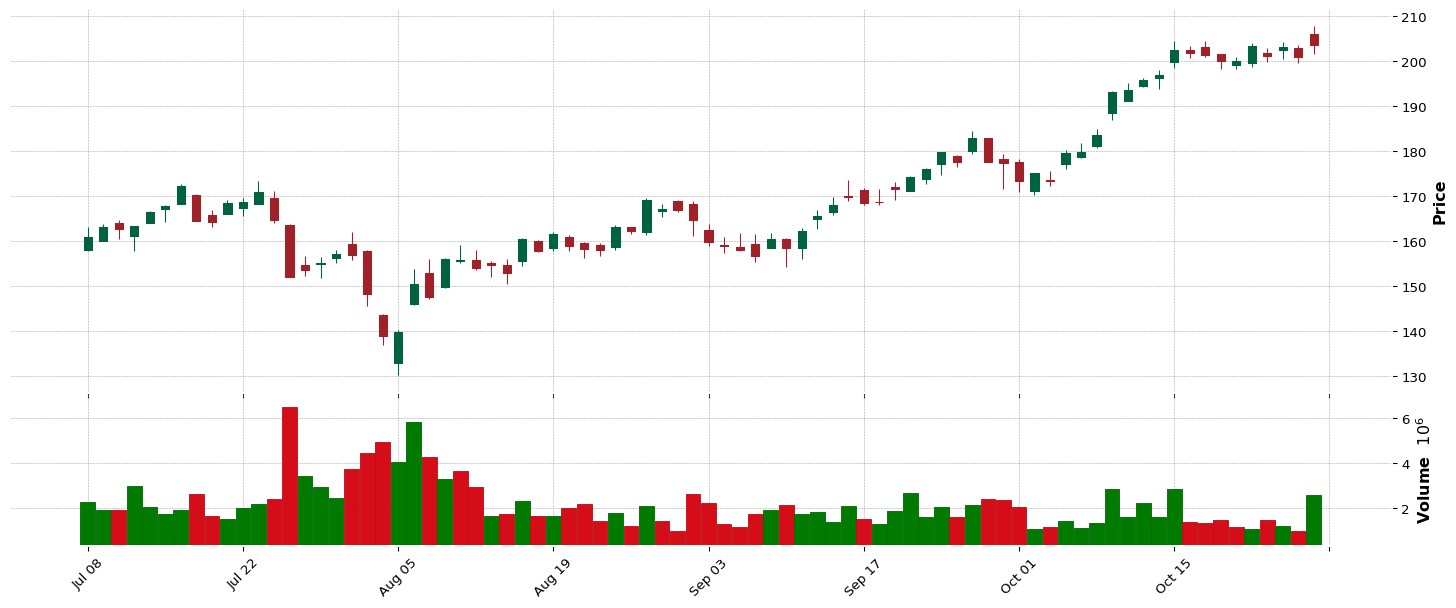
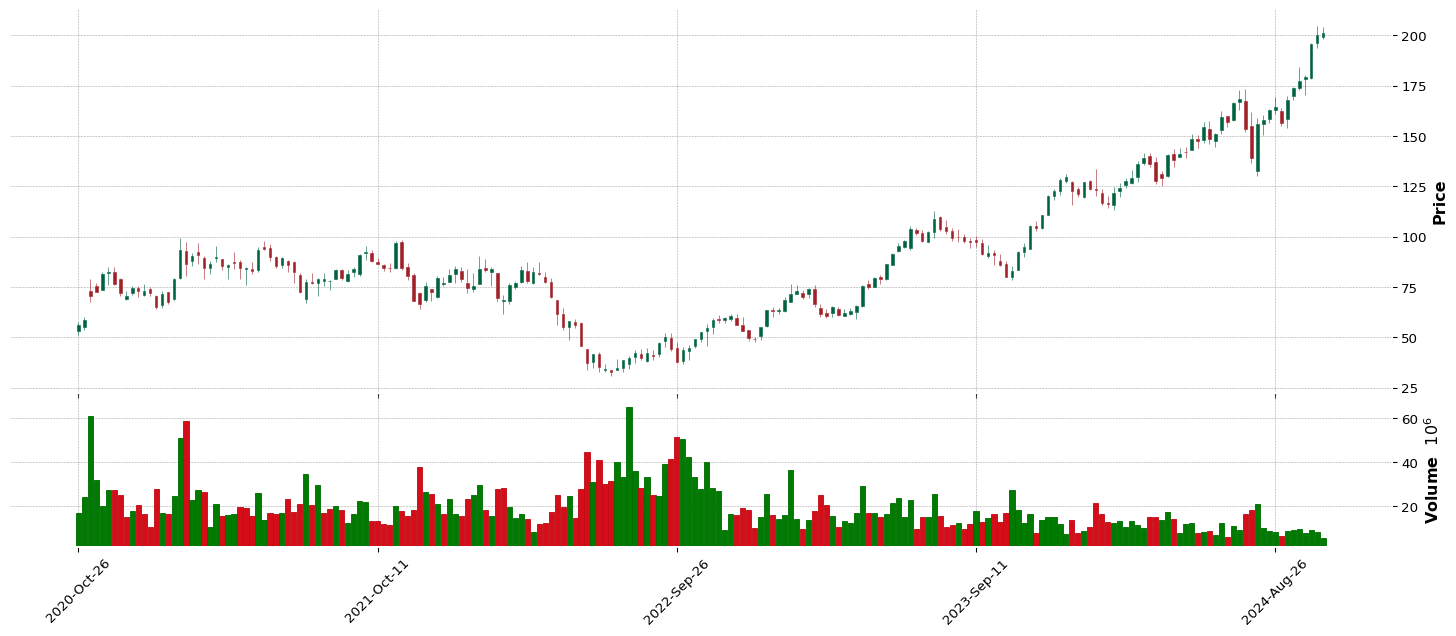
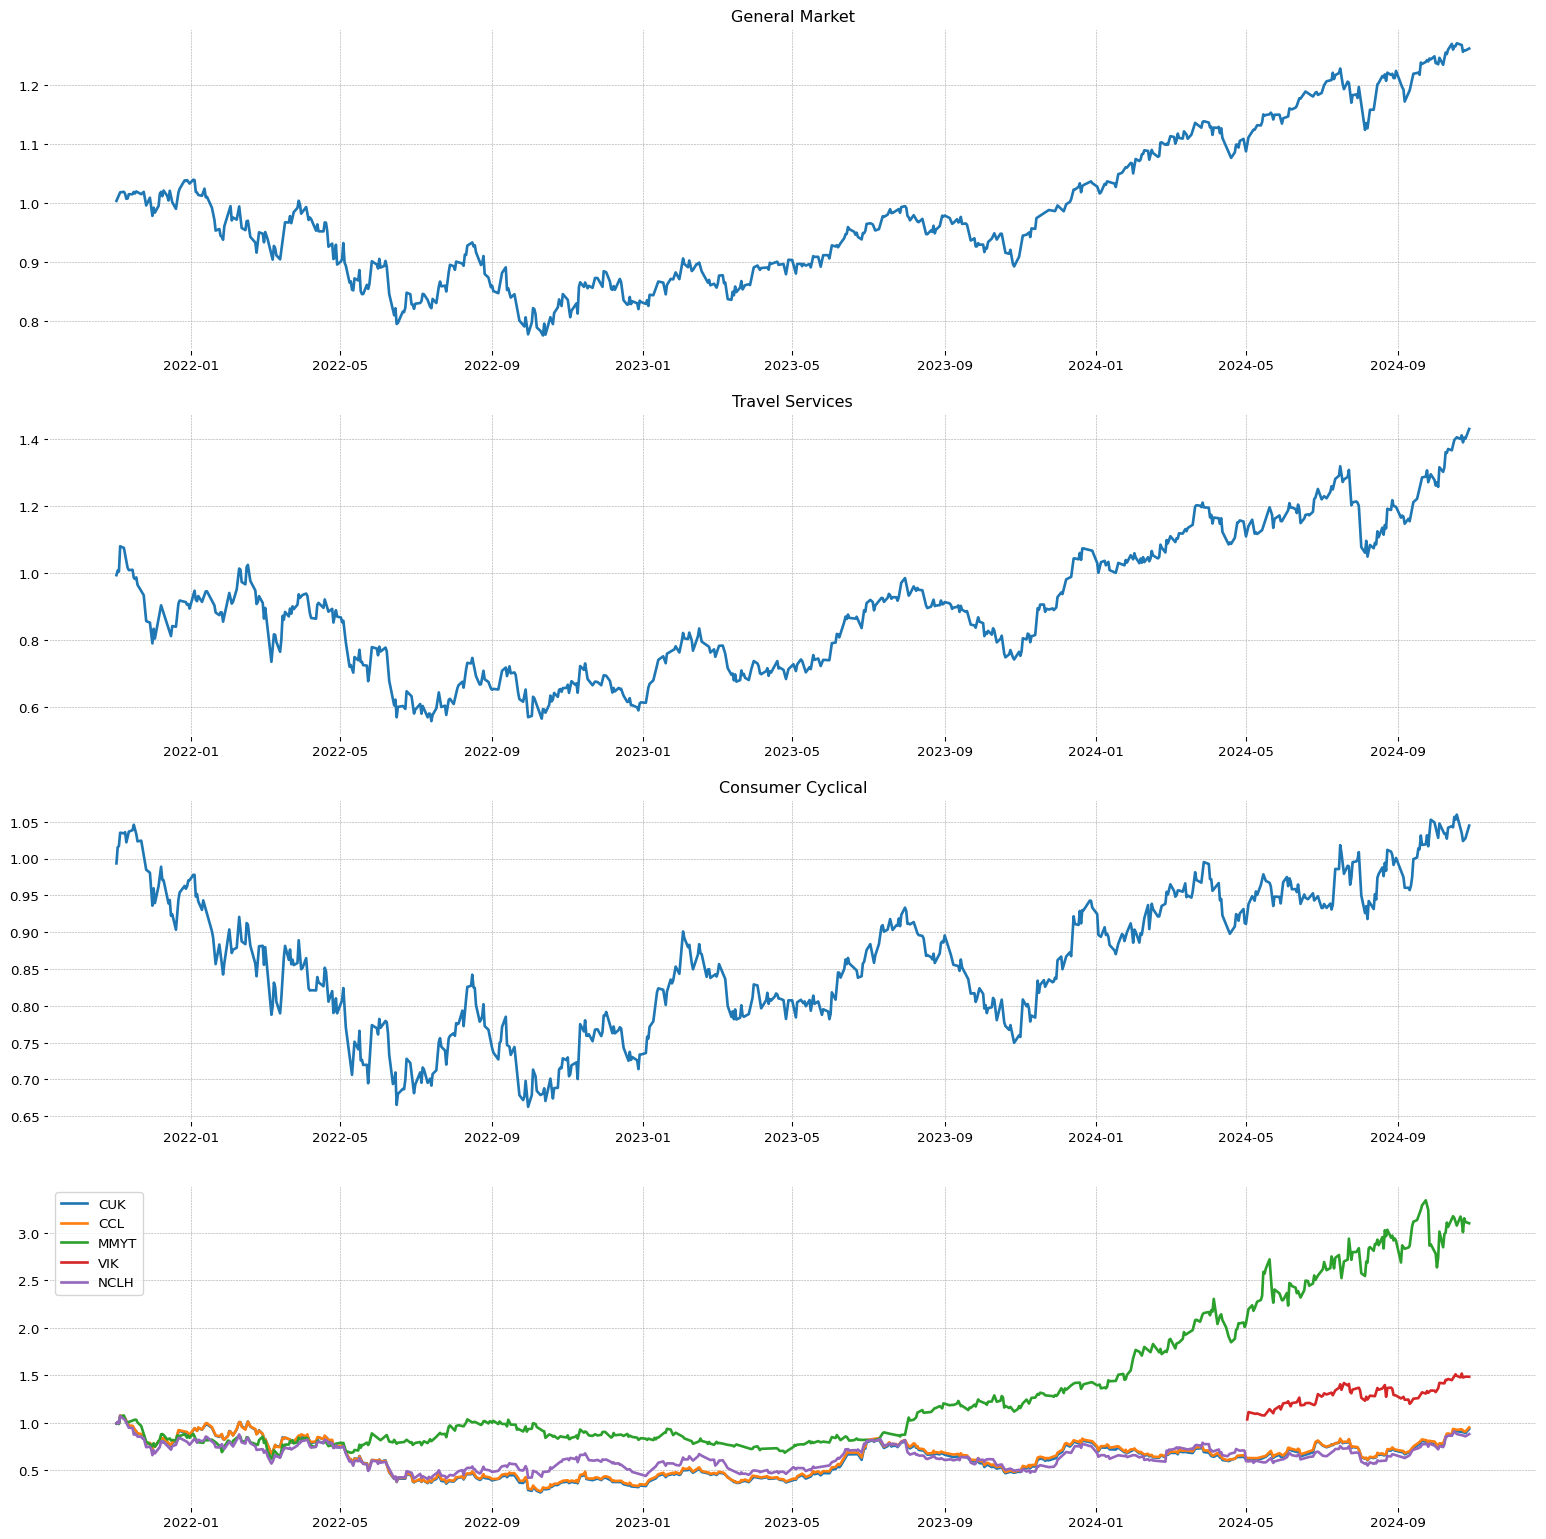 ZETA
ZETA
**** TECNICO ****
ZETA
| Total stock number: | 181.38M |
| Namee: | Zeta Global Holdings Corp. |
| IPO date: | 2021-06-10 |
| SMR | EPS | RS |
76.83 | 37.14 | 97 |
| Sector | Sector Position |
| Technology | 2/11 |
| Industry | Industry Position - | Stock on industry - | RSI Sector: |
| Software - Infrastructure | 55/147 | 1/103 | 12/445 |
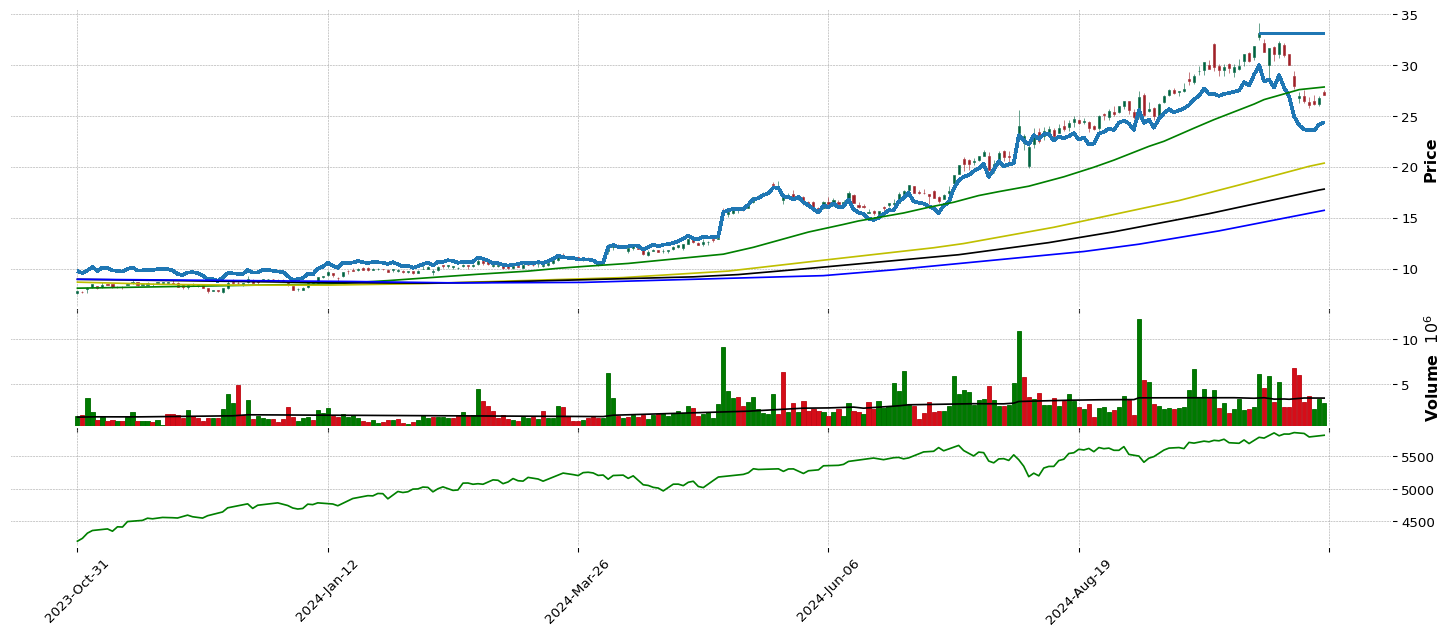
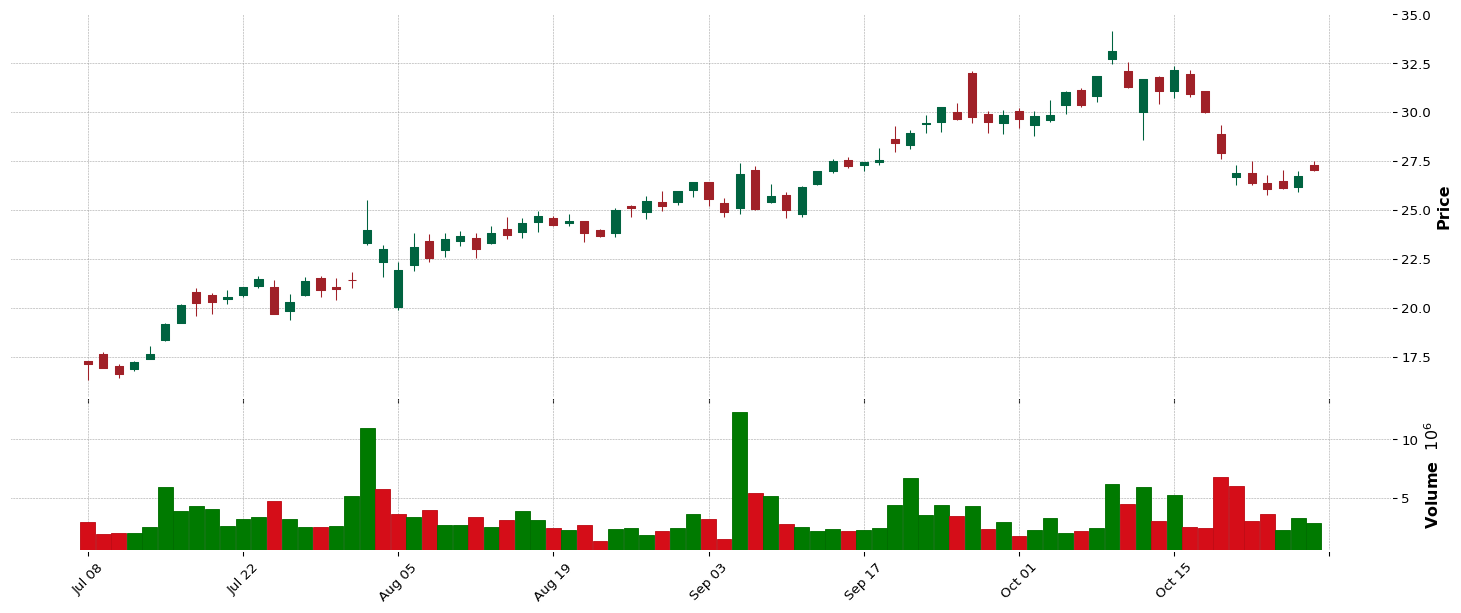
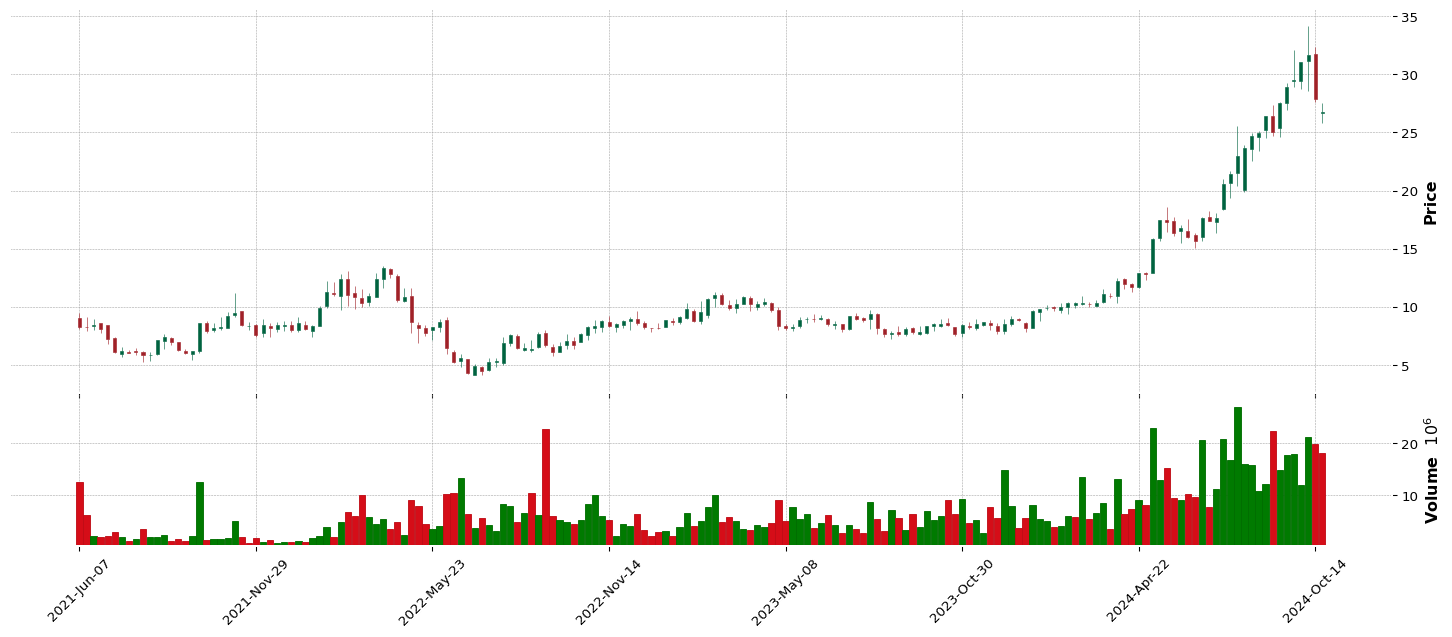
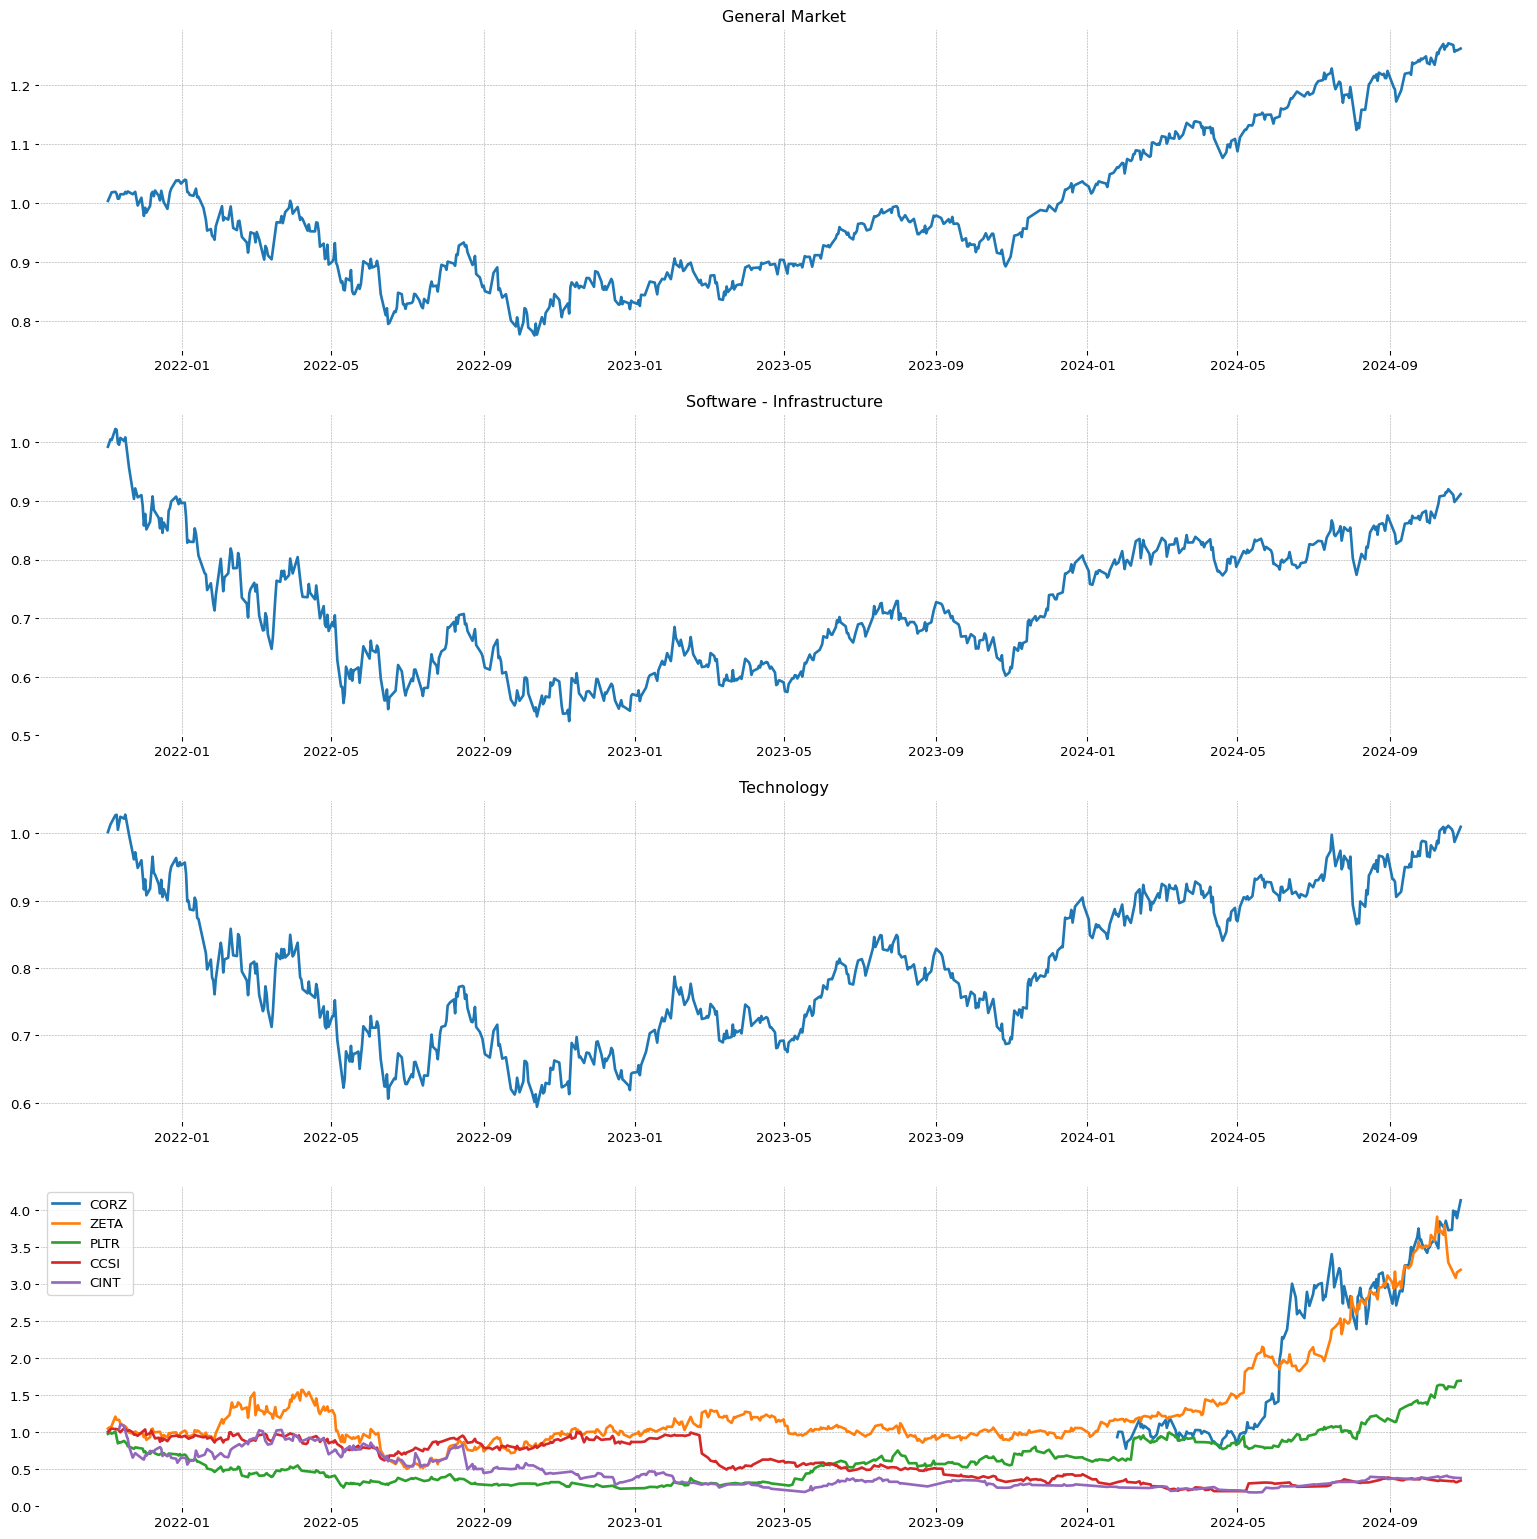 WGS
WGS
**** TECNICO ****
WGS
| Total stock number: | 17.81M |
| Namee: | GeneDx Holdings Corp. |
| IPO date: | 2020-11-04 |
| SMR | EPS | RS |
96.88 | 97.33 | 100 |
| Sector | Sector Position |
| Healthcare | 1/11 |
| Industry | Industry Position - | Stock on industry - | RSI Sector: |
| Health Information Services | 111/147 | 1/30 | 17/487 |


 PRMW
PRMW
**** TECNICO ****
PRMW
| Total stock number: | 155.83M |
| Namee: | Primo Water Corporation |
| IPO date: | 1992-06-16 |
| SMR | EPS | RS |
65.12 | 92.08 | 90 |
| Sector | Sector Position |
| Consumer Defensive | 10/11 |
| Industry | Industry Position - | Stock on industry - | RSI Sector: |
| Beverages - Non-Alcoholic | 107/147 | 1/14 | 11/147 |
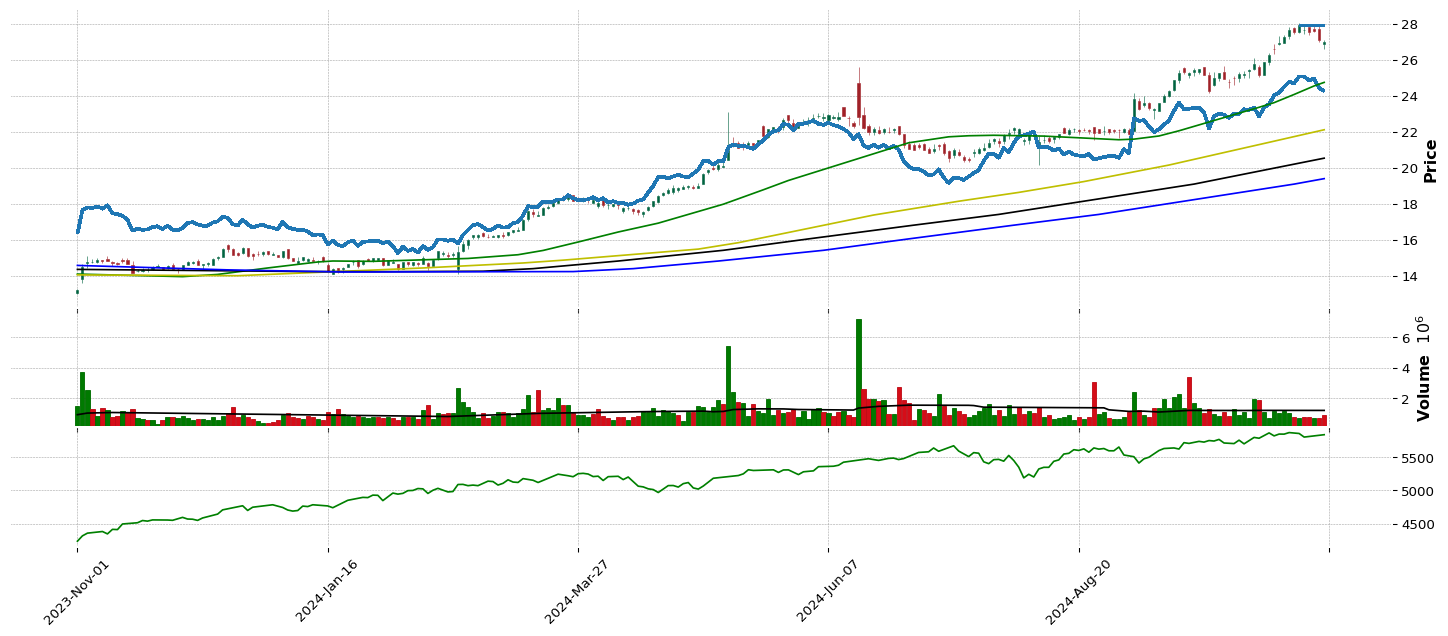
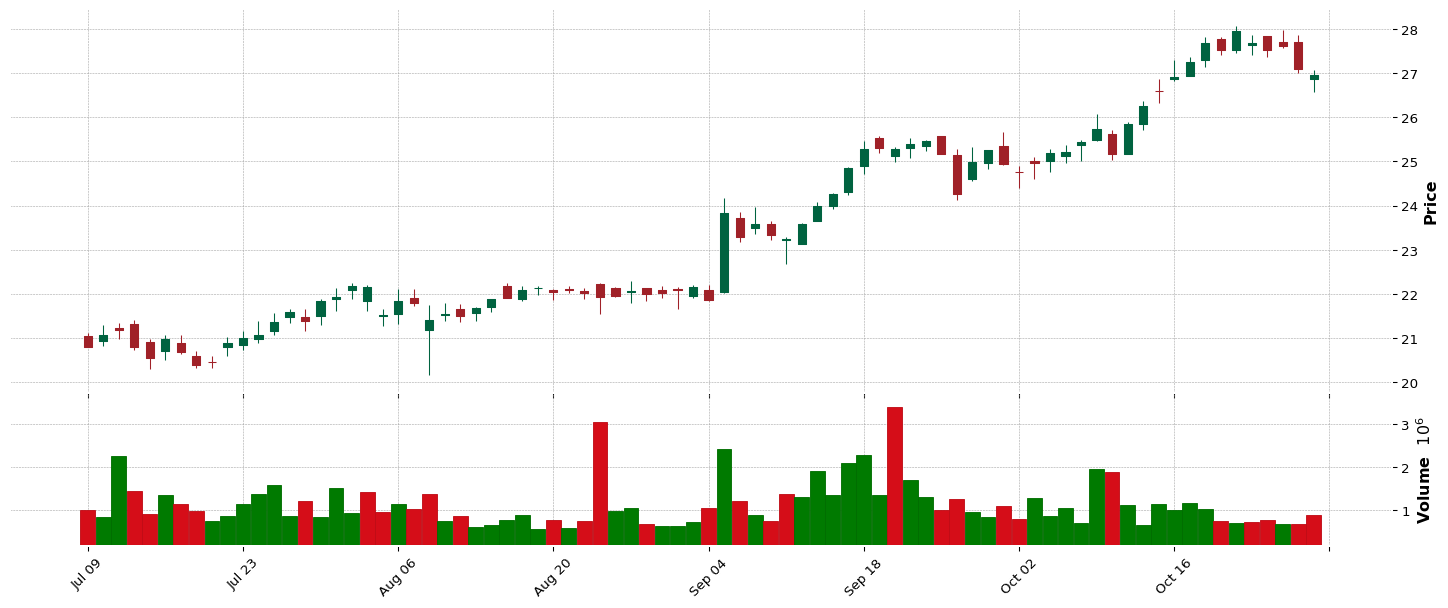
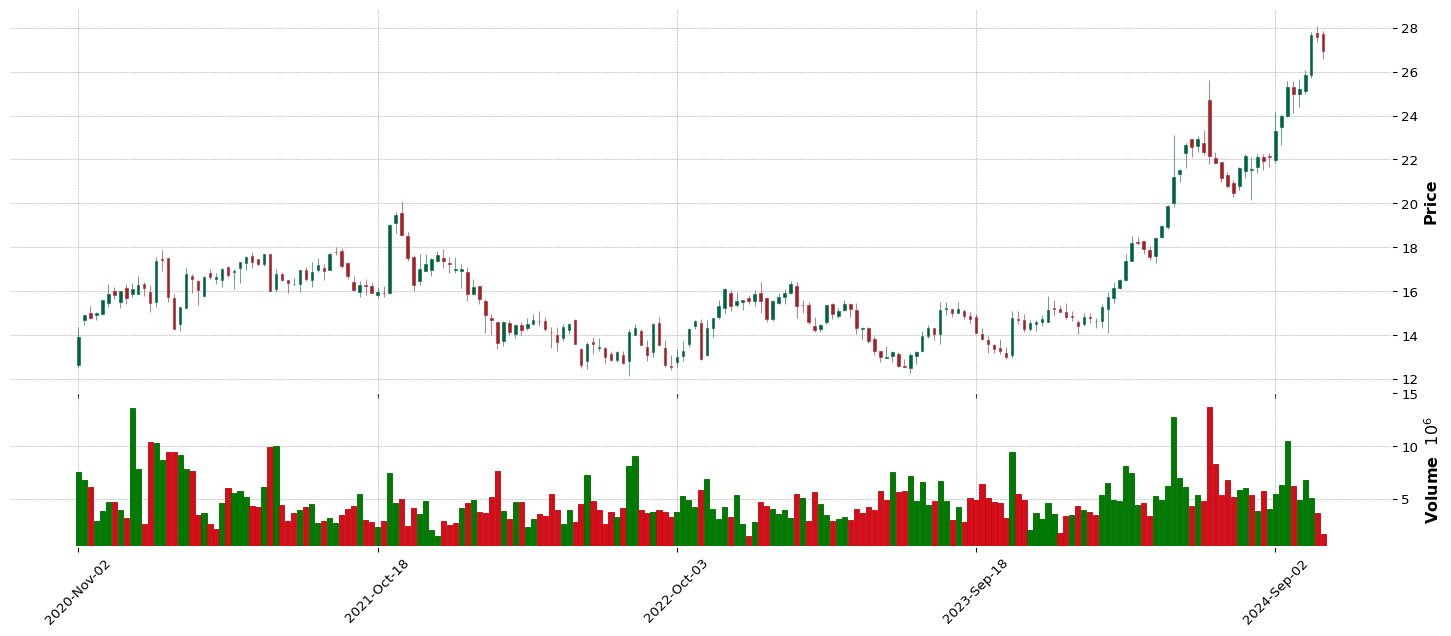
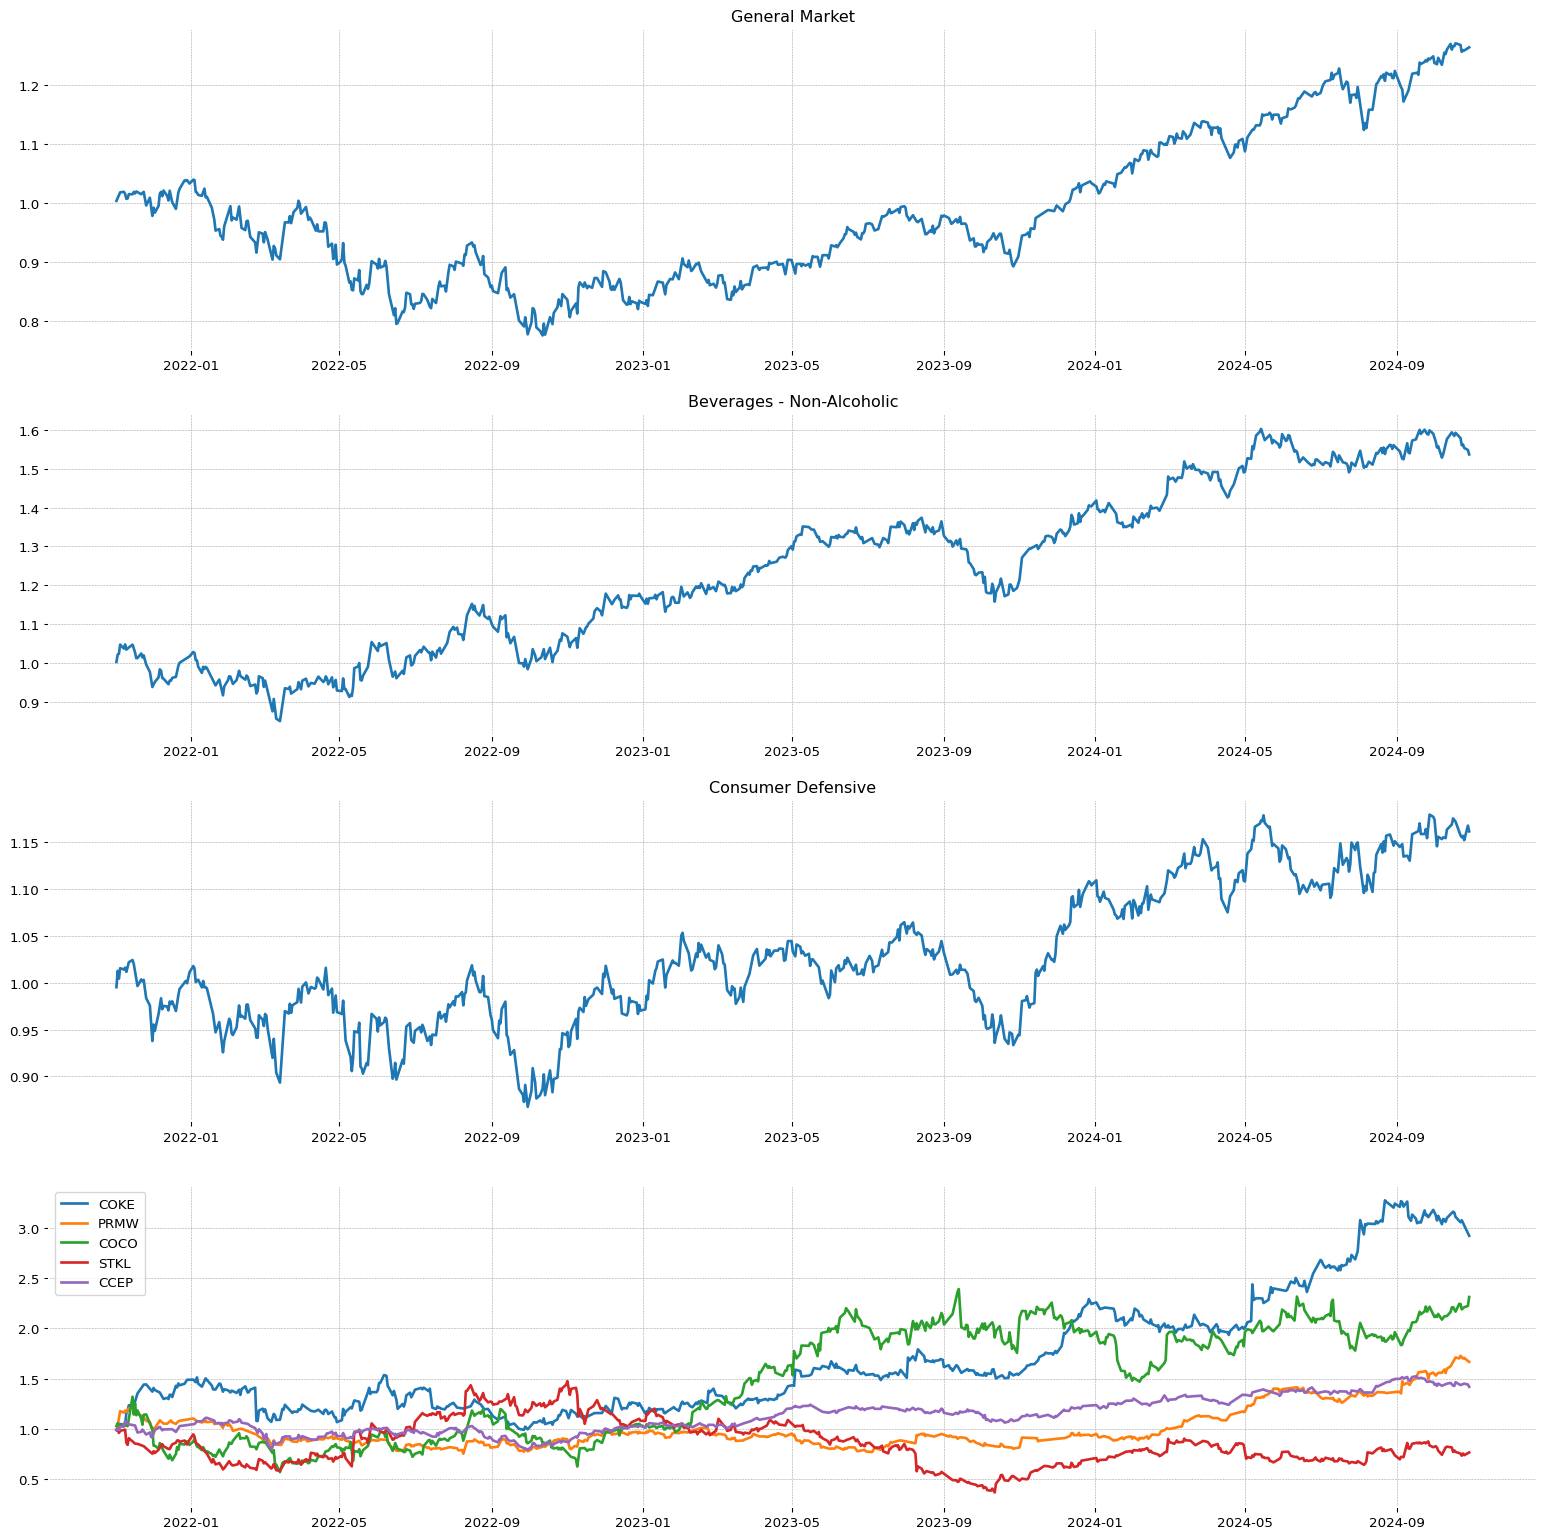 LE
LE
**** TECNICO ****
LE
| Total stock number: | 10.93M |
| Namee: | Lands' End, Inc. |
| IPO date: | 2014-03-20 |
| Sector | Sector Position |
| Consumer Cyclical | 6/11 |
| Industry | Industry Position - | Stock on industry - | RSI Sector: |
| Apparel Retail | 80/147 | 1/22 | 105/351 |
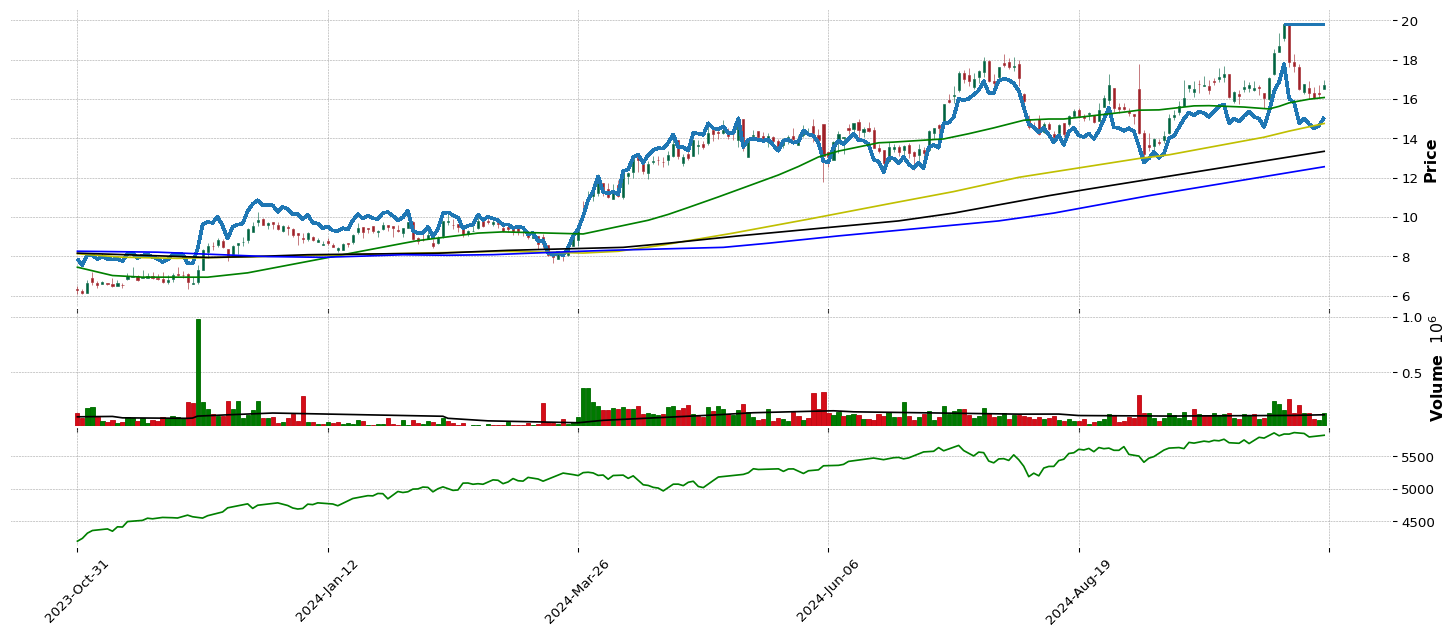
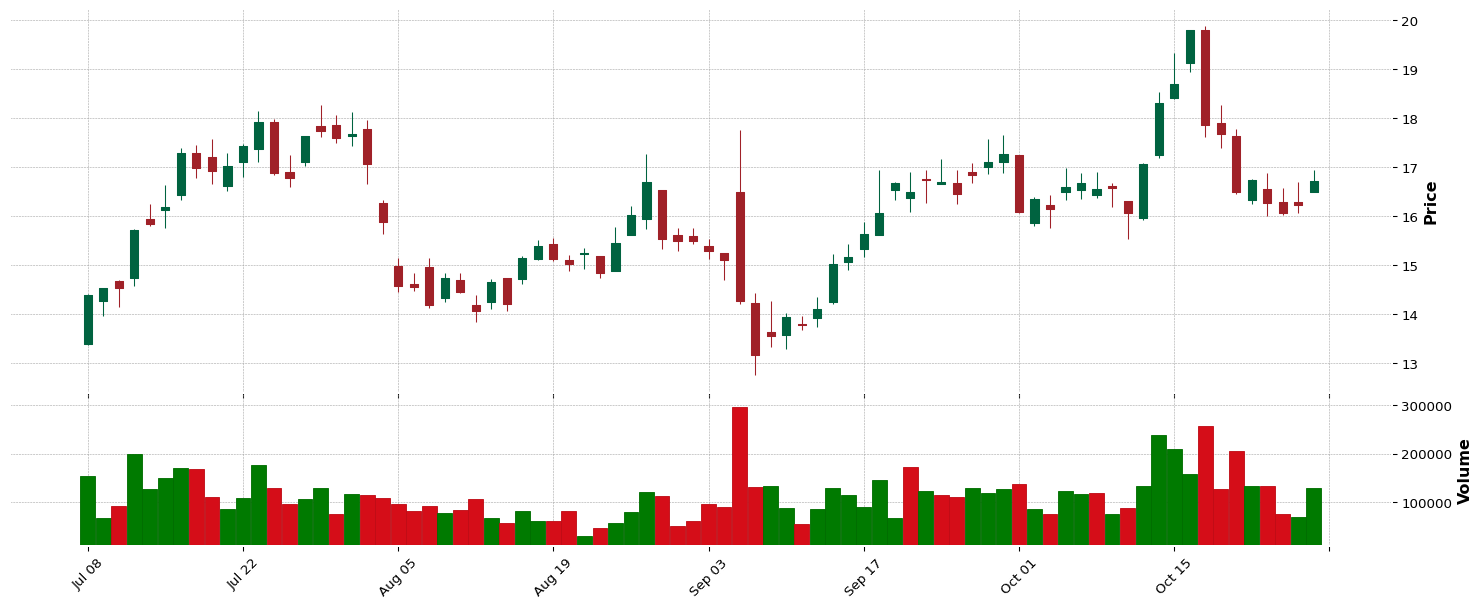
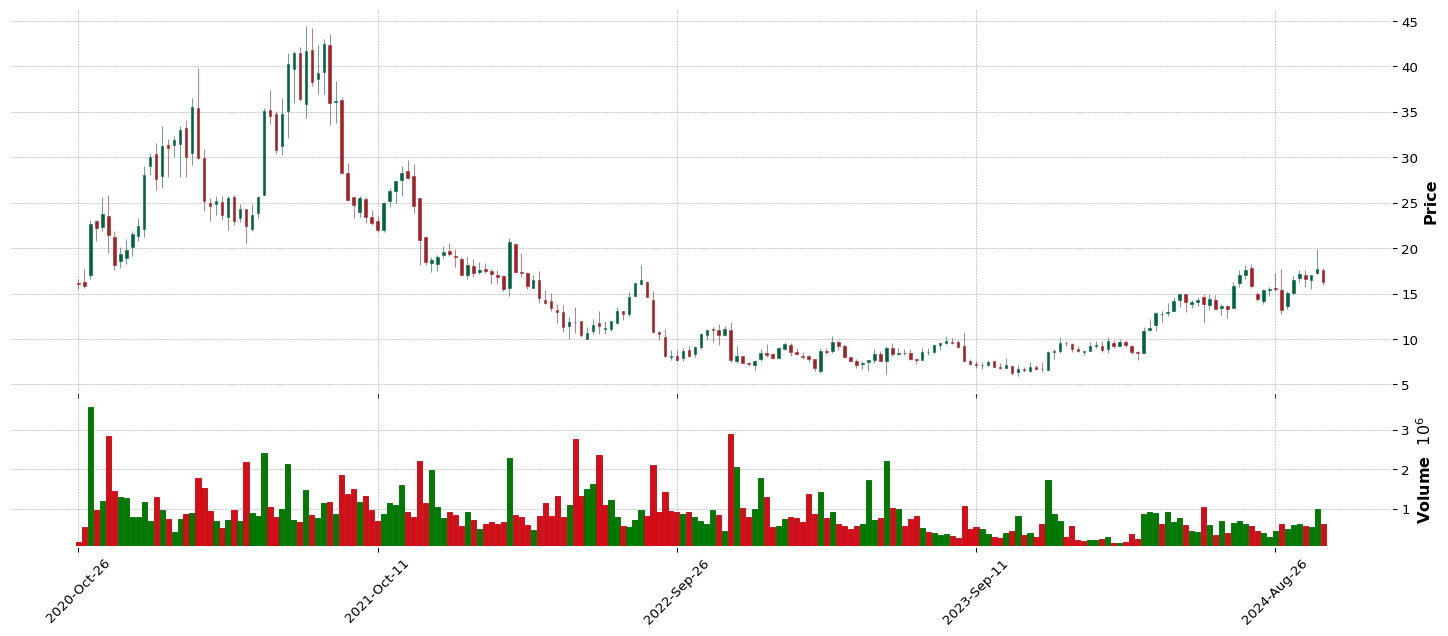
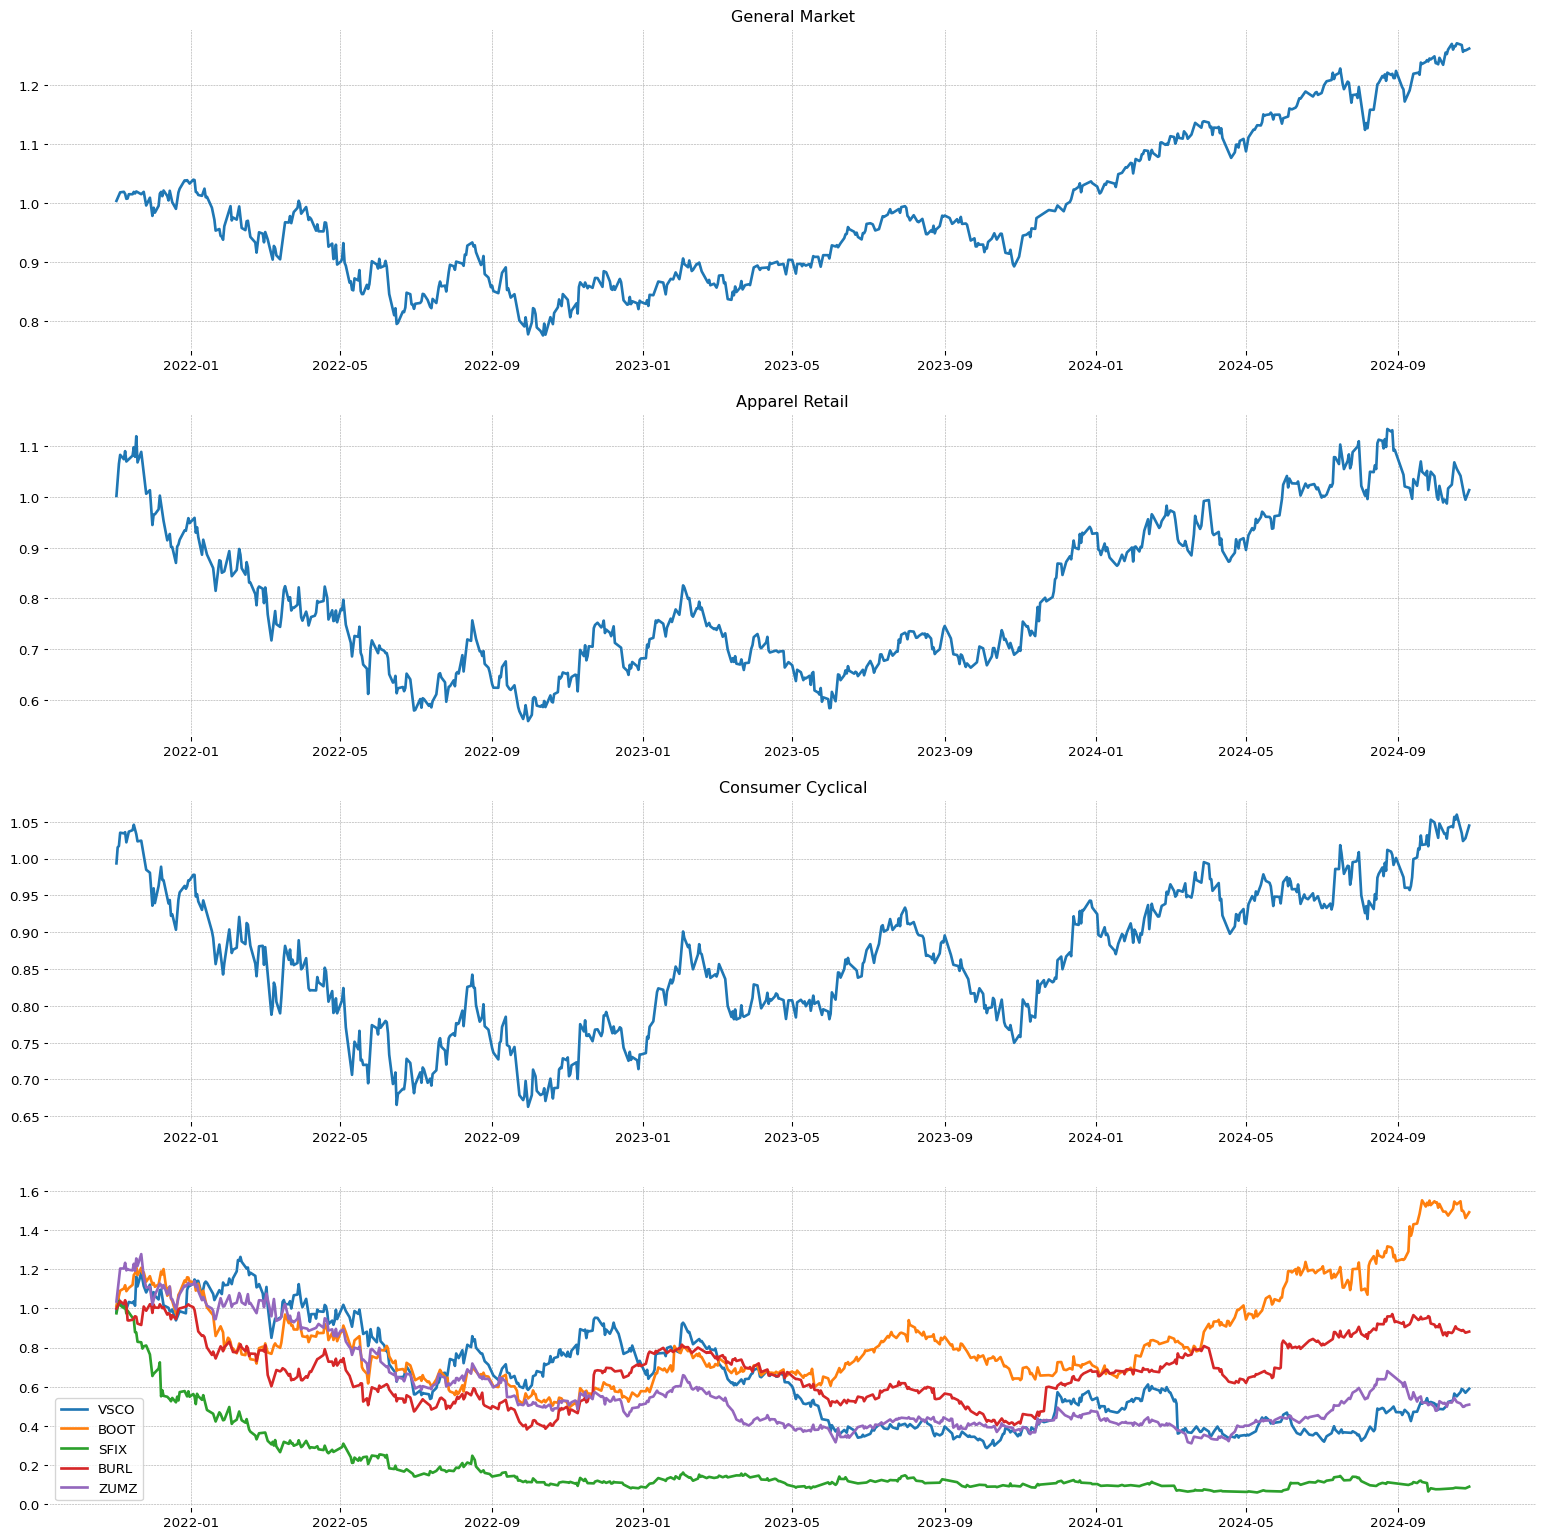 FRPT
FRPT
**** TECNICO ****
FRPT
| Total stock number: | 47.58M |
| Namee: | Freshpet, Inc. |
| IPO date: | 2014-11-07 |
| SMR | EPS | RS |
98.68 | 47.63 | 93 |
| Sector | Sector Position |
| Consumer Defensive | 10/11 |
| Industry | Industry Position - | Stock on industry - | RSI Sector: |
| Packaged Foods | 114/147 | 2/35 | 23/147 |
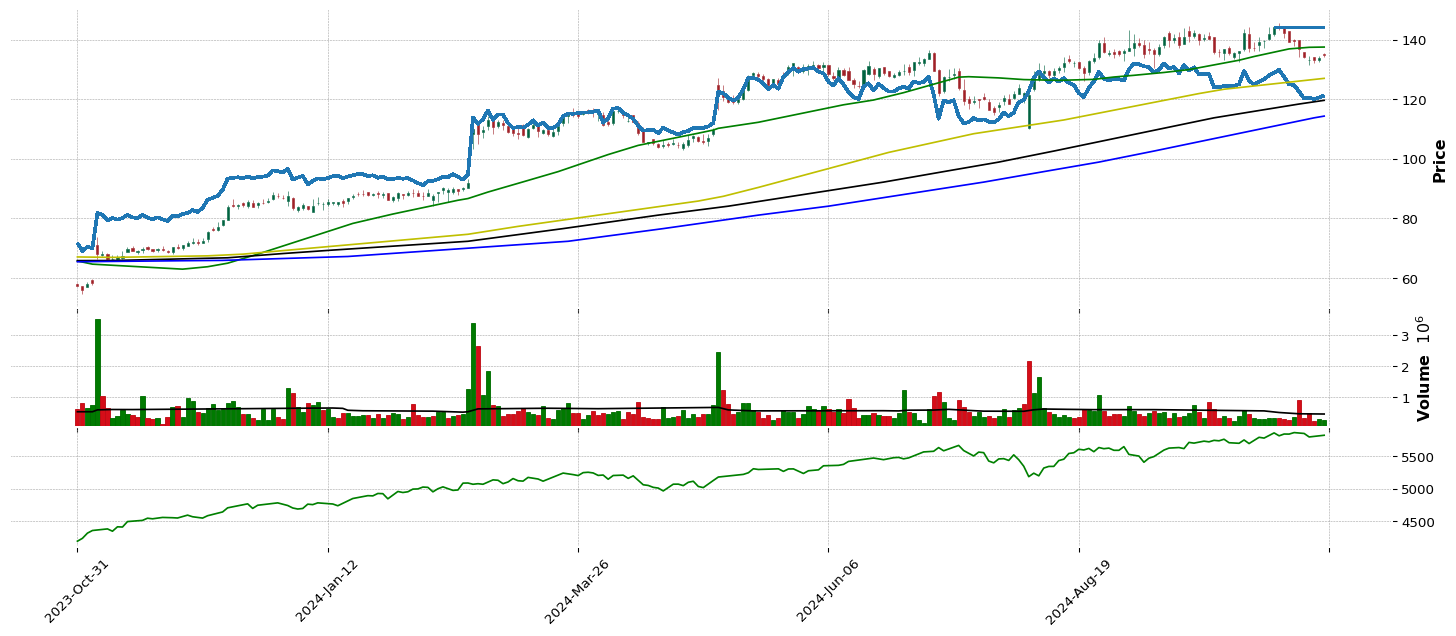
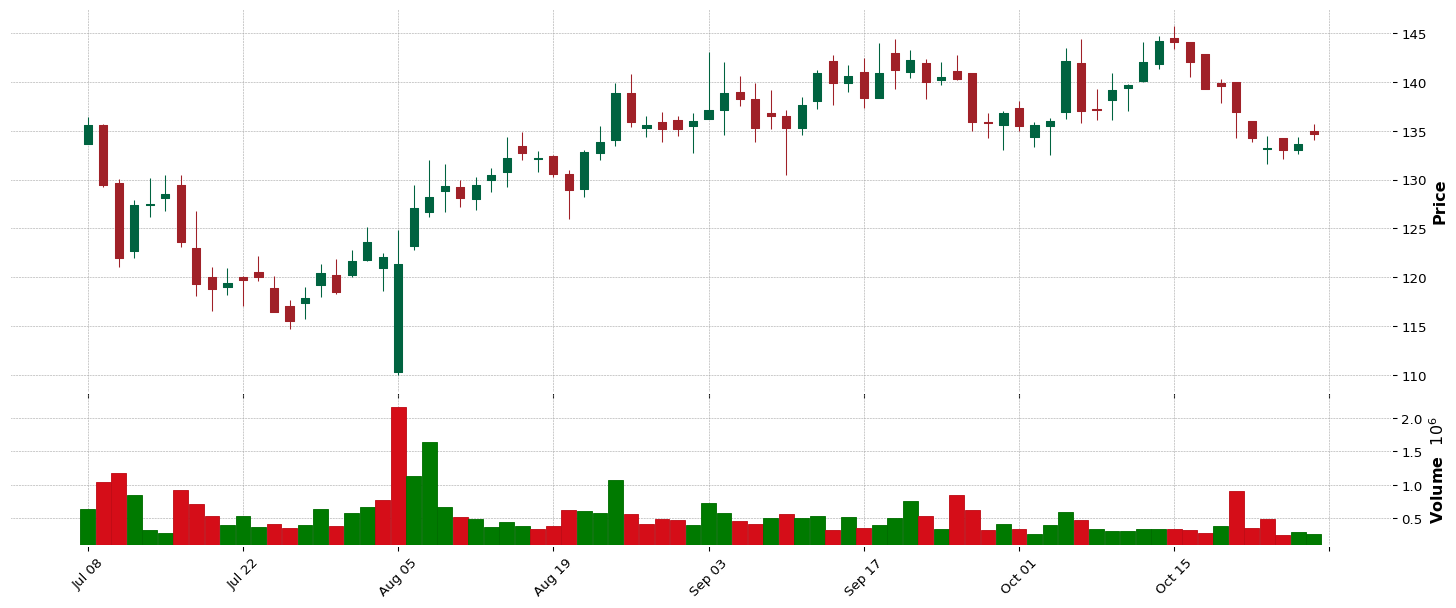
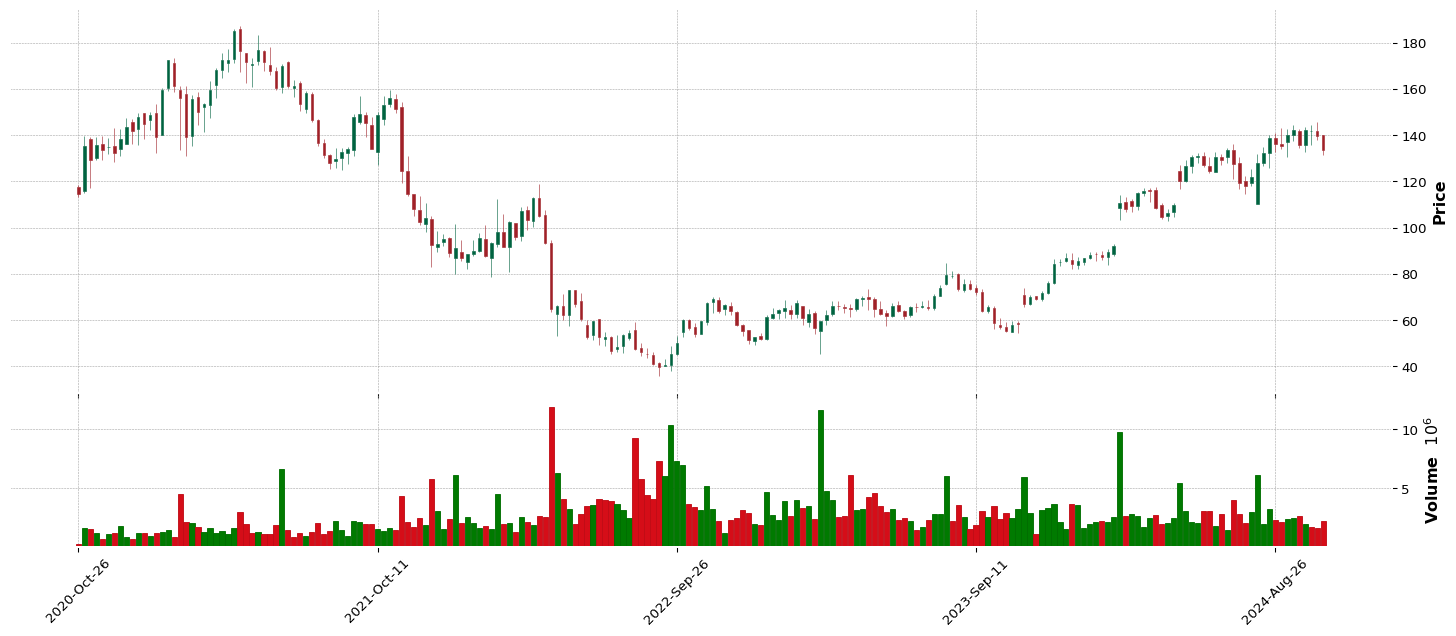
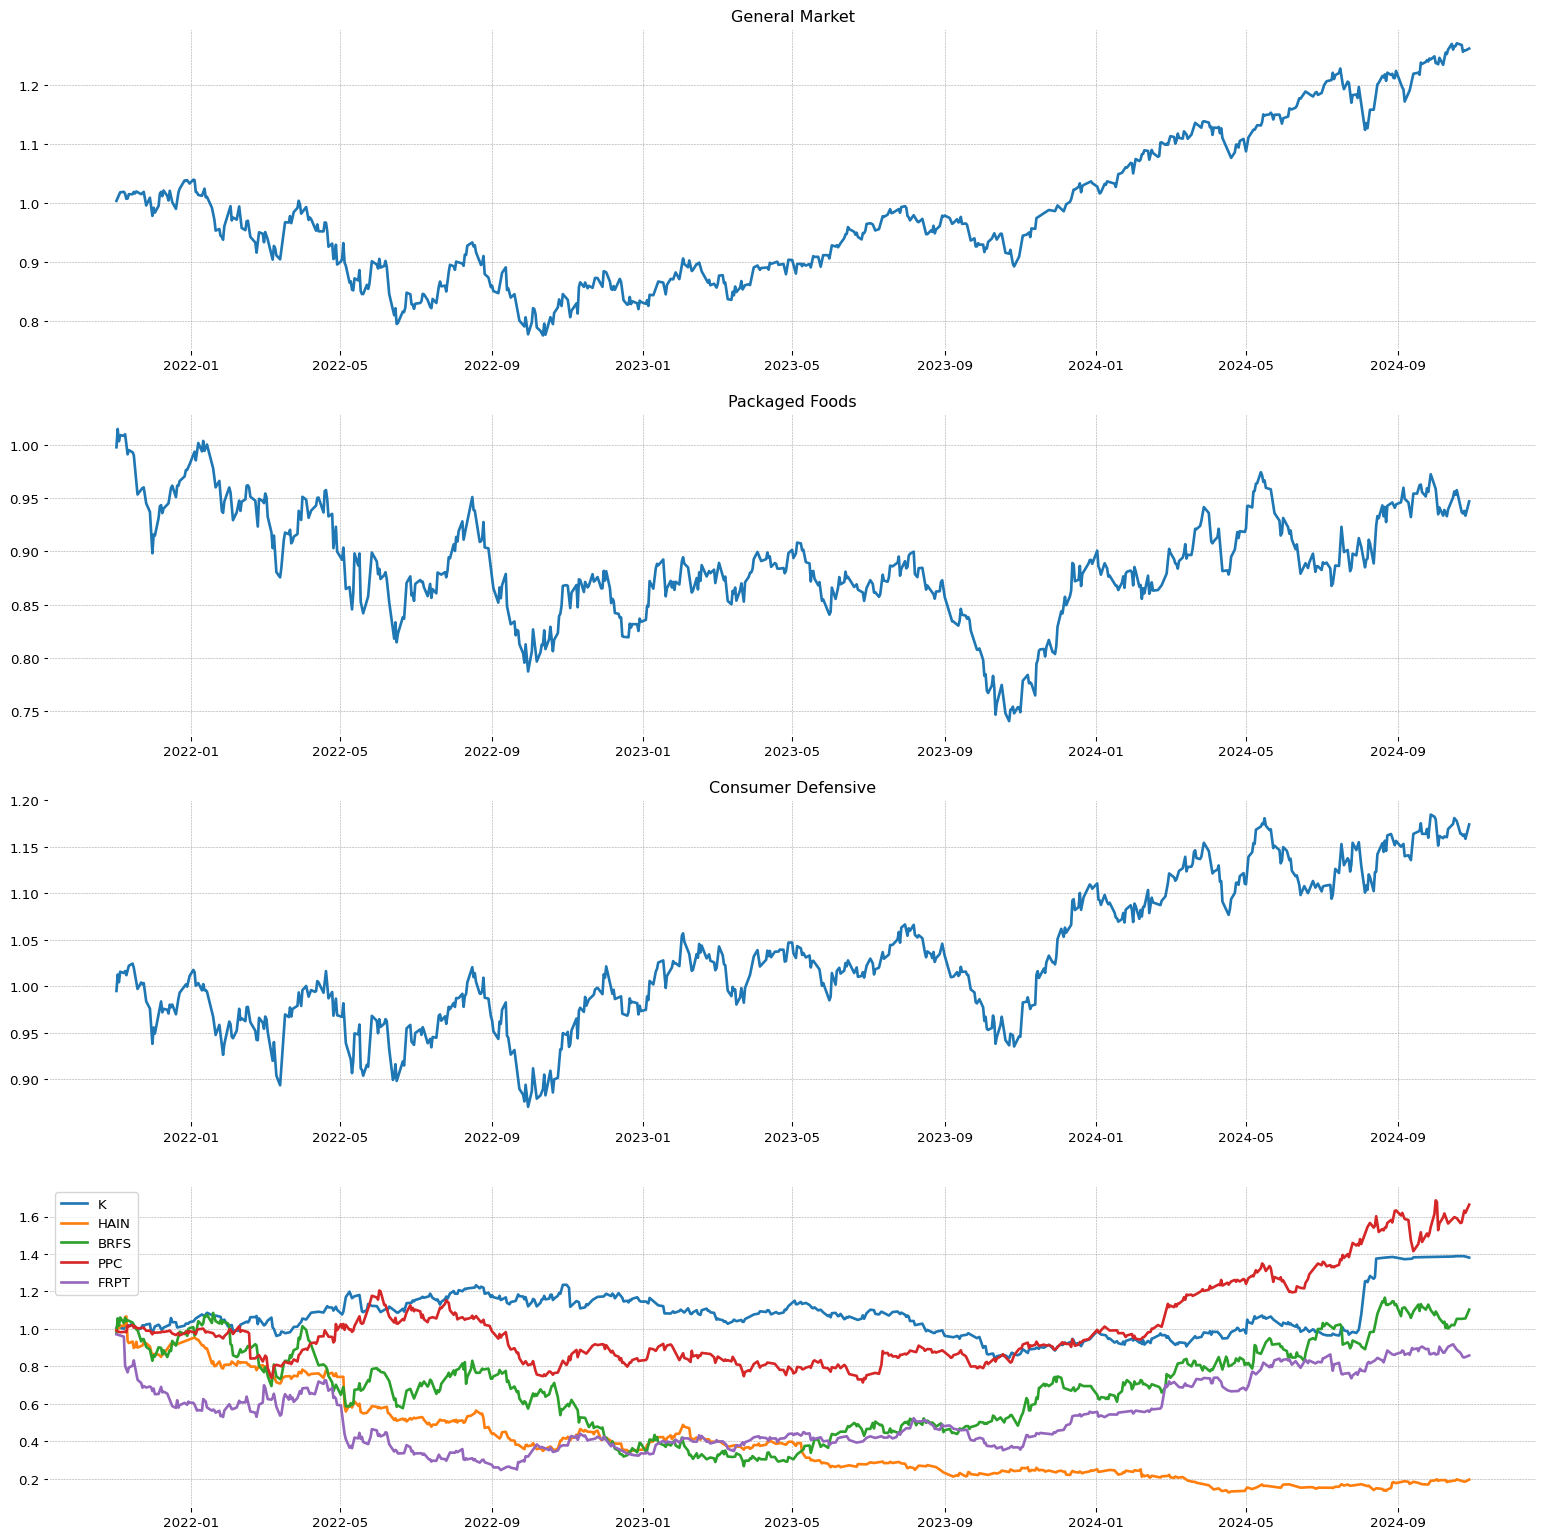 MOD
MOD
**** TECNICO ****
MOD
| Total stock number: | 51.34M |
| Namee: | Modine Manufacturing Company |
| IPO date: | 1982-09-20 |
| SMR | EPS | RS |
56.88 | 65.97 | 97 |
| Sector | Sector Position |
| Consumer Cyclical | 6/11 |
| Industry | Industry Position - | Stock on industry - | RSI Sector: |
| Auto Parts | 136/147 | 2/32 | 45/351 |
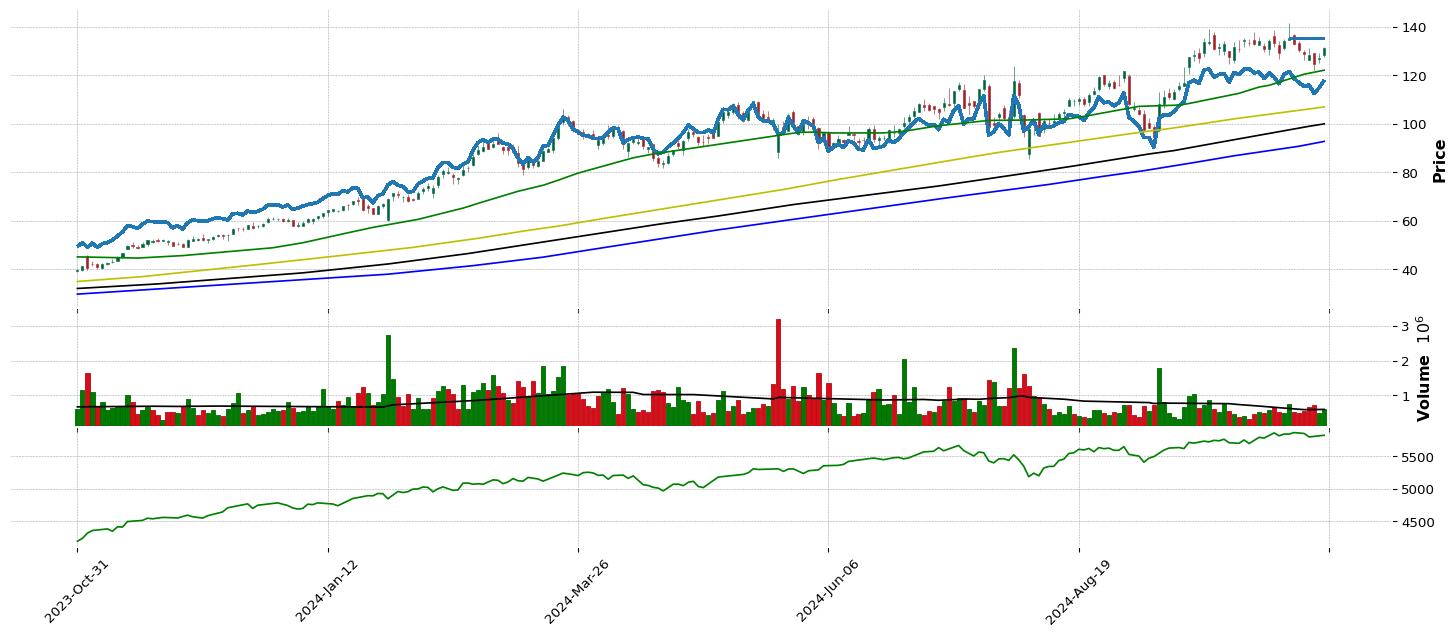
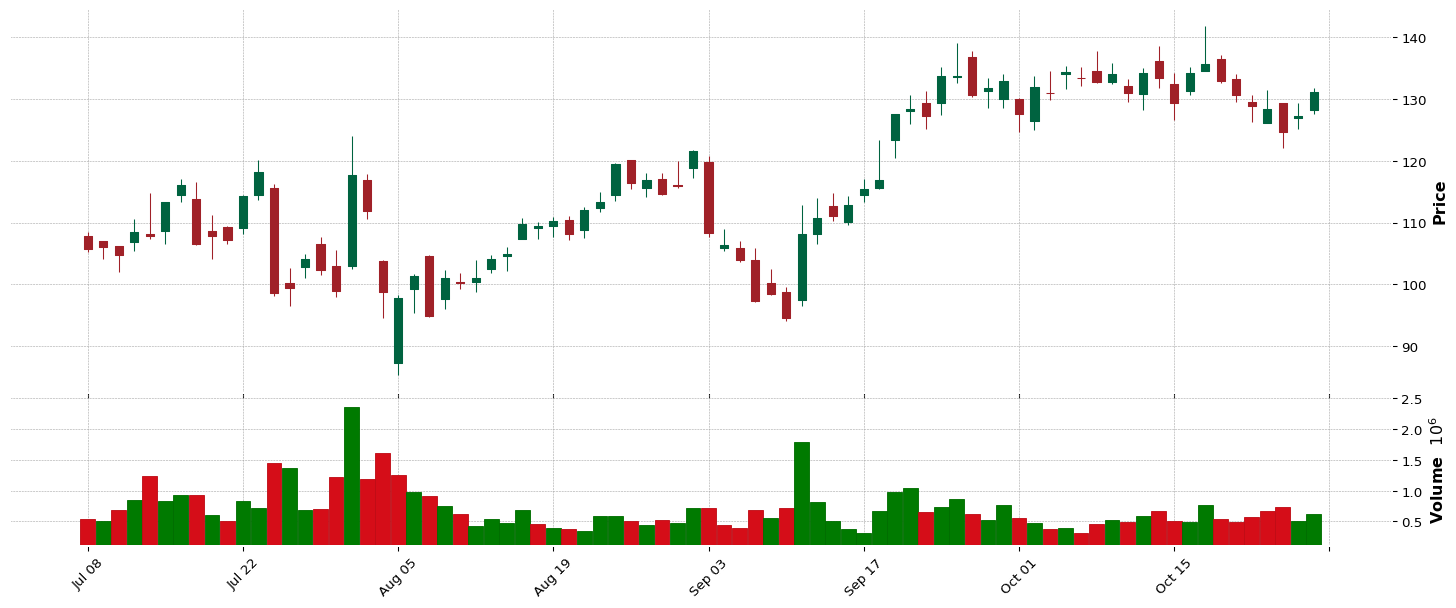
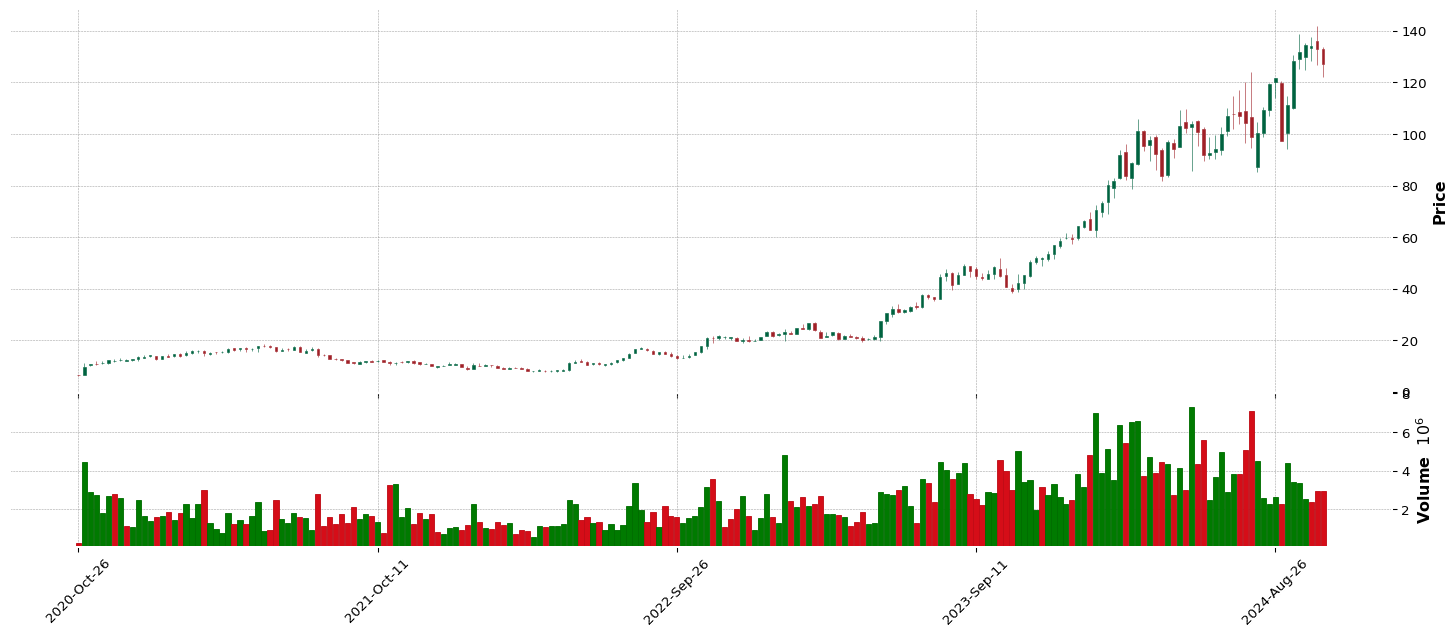
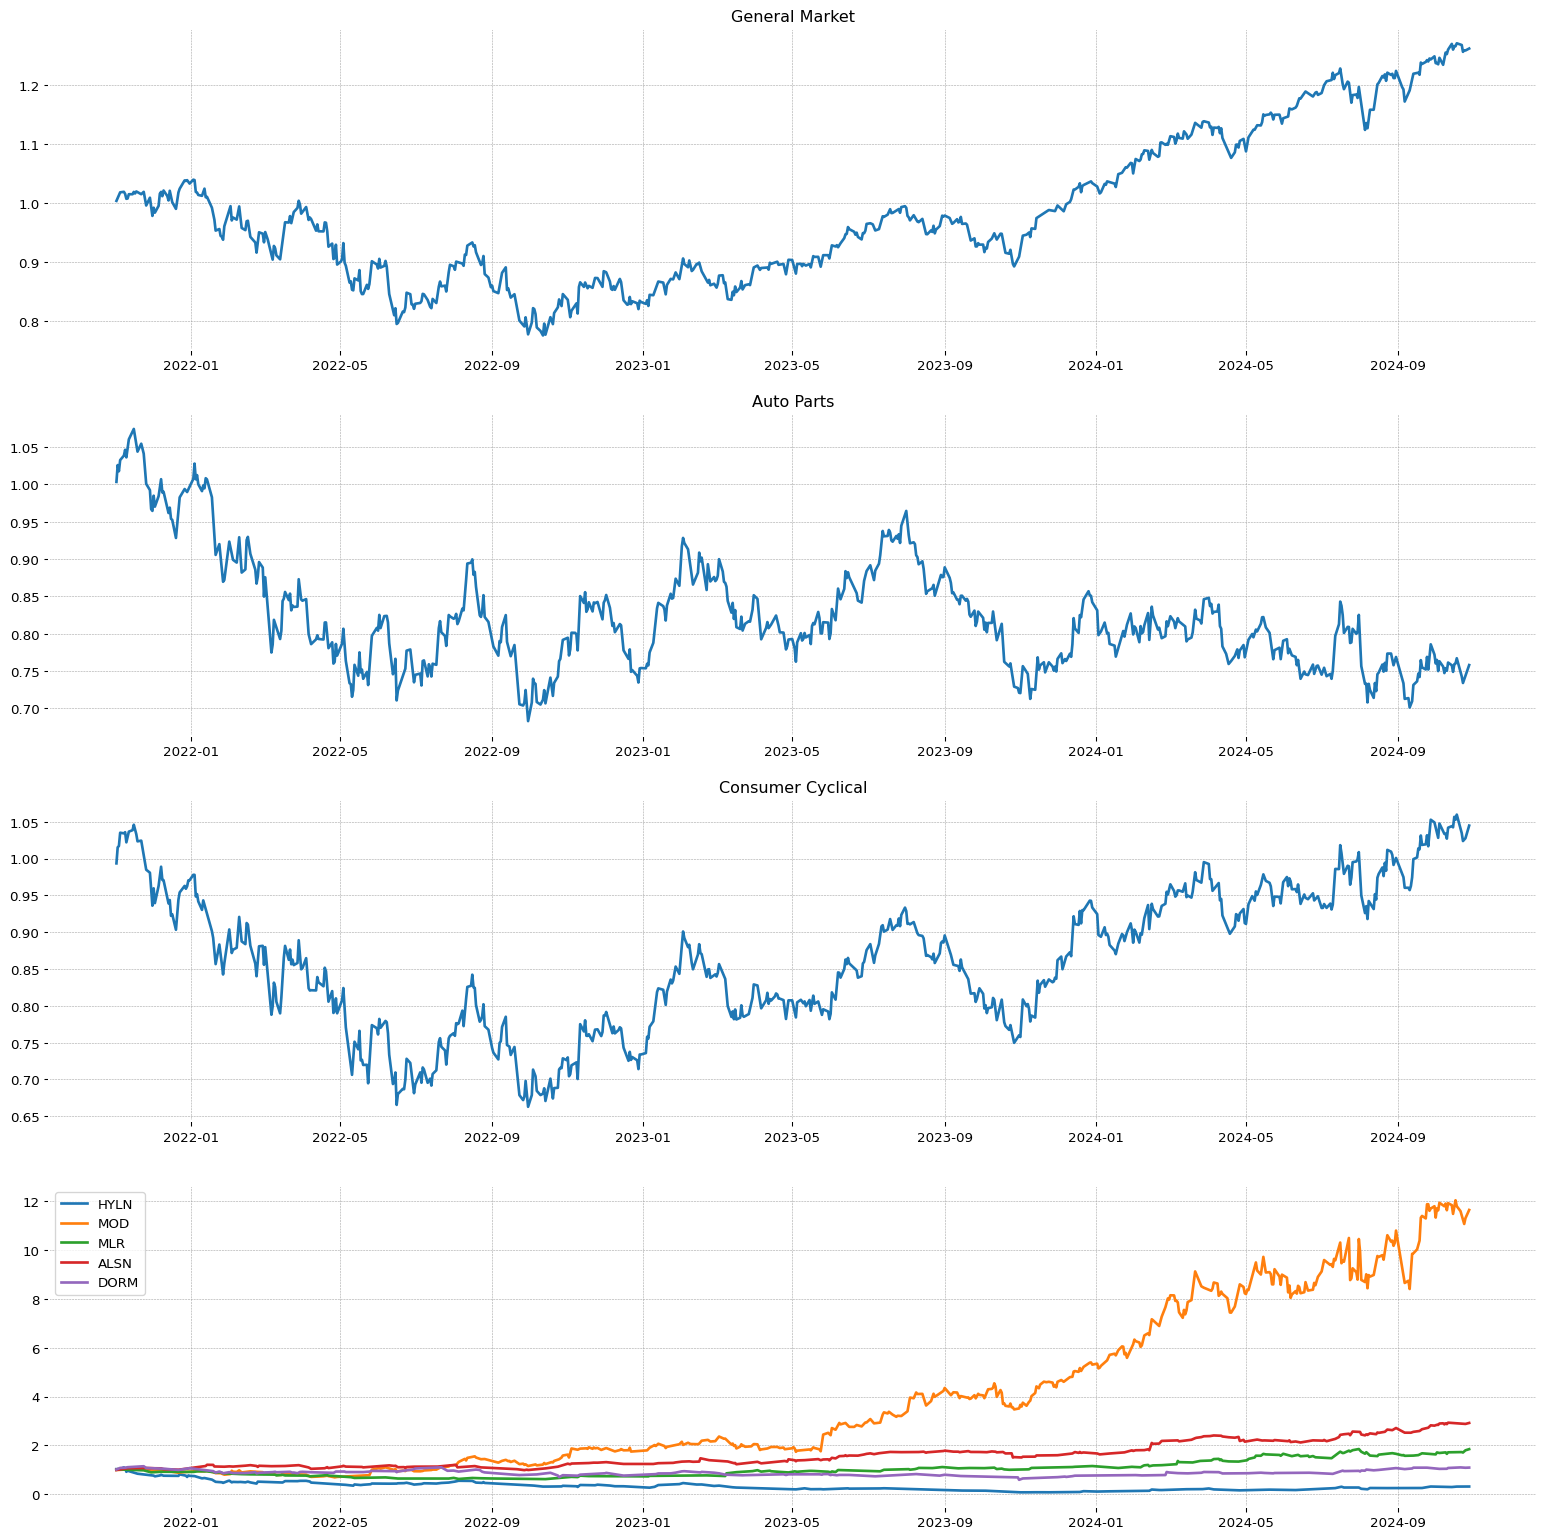 IRM
IRM
**** TECNICO ****
IRM
| Total stock number: | 290.75M |
| Namee: | Iron Mountain Incorporated |
| IPO date: | 1996-02-01 |
| Sector | Sector Position |
| Real Estate | 5/11 |
| Industry | Industry Position - | Stock on industry - | RSI Sector: |
| REIT - Specialty | 53/147 | 1/16 | 4/178 |
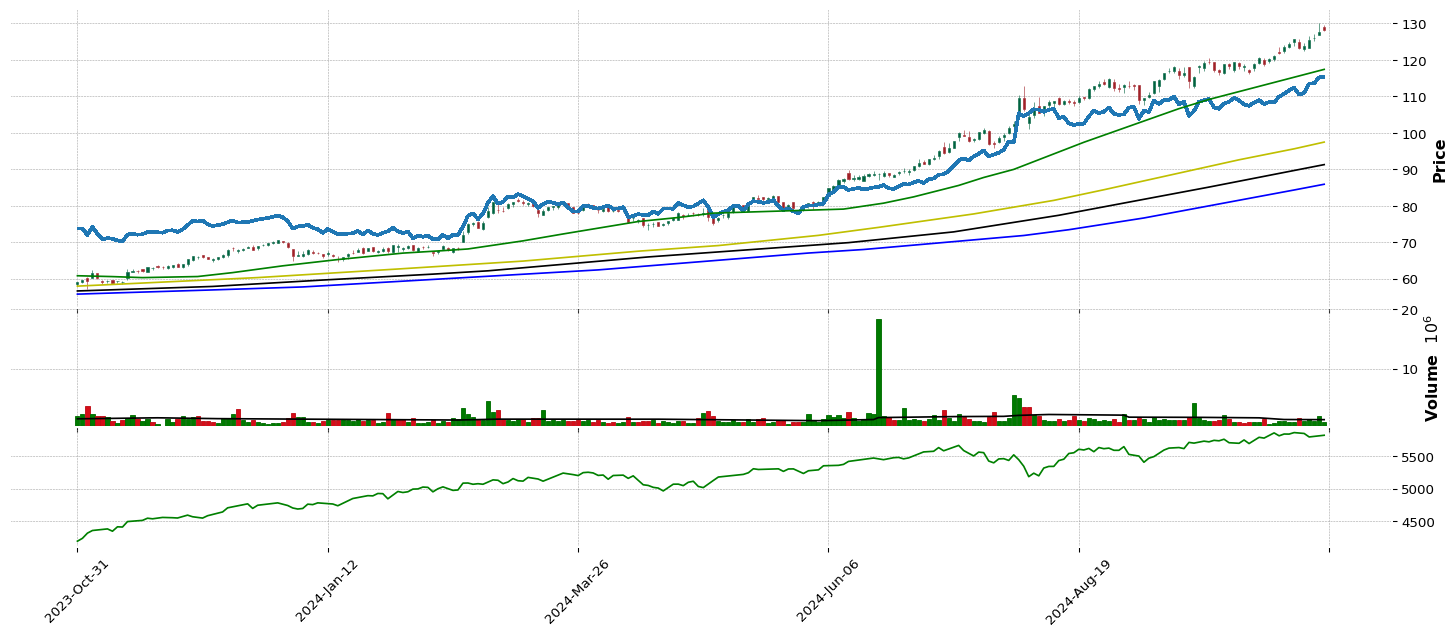
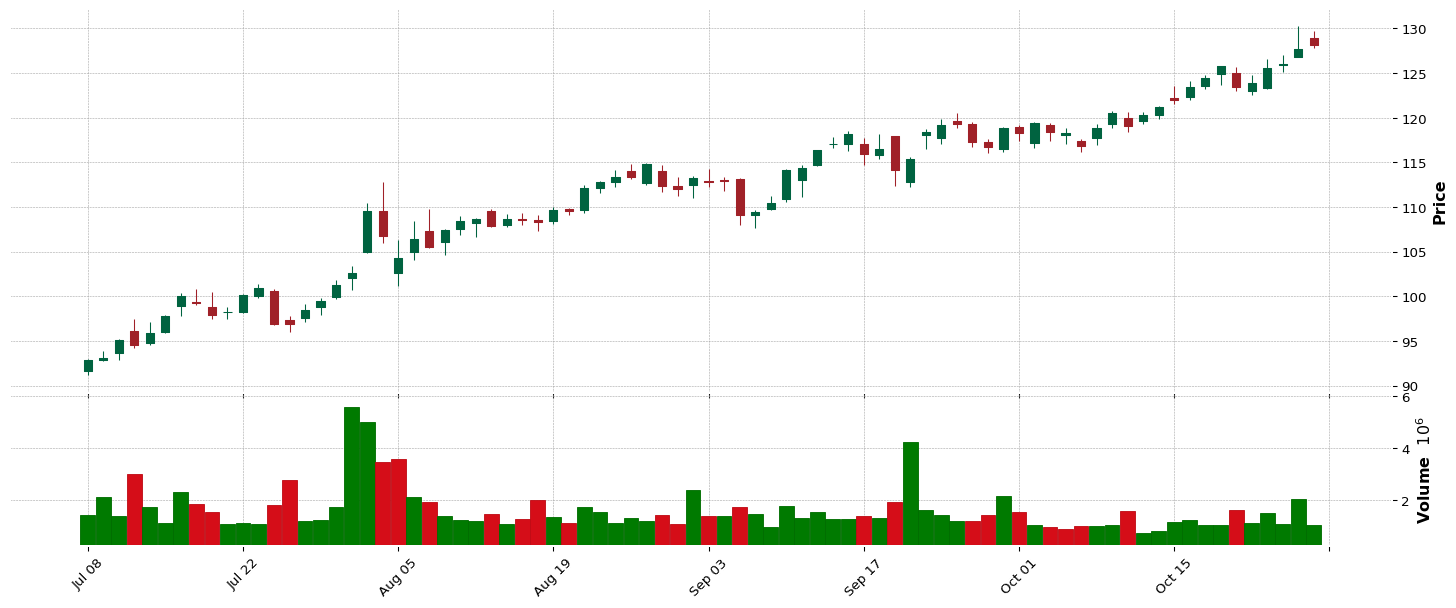
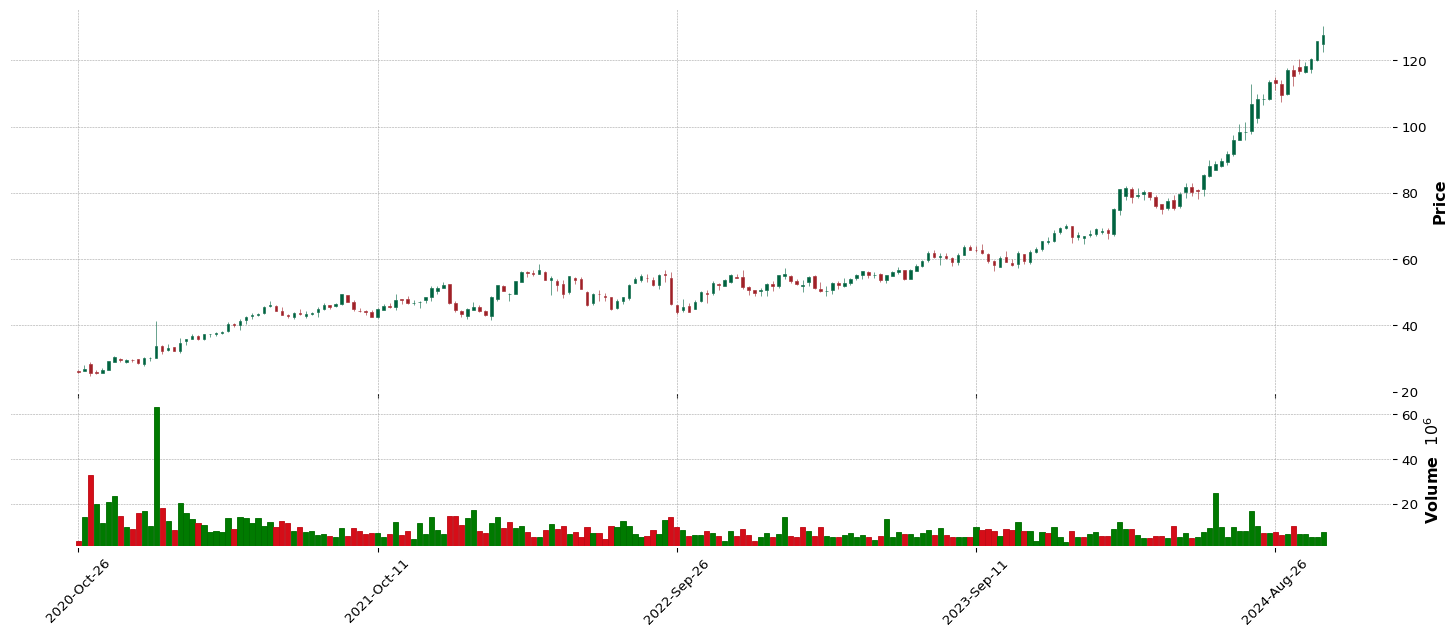
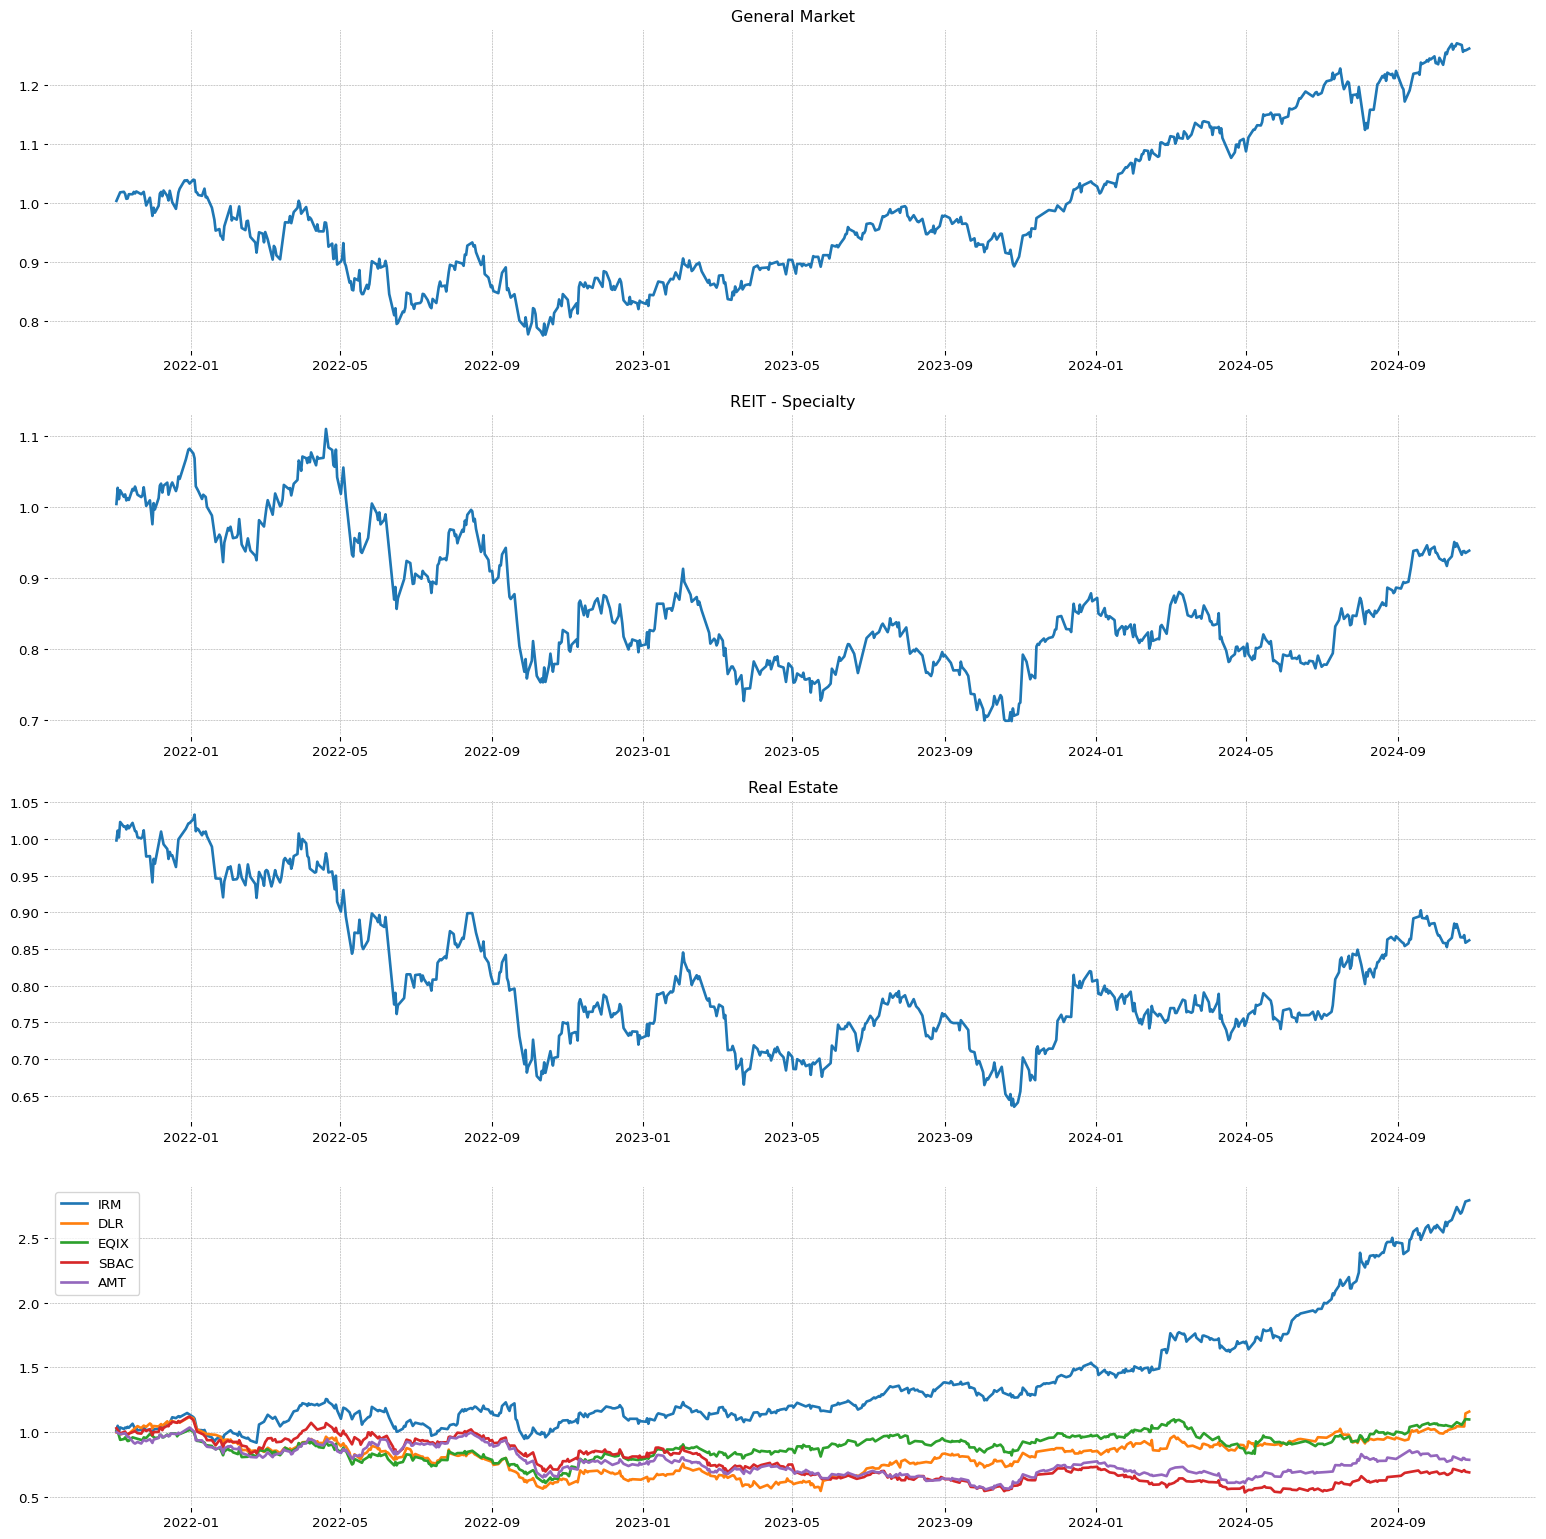 NMM
NMM
**** TECNICO ****
NMM
| Total stock number: | 17.78M |
| Namee: | Navios Maritime Partners L.P. |
| IPO date: | 2007-11-13 |
| Sector | Sector Position |
| Industrials | 7/11 |
| Industry | Industry Position - | Stock on industry - | RSI Sector: |
| Marine Shipping | 115/147 | 2/15 | 65/402 |
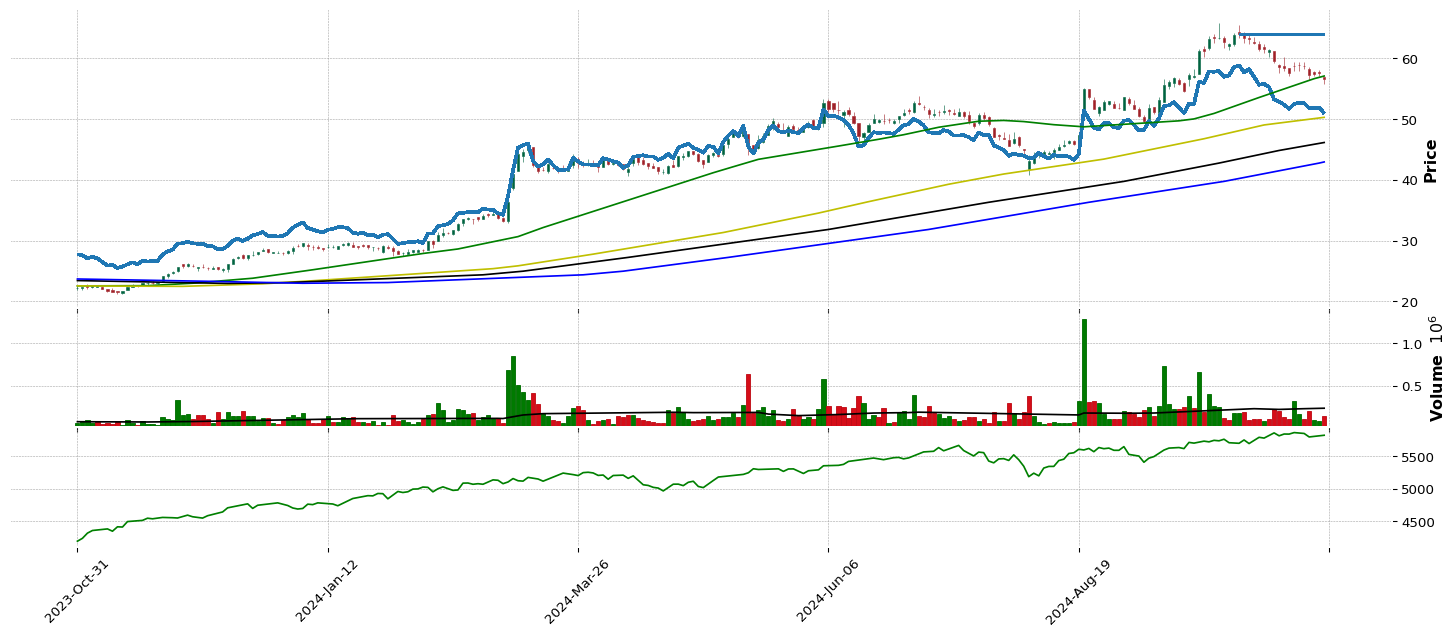
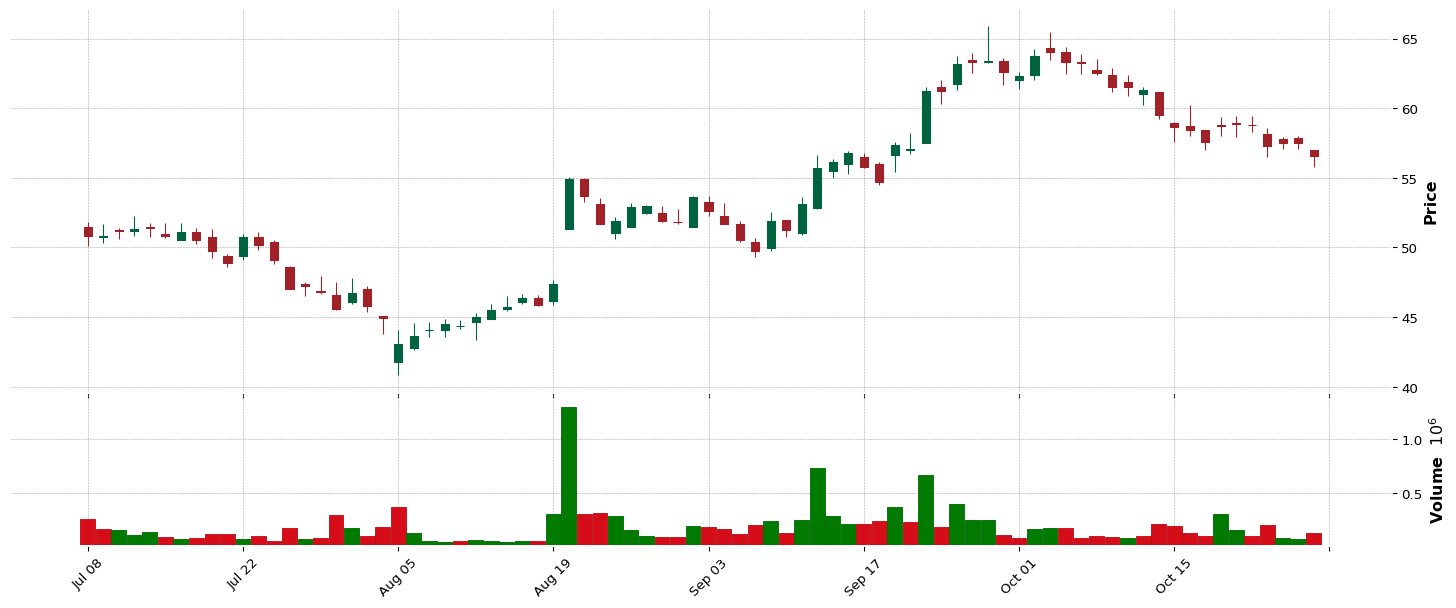
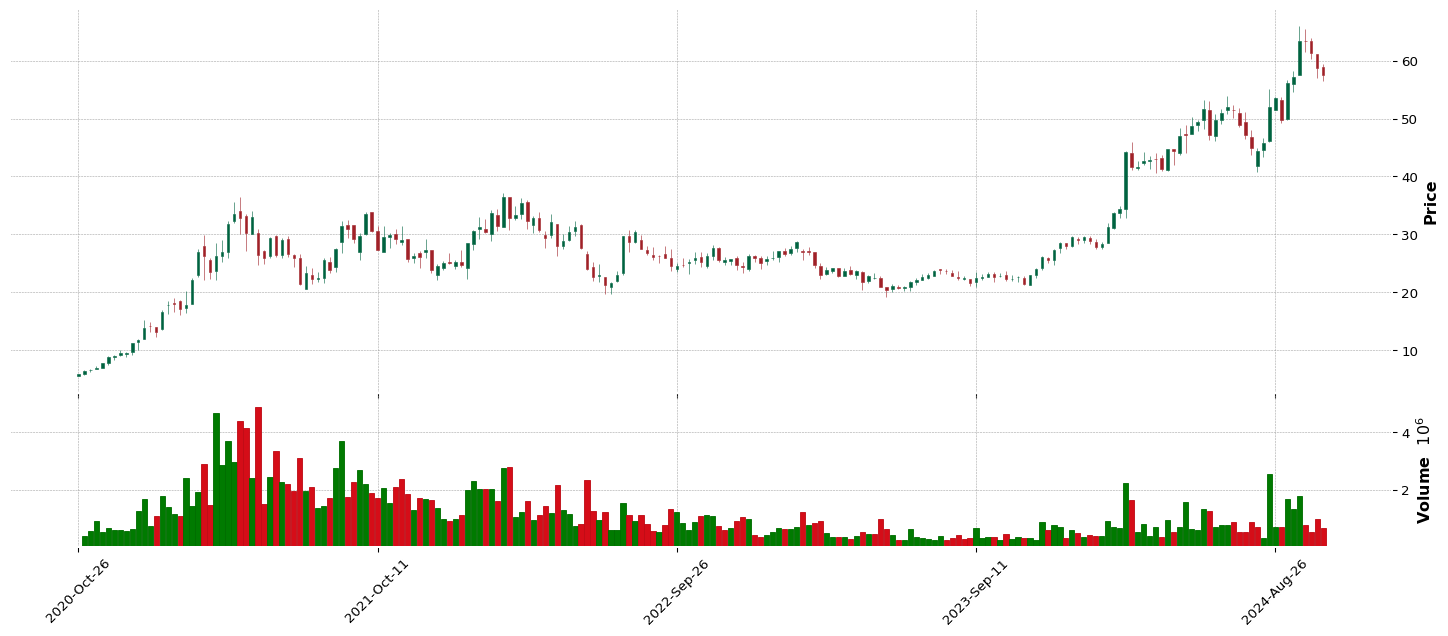
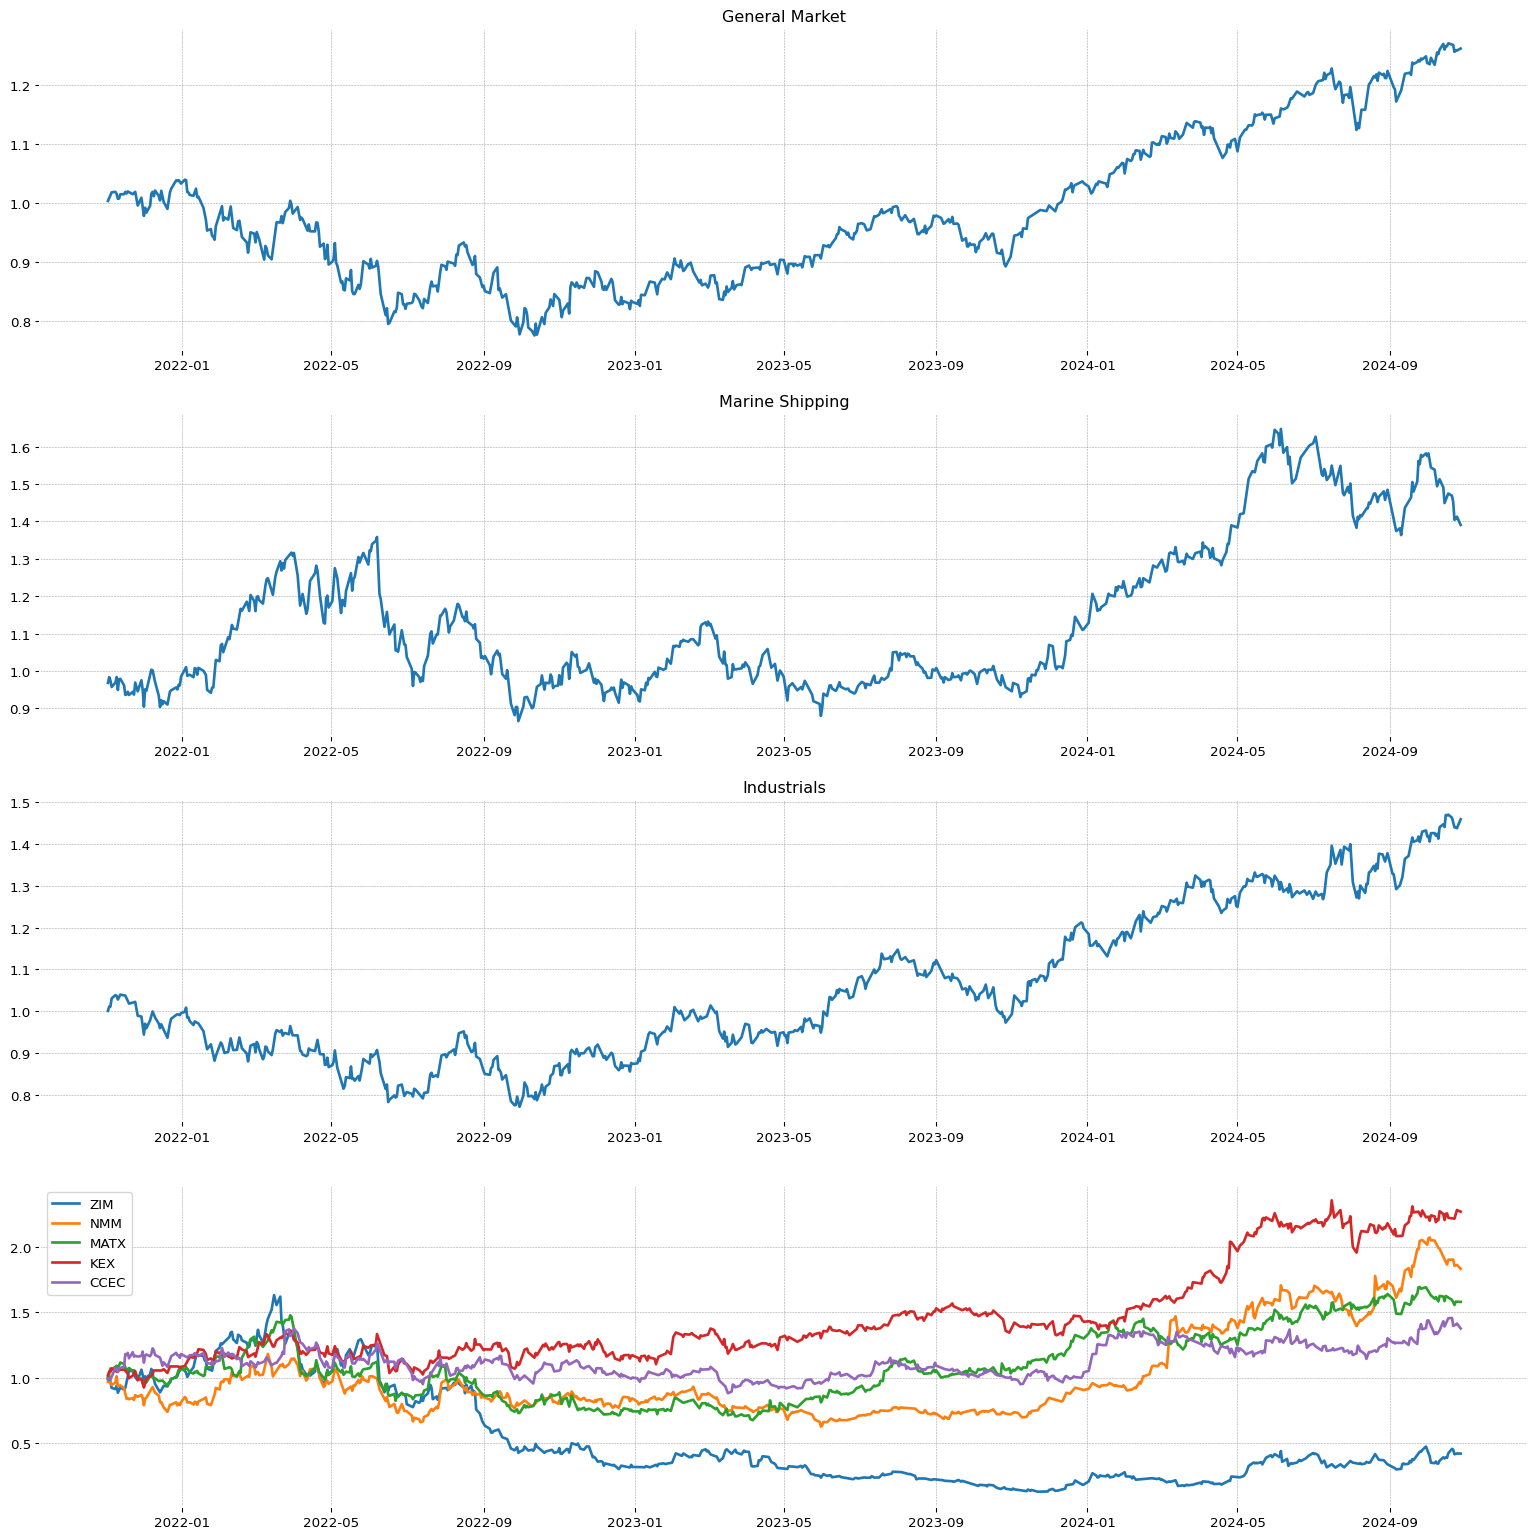 TGS
TGS
**** TECNICO ****
TGS
| Total stock number: | 156.84M |
| Namee: | Transportadora de Gas del Sur S.A. |
| IPO date: | 1994-11-17 |
| SMR | EPS | RS |
84.08 | 100.0 | 91 |
| Sector | Sector Position |
| Energy | 11/11 |
| Industry | Industry Position - | Stock on industry - | RSI Sector: |
| Oil & Gas Integrated | 132/147 | 2/17 | 25/182 |


 TSM
TSM
**** TECNICO ****
TSM
| Total stock number: | 23.36B |
| Namee: | Taiwan Semiconductor Manufacturing Company Limited |
| IPO date: | 1997-10-09 |
| SMR | EPS | RS |
38.27 | 67.58 | 92 |
| Sector | Sector Position |
| Technology | 2/11 |
| Industry | Industry Position - | Stock on industry - | RSI Sector: |
| Semiconductors | 79/147 | 6/47 | 65/445 |

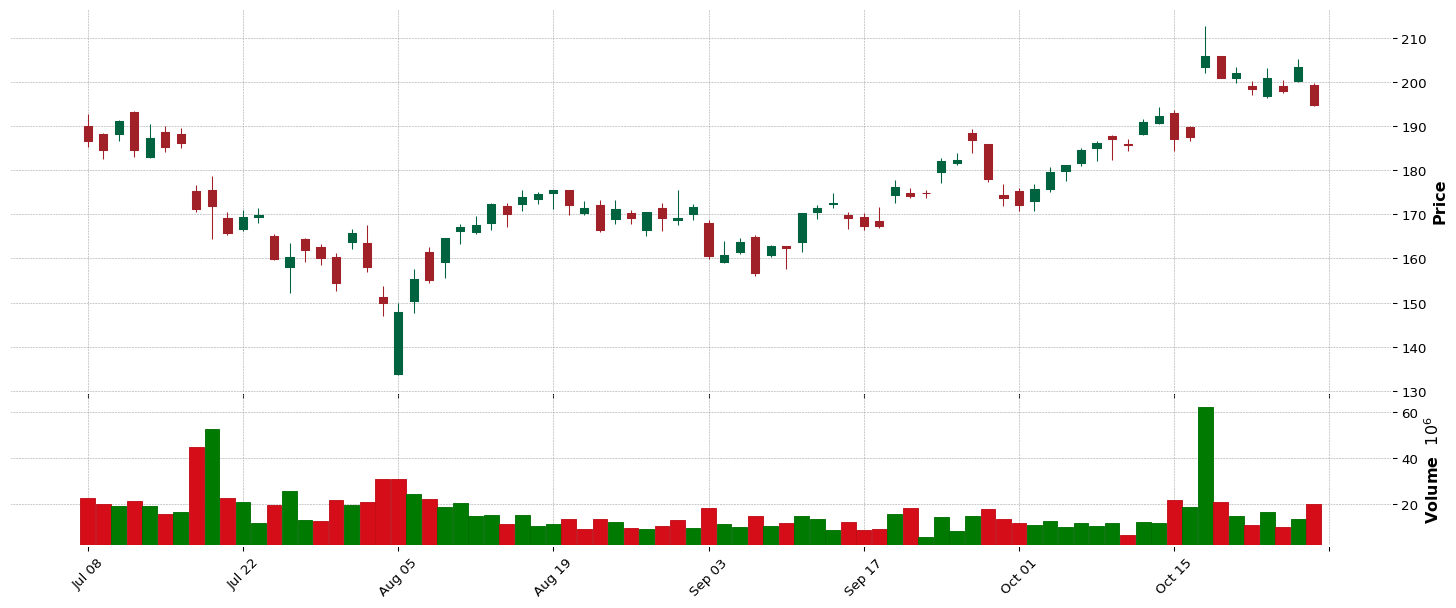
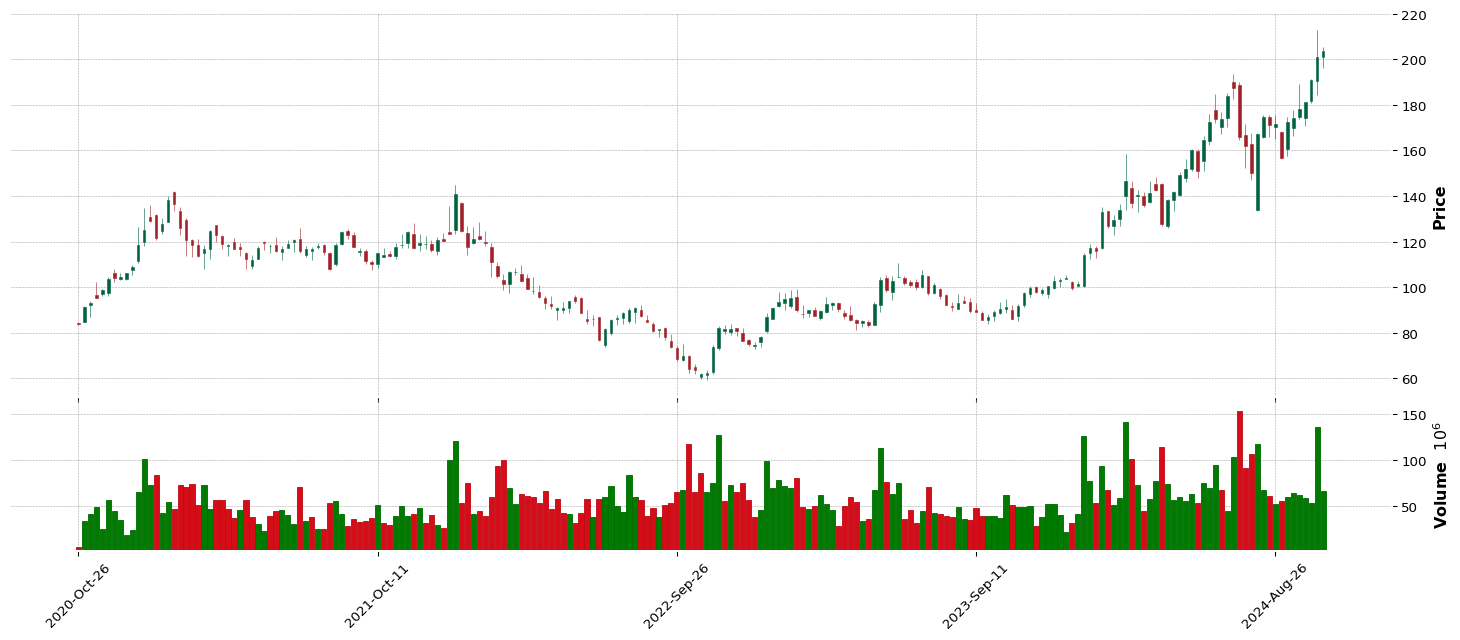
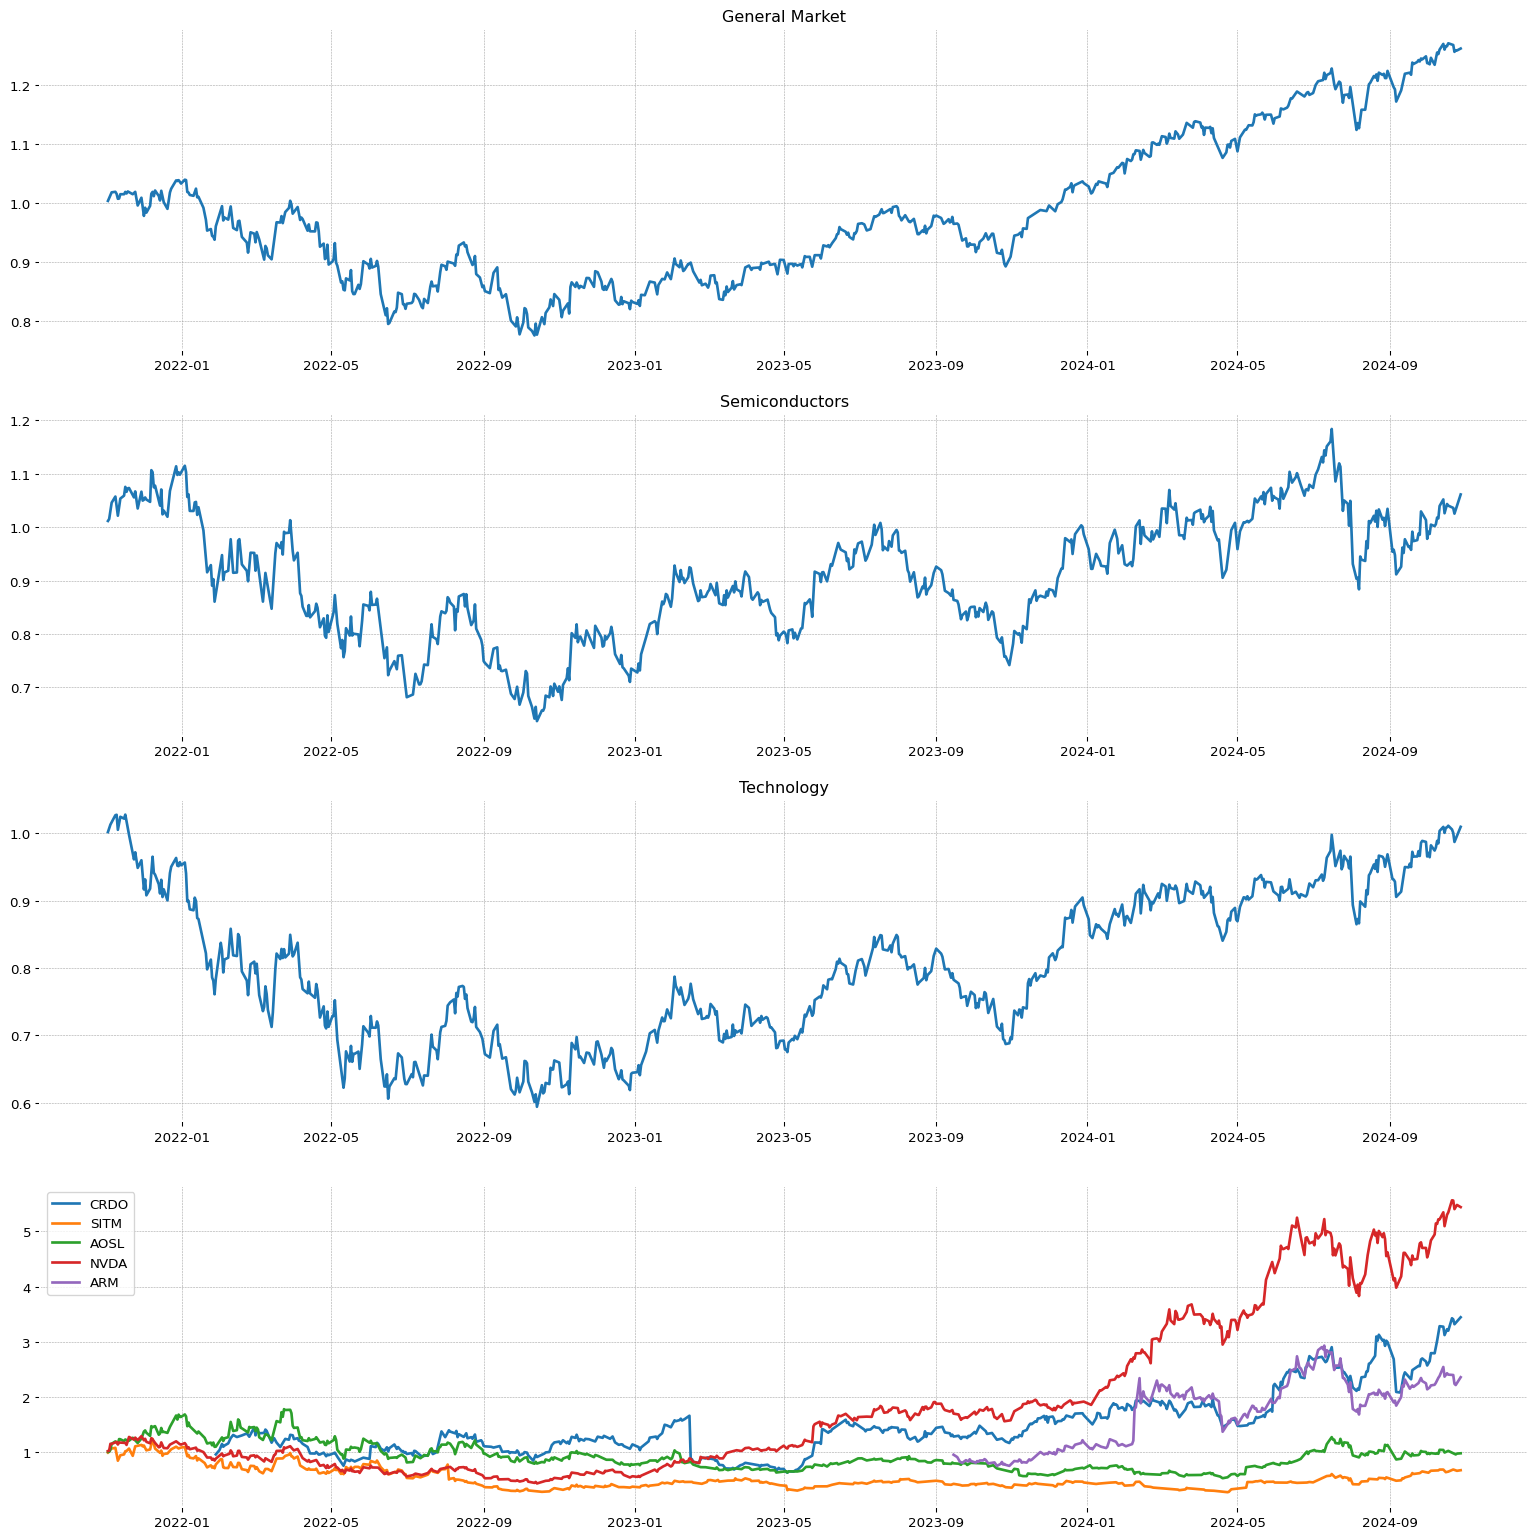 HLNE
HLNE


 LENZ
LENZ


 FTAI
FTAI


 SMR
SMR


 HROW
HROW


 PLTR
PLTR


 VHI
VHI


 TRUP
TRUP


 SEZL
SEZL


 HBB
HBB


 VNO
VNO


 CVNA
CVNA


 CRDO
CRDO


 LBPH
LBPH


 WGS
WGS


 CMPO
CMPO


 RNA
RNA


 GGAL
GGAL


 BWIN
BWIN


 NGVC
NGVC


 CLBT
CLBT


 PRCT
PRCT


 LMB
LMB


 LENZ
LENZ


 JXN
JXN


 KKR
KKR


 QTWO
QTWO


 ARM
ARM


 SFM
SFM


 AGX
AGX


 BV
BV


 QFIN
QFIN


 HBB
HBB


 MLI
MLI


 CVNA
CVNA


 DOGZ
DOGZ


 VST
VST


 RDNT
RDNT


 RCL
RCL


 ZETA
ZETA


 WGS
WGS


 PRMW
PRMW


 LE
LE


 FRPT
FRPT


 MOD
MOD


 IRM
IRM


 NMM
NMM


 TGS
TGS


 TSM
TSM


 HLNE
HLNE