***************************
Market view: 3/7 (if value is >7 be careful)
Best 50 stock divided by Sector
| Sector Name | Valore |
| Healthcare | 19 |
| Industrials | 13 |
| Technology | 6 |
| Consumer Cyclical | 5 |
| Financial | 3 |
| Utilities | 1 |
| Communication Services | 1 |
| Consumer Defensive | 1 |
| Basic Materials | 1 |
| Industry Name | Valore |
| Biotechnology | 16 |
| Aerospace & Defense | 4 |
| Software - Application | 2 |
| Rental & Leasing Services | 2 |
| Restaurants | 2 |
| Engineering & Construction | 2 |
| Household & Personal Products | 1 |
| Internet Retail | 1 |
| Internet Content & Information | 1 |
| Pollution & Treatment Controls | 1 |
| Insurance - Property & Casualty | 1 |
| Marine Shipping | 1 |
| Leisure | 1 |
| Electronics & Computer Distribution | 1 |
| Specialty Chemicals | 1 |
| Healthcare Plans | 1 |
| Financial Conglomerates | 1 |
| Utilities - Independent Power Producers | 1 |
| Semiconductors | 1 |
| Metal Fabrication | 1 |
| Electrical Equipment & Parts | 1 |
| Credit Services | 1 |
| Specialty Industrial Machinery | 1 |
| Medical Devices | 1 |
| Auto & Truck Dealerships | 1 |
| Communication Equipment | 1 |
| Computer Hardware | 1 |
| Health Information Services | 1 |
| Pos. | | Name | | Today | | 3 weeks | | 6 weeks | | 26 weeks | | 1DAY | | Ytoday | | 1YEAR | |
| 1.0 | Healthcare | 100.0 | 100.0 | 90.0 | 100.0 | 0.32 | 34.86 | 58.08 |
| 2.0 | Technology | 90.0 | 81.0 | 100.0 | 81.0 | 0.39 | 30.32 | 46.14 |
| 3.0 | Consumer Cyclical | 81.0 | 90.0 | 72.0 | 90.0 | 0.16 | 34.45 | 55.69 |
| 4.0 | Industrials | 72.0 | 72.0 | 45.0 | 63.0 | -0.08 | 28.13 | 40.77 |
| 5.0 | Financial | 63.0 | 63.0 | 81.0 | 72.0 | 0.06 | 19.44 | 34.55 |
| 6.0 | Consumer Defensive | 54.0 | 54.0 | 63.0 | 54.0 | 0.55 | 22.15 | 33.93 |
| 7.0 | Real Estate | 45.0 | 45.0 | 54.0 | 27.0 | -0.04 | 12.41 | 23.54 |
| 8.0 | Energy | 36.0 | 27.0 | 27.0 | 45.0 | 0.45 | 17.94 | 25.6 |
| 9.0 | Communication Services | 27.0 | 18.0 | 9.0 | 18.0 | 0.03 | 10.53 | 19.83 |
| 10.0 | Utilities | 18.0 | 9.0 | 36.0 | 9.0 | 0.1 | 10.1 | 16.7 |
| Pos. | | Name | | Today | | 3 weeks | | 6 weeks | | 26 weeks | | 1DAY | | Ytoday | | 1YEAR | | || | Pos. | | Name | | Today | | 3 weeks | | 6 weeks | | 26 weeks | | 1DAY | | 7DAY | | 30DAY | | Ytoday | | 1YEAR | | Ratio_GP | | Ratio_NI | | ROE | | |
| 1.0 | Auto & Truck Dealerships | 100.0 | 100.0 | 89.0 | 80.0 | -0.96 | 146.67 | 193.37 | 28.21 | -1.4 | 29.55 | || | 26.0 | Railroads | 82.0 | 46.0 | 66.0 | 34.0 | 0.26 | 19.13 | 30.74% | 34.43 | -0.59 | 11.85 |
| 2.0 | Industrial Distribution | 99.0 | 99.0 | 3.0 | 23.0 | -0.22 | 130.81 | 143.16 | 28.8 | 5.22 | 20.24 | || | 27.0 | Aerospace & Defense | 82.0 | 74.0 | 71.0 | 74.0 | -0.28 | 37.38 | 49.11% | 26.66 | -4.84 | 6.65 |
| 3.0 | Infrastructure Operations | 98.0 | 97.0 | 97.0 | 84.0 | 1.17 | 58.38 | 91.84 | 86.2 | 9.91 | 12.19 | || | 28.0 | Travel Services | 81.0 | 74.0 | 53.0 | 90.0 | 0.86 | 23.27 | 47.34% | 52.87 | 24.21 | 17.93 |
| 4.0 | Farm Products | 97.0 | 97.0 | 98.0 | 96.0 | 0.44 | 108.42 | 174.71 | 19.66 | 11.12 | 13.73 | || | 29.0 | Confectioners | 80.0 | 67.0 | 20.0 | 87.0 | 0.39 | 32.62 | 54.14% | 39.3 | 9.81 | 26.57 |
| 5.0 | Paper & Paper Products | 97.0 | 98.0 | 100.0 | 95.0 | 1.1 | 78.31 | 84.74 | 19.57 | -0.16 | 12.68 | || | 30.0 | Information Technology Services | 80.0 | 89.0 | 94.0 | 42.0 | 1.19 | 22.53 | 32.07% | 30.72 | -2.74 | 26.99 |
| 6.0 | Biotechnology | 96.0 | 96.0 | 59.0 | 89.0 | 0.07 | 46.0 | 73.56 | 44.2 | 476.06 | 26.91 | || | 31.0 | REIT - Retail | 79.0 | 64.0 | 69.0 | 73.0 | 0.0 | 29.4 | 42.83% | 58.8 | 23.63 | 5.85 |
| 7.0 | Mortgage Finance | 95.0 | 85.0 | 95.0 | 55.0 | -1.33 | 31.15 | 53.58 | 78.67 | 4.5 | -0.91 | || | 32.0 | Discount Stores | 78.0 | 44.0 | 21.0 | 26.0 | -0.12 | 29.12 | 38.0% | 31.68 | 3.69 | 17.53 |
| 8.0 | Software - Application | 95.0 | 94.0 | 51.0 | 79.0 | 0.14 | 52.35 | 71.88 | 60.18 | 0.5 | 0.53 | || | 33.0 | Software - Infrastructure | 78.0 | 73.0 | 70.0 | 68.0 | -0.35 | 21.3 | 38.72% | 59.89 | -2.74 | 4.14 |
| 9.0 | Healthcare Plans | 94.0 | 95.0 | 96.0 | 21.0 | -0.29 | 24.98 | 30.49 | 47.73 | 0.29 | -5.42 | || | 34.0 | Metal Fabrication | 77.0 | 87.0 | 84.0 | 76.0 | 0.75 | 41.4 | 53.27% | 23.76 | 4.15 | 7.6 |
| 10.0 | Consulting Services | 93.0 | 88.0 | 85.0 | 61.0 | 0.23 | 21.49 | 36.0 | 42.58 | 10.36 | 19.61 | || | 35.0 | REIT - Industrial | 76.0 | 77.0 | 75.0 | 36.0 | 0.03 | 17.16 | 35.74% | 52.78 | 25.79 | 5.35 |
| 11.0 | Leisure | 93.0 | 95.0 | 93.0 | 82.0 | -0.53 | 47.17 | 89.86 | 43.38 | -1.89 | -3.43 | || | 36.0 | Banks - Regional | 76.0 | 71.0 | 70.0 | 60.0 | -0.11 | 19.27 | 34.09% | 87.7 | 16.17 | 12.16 |
| 12.0 | Oil & Gas Refining & Marketing | 92.0 | 92.0 | 92.0 | 47.0 | 0.31 | 47.09 | 67.07 | 16.23 | 2.66 | 20.57 | || | 37.0 | Insurance - Reinsurance | 75.0 | 82.0 | 87.0 | 44.0 | 0.65 | 21.29 | 30.76% | 91.2 | 18.32 | 17.7 |
| 13.0 | Computer Hardware | 91.0 | 51.0 | 57.0 | 86.0 | 2.55 | 47.76 | 54.94 | 42.47 | -9.65 | -8.01 | || | 38.0 | Insurance Brokers | 74.0 | 87.0 | 91.0 | 95.0 | 0.08 | 30.19 | 49.95% | 45.61 | 8.96 | 3.74 |
| 14.0 | Lodging | 91.0 | 93.0 | 99.0 | 100.0 | -0.61 | 260.2 | 442.46 | 32.05 | 11.08 | 18.69 | || | 39.0 | Insurance - Property & Casualty | 74.0 | 65.0 | 54.0 | 91.0 | -0.08 | 43.79 | 50.71% | 87.86 | 8.63 | 4.98 |
| 15.0 | Communication Equipment | 90.0 | 91.0 | 95.0 | 80.0 | -0.12 | 29.08 | 52.1 | 35.29 | -11.02 | 9.4 | || | 40.0 | Electronics & Computer Distribution | 73.0 | 66.0 | 68.0 | 51.0 | 0.89 | 26.61 | 39.4% | 14.08 | 2.56 | 12.49 |
| 16.0 | Rental & Leasing Services | 89.0 | 91.0 | 90.0 | 78.0 | -0.52 | 55.39 | 81.16 | 41.3 | 12.54 | 10.8 | || | 41.0 | Auto Manufacturers | 72.0 | 65.0 | 57.0 | 30.0 | -0.51 | 15.23 | 31.33% | 5.32 | -26.38 | 22.43 |
| 17.0 | Medical Devices | 89.0 | 84.0 | 78.0 | 71.0 | 1.45 | 27.28 | 44.43 | 53.69 | -11.83 | -5.23 | || | 42.0 | Insurance - Life | 72.0 | 62.0 | 18.0 | 14.0 | 0.77 | 2.71 | 13.35% | 89.15 | 9.9 | 8.17 |
| 18.0 | Capital Markets | 88.0 | 89.0 | 93.0 | 57.0 | 0.45 | 25.47 | 40.41 | 50.39 | 9.31 | 2.92 | || | 43.0 | Entertainment | 71.0 | 80.0 | 52.0 | 12.0 | -0.63 | 17.77 | 26.18% | 44.19 | -3.5 | 3.44 |
| 19.0 | Utilities - Regulated Water | 87.0 | 90.0 | 81.0 | 38.0 | 0.43 | 36.63 | 44.24 | 44.17 | 6.0 | 3.77 | || | 44.0 | Lumber & Wood Production | 70.0 | 76.0 | 85.0 | 28.0 | 0.39 | 13.05 | 26.42% | 28.86 | 8.09 | 12.88 |
| 20.0 | Home Improvement Retail | 87.0 | 55.0 | 27.0 | 43.0 | -0.24 | 17.92 | 32.64 | 41.09 | 6.91 | 237.5 | || | 45.0 | REIT - Diversified | 70.0 | 78.0 | 79.0 | 39.0 | -0.34 | 15.92 | 23.18% | 62.31 | 17.15 | 2.66 |
| 21.0 | Thermal Coal | 86.0 | 85.0 | 88.0 | 59.0 | -0.23 | 21.65 | 24.82 | 37.86 | 45.64 | 27.18 | || | 46.0 | Farm & Heavy Construction Machinery | 69.0 | 80.0 | 76.0 | 88.0 | 0.75 | 22.46 | 40.7% | 26.94 | 7.52 | 29.64 |
| 22.0 | Pollution & Treatment Controls | 85.0 | 93.0 | 89.0 | 45.0 | 0.76 | 44.57 | 48.19 | 44.43 | 10.01 | 15.92 | || | 47.0 | Airlines | 68.0 | 29.0 | 17.0 | 10.0 | -0.04 | 29.8 | 34.93% | 17.85 | 3.27 | 25.31 |
| 23.0 | Real Estate - Diversified | 85.0 | 86.0 | 91.0 | 41.0 | -4.0 | 19.93 | 23.19 | 37.67 | -15.59 | -2.6 | || | 48.0 | REIT - Office | 68.0 | 75.0 | 65.0 | 46.0 | 0.0 | 8.96 | 25.06% | 41.28 | -3.36 | -3.92 |
| 24.0 | Credit Services | 84.0 | 82.0 | 76.0 | 94.0 | -0.03 | 63.71 | 136.22 | 71.39 | 9.09 | 14.4 | || | 49.0 | Food Distribution | 67.0 | 78.0 | 78.0 | 20.0 | 0.32 | 12.32 | 20.41% | 13.8 | 0.85 | 14.43 |
| 25.0 | Specialty Business Services | 83.0 | 81.0 | 80.0 | 87.0 | -0.21 | 41.73 | 56.88 | 41.83 | 8.5 | 9.82 | || | 50.0 | Medical Care Facilities | 66.0 | 68.0 | 46.0 | 19.0 | 0.24 | 10.41 | 21.63% | 26.53 | -2.76 | 7.68 |
| Pos. | | Name | | RS Today | | RS 3Wk | | RS 6Wk | | RS 26wk | | Secotr | | Industry | | Pos Ind | | EPS | | SMR | | A/C | | CR | | Ind Pos. | | Sec Pos. | | Close. | | 10wk | | 26wk | |
| 1.0 | WGS | 100.0 | 100.0 | 100.0 | 98.18 | Healthcare | Health Information Services | 56 | 97.33 | 96.88 | 88.57 | 28.11 | 1.0 | 1.0 | 69.37 | 1.0 | 1.0 |
| 2.0 | SEZL | 99.91 | 99.82 | 99.9 | 0.0 | Financial | Credit Services | 24 | 94.86 | 86.39 | 88.33 | 78.83 | 1.0 | 1.0 | 390.11 | 1.0 | 1.0 |
| 3.0 | DRUG | 99.82 | 99.91 | 7.2 | 1.26 | Healthcare | Biotechnology | 6 | 0.0 | 0.0 | 99.55 | 0.0 | 1.0 | 2.0 | 32.66 | 1.0 | 1.0 |
| 4.0 | DOGZ | 99.73 | 99.55 | 98.82 | 11.6 | Consumer Cyclical | Leisure | 11 | 45.8 | 0.28 | 88.01 | 27.09 | 1.0 | 1.0 | 45.79 | 1.0 | 1.0 |
| 5.0 | LENZ | 99.64 | 99.73 | 99.81 | 99.54 | Healthcare | Biotechnology | 6 | 23.1 | 0.0 | 89.9 | 0.0 | 2.0 | 3.0 | 33.9 | 1.0 | 1.0 |
| 6.0 | LBPH | 99.55 | 99.64 | 99.63 | 98.27 | Healthcare | Biotechnology | 6 | 0.0 | 0.0 | 95.56 | 0.0 | 3.0 | 4.0 | 59.77 | 1.0 | 1.0 |
| 7.0 | DAVE | 99.46 | 99.19 | 99.72 | 99.81 | Technology | Software - Application | 8 | 49.95 | 80.91 | 87.81 | 49.59 | 1.0 | 1.0 | 78.0 | 1.0 | 1.0 |
| 8.0 | ROOT | 99.37 | 99.28 | 99.27 | 100.0 | Financial | Insurance - Property and Casualty | 39 | 74.6 | 60.12 | 99.22 | 61.45 | 1.0 | 2.0 | 104.76 | 1.0 | 1.0 |
| 9.0 | SMR | 99.28 | 99.01 | 92.88 | 20.39 | Industrials | Specialty Industrial Machinery | 67 | 6.55 | 11.22 | 88.33 | 16.15 | 1.0 | 1.0 | 25.73 | 1.0 | 1.0 |
| 10.0 | CVNA | 99.19 | 99.46 | 99.45 | 99.9 | Consumer Cyclical | Auto and Truck Dealerships | 1 | 77.54 | 76.45 | 98.82 | 85.37 | 1.0 | 2.0 | 244.5 | 1.0 | 1.0 |
| 11.0 | CAPR | 99.01 | 99.37 | 99.54 | 73.16 | Healthcare | Biotechnology | 6 | 7.17 | 74.55 | 94.5 | 17.17 | 4.0 | 5.0 | 18.92 | 1.0 | 1.0 |
| 12.0 | EWTX | 98.74 | 98.92 | 99.18 | 90.93 | Healthcare | Biotechnology | 6 | 9.68 | 0.0 | 99.79 | 0.0 | 7.0 | 8.0 | 31.95 | 1.0 | 1.0 |
| 13.0 | RKLB | 98.65 | 95.05 | 93.96 | 28.64 | Industrials | Aerospace and Defense | 27 | 45.68 | 82.77 | 99.46 | 24.43 | 1.0 | 2.0 | 20.18 | 1.0 | 1.0 |
| 14.0 | WLFC | 98.47 | 98.74 | 98.55 | 87.76 | Industrials | Rental and Leasing Services | 16 | 98.51 | 97.52 | 89.4 | 87.42 | 1.0 | 4.0 | 193.24 | 1.0 | 1.0 |
| 15.0 | FTAI | 98.38 | 97.66 | 99.09 | 98.64 | Industrials | Rental and Leasing Services | 16 | 0.0 | 0.0 | 98.53 | 0.0 | 2.0 | 5.0 | 171.21 | 1.0 | 1.0 |
| 16.0 | CAVA | 98.29 | 98.29 | 98.64 | 0.0 | Consumer Cyclical | Restaurants | 82 | 0.0 | 98.71 | 95.56 | 0.0 | 1.0 | 3.0 | 139.69 | 1.0 | 1.0 |
| 17.0 | SG | 98.11 | 98.2 | 97.83 | 99.0 | Consumer Cyclical | Restaurants | 82 | 53.85 | 70.67 | 97.03 | 46.21 | 2.0 | 4.0 | 37.9 | 1.0 | 1.0 |
| 18.0 | ZIM | 98.02 | 97.3 | 89.73 | 78.51 | Industrials | Marine Shipping | 136 | 0.0 | 0.0 | 94.14 | 0.0 | 1.0 | 7.0 | 27.01 | 1.0 | 1.0 |
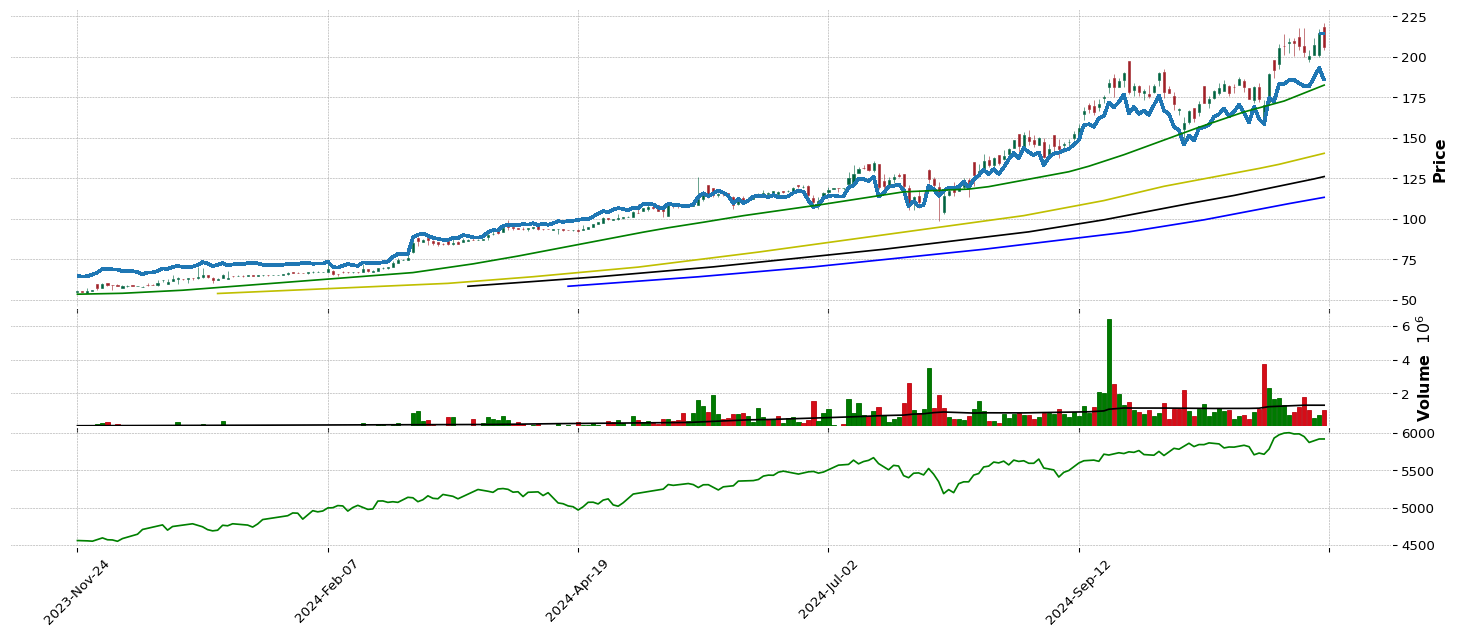
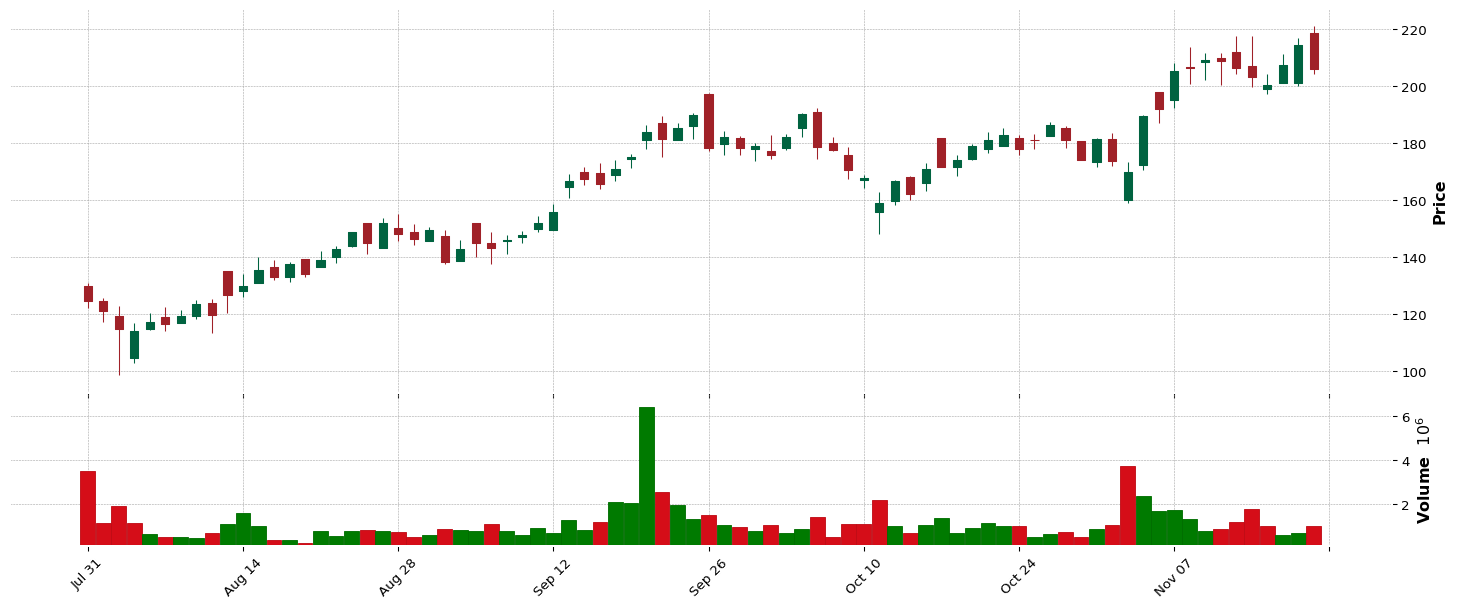
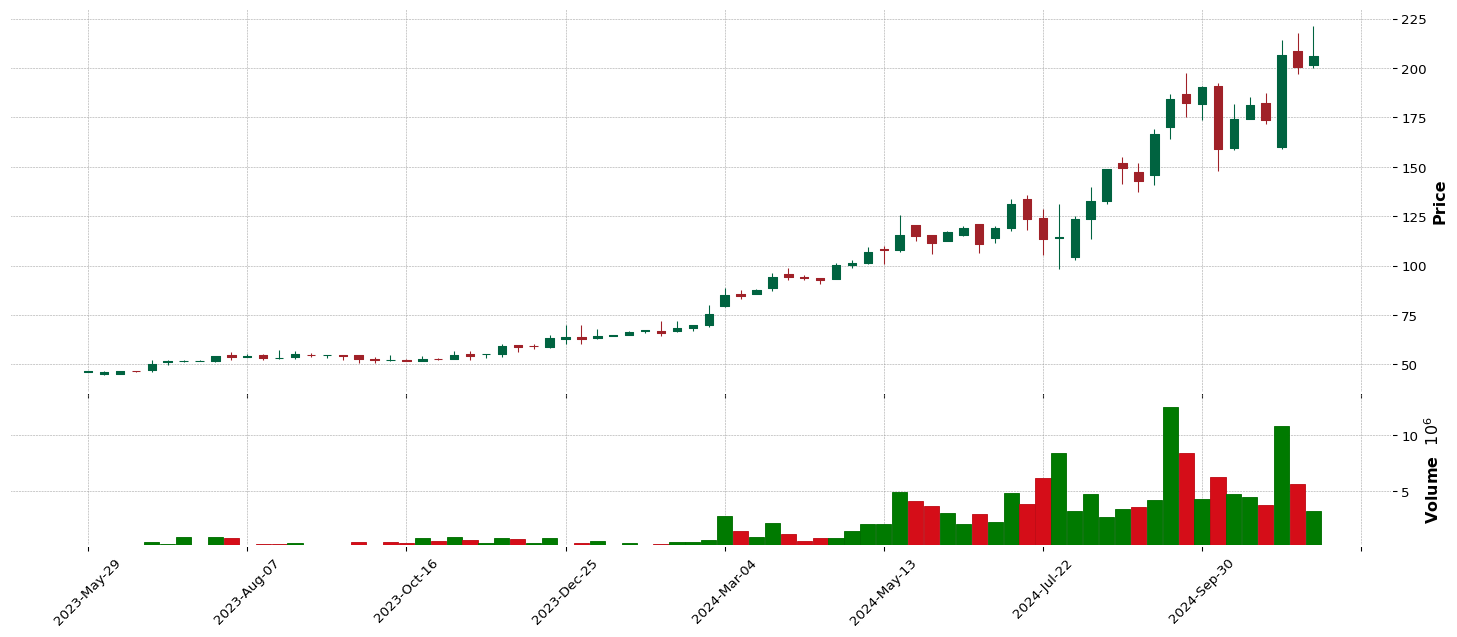
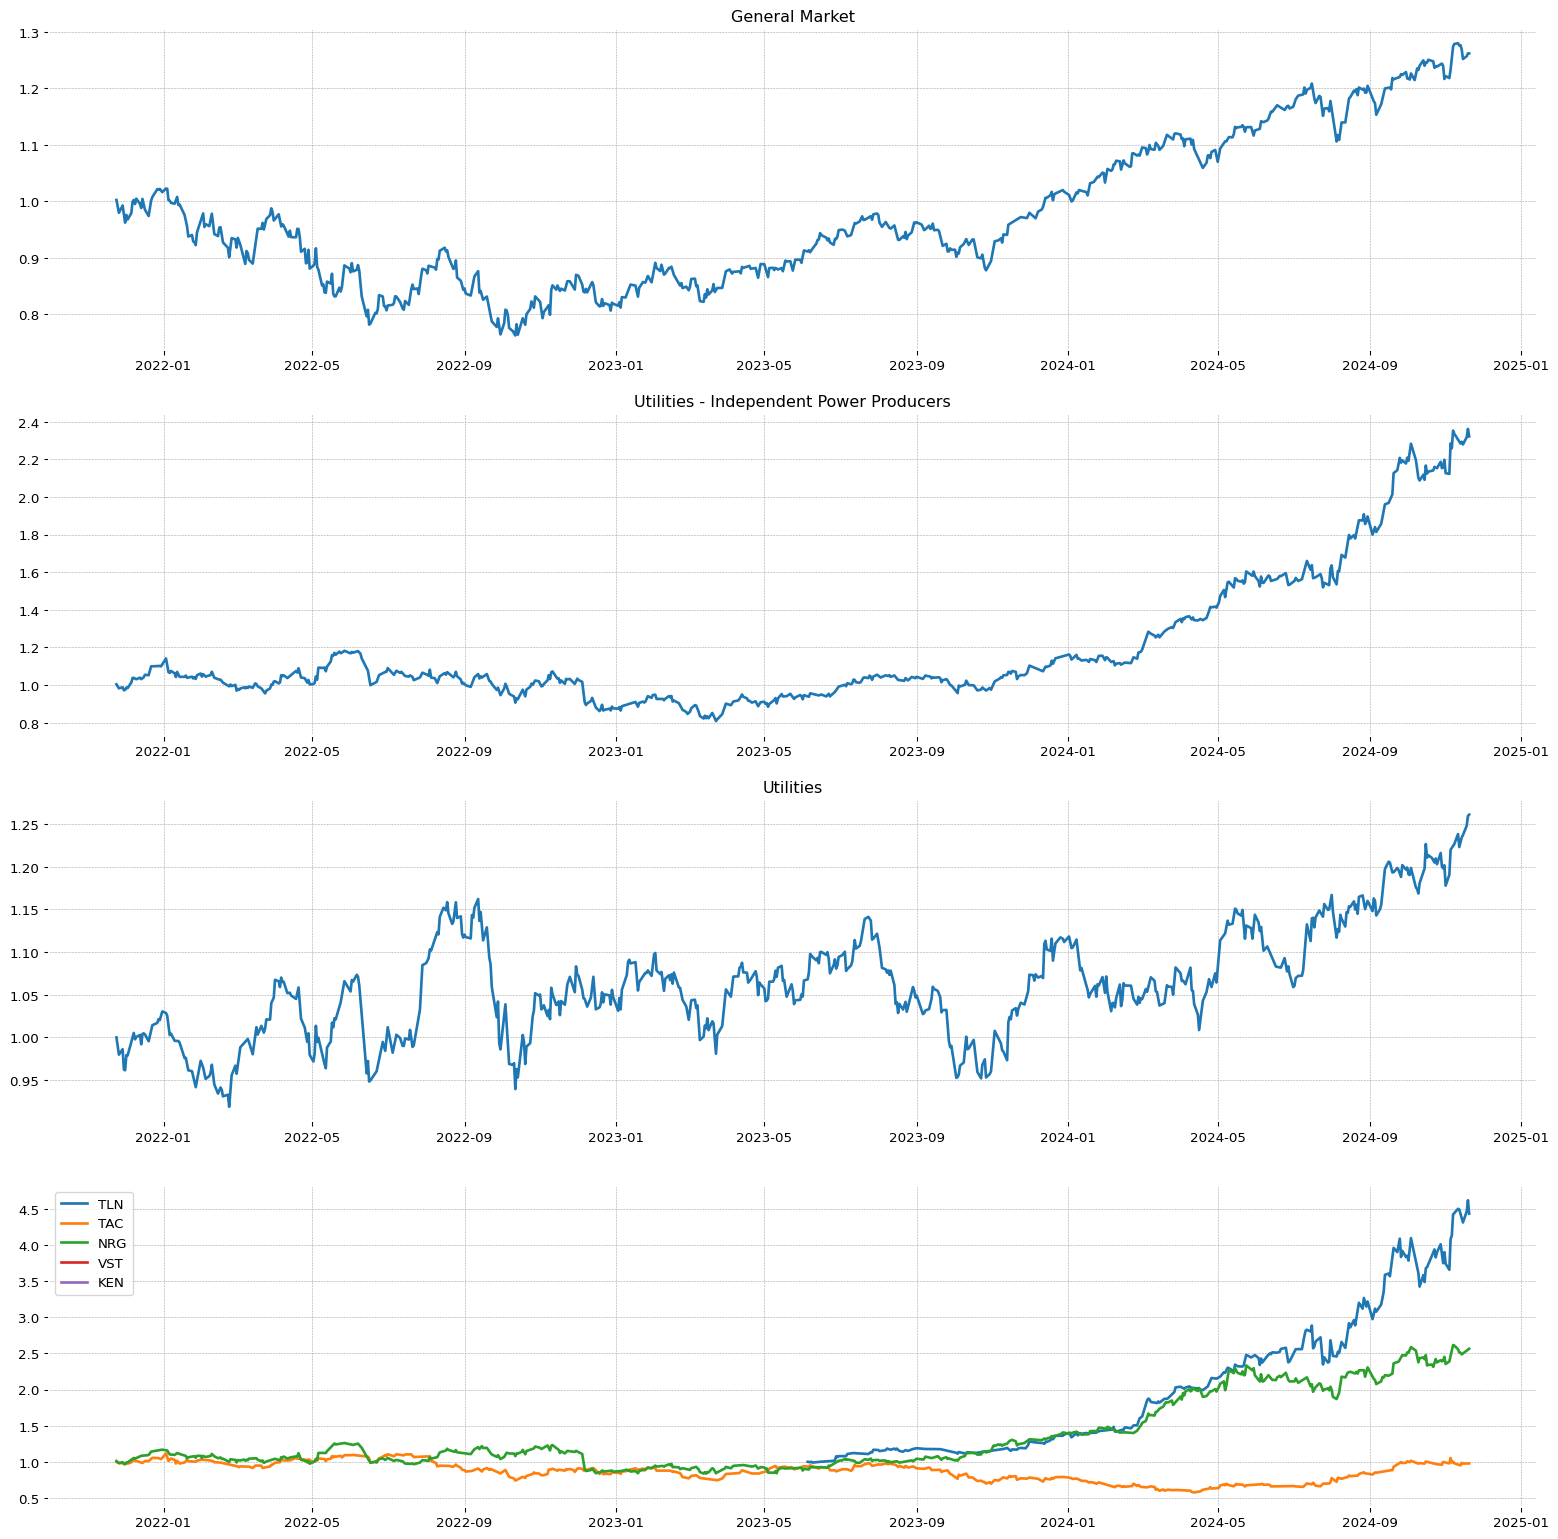
| 19.0 | TLN | 97.84 | 97.75 | 97.65 | 0.0 | Utilities | Utilities - Independent Power Producers | 109 | 24.37 | 83.06 | 90.82 | 87.21 | 1.0 | 1.0 | 206.08 | 1.0 | 1.0 |
| 20.0 | NRIX | 97.75 | 98.47 | 98.1 | 86.76 | Healthcare | Biotechnology | 6 | 8.72 | 52.87 | 84.35 | 26.78 | 8.0 | 9.0 | 22.63 | 0.0 | 1.0 |
| 21.0 | SE | 97.39 | 93.61 | 93.24 | 60.19 | Consumer Cyclical | Internet Retail | 59 | 27.03 | 36.41 | 95.56 | 75.86 | 1.0 | 5.0 | 114.45 | 1.0 | 1.0 |
| 22.0 | NVDA | 97.3 | 97.21 | 97.38 | 98.0 | Technology | Semiconductors | 108 | 98.76 | 99.9 | 46.17 | 84.96 | 1.0 | 4.0 | 145.88 | 1.0 | 1.0 |
| 23.0 | POWL | 97.21 | 97.39 | 97.47 | 98.82 | Industrials | Electrical Equipment and Parts | 53 | 99.35 | 100.0 | 89.9 | 93.76 | 1.0 | 8.0 | 261.82 | 1.0 | 1.0 |
| 24.0 | TVTX | 97.03 | 96.22 | 95.49 | 1.45 | Healthcare | Biotechnology | 6 | 27.55 | 13.92 | 84.75 | 21.67 | 9.0 | 12.0 | 17.86 | 1.0 | 1.0 |
| 25.0 | INSM | 96.94 | 96.67 | 97.29 | 66.99 | Healthcare | Biotechnology | 6 | 11.5 | 84.98 | 83.92 | 66.87 | 10.0 | 13.0 | 72.66 | 1.0 | 1.0 |
| 26.0 | UI | 96.85 | 96.04 | 91.53 | 22.03 | Technology | Communication Equipment | 15 | 10.67 | 8.82 | 97.28 | 93.66 | 1.0 | 5.0 | 340.98 | 1.0 | 1.0 |
| 27.0 | STRL | 96.76 | 92.44 | 93.6 | 97.91 | Industrials | Engineering and Construction | 122 | 93.38 | 87.13 | 46.17 | 88.75 | 1.0 | 10.0 | 189.42 | 1.0 | 1.0 |
| 28.0 | CMPO | 96.67 | 96.13 | 94.41 | 25.2 | Industrials | Metal Fabrication | 34 | 48.65 | 26.72 | 93.64 | 20.65 | 1.0 | 11.0 | 15.39 | 1.0 | 1.0 |
| 29.0 | CLMB | 96.22 | 95.23 | 95.04 | 40.88 | Technology | Electronics and Computer Distribution | 40 | 86.79 | 73.14 | 98.35 | 83.74 | 1.0 | 6.0 | 134.17 | 1.0 | 1.0 |
| 30.0 | VRNA | 96.13 | 94.42 | 94.77 | 5.07 | Healthcare | Biotechnology | 6 | 21.06 | 0.0 | 94.14 | 0.0 | 15.0 | 18.0 | 38.84 | 1.0 | 1.0 |
| Pos. | | Name | | RS Today | | RS 3Wk | | RS 6Wk | | RS 26wk | | Secotr | | Industry | | Pos Ind | | EPS | | SMR | | A/C | | CR | | Ind Pos. | | Sec Pos. | | Close. | | 10wk | | 26wk | |
| 1.0 | SEZL | 99.91 | 99.82 | 99.9 | 0.0 | Financial | Credit Services | 24.0 | 94.86 | 86.39 | 88.33 | 78.83 | 1.0 | 1.0 | 390.11 | 1.0 | 1.0 |
| 2.0 | FIX | 94.87 | 93.25 | 96.3 | 96.91 | Industrials | Engineering and Construction | 122.0 | 90.87 | 92.65 | 98.02 | 98.46 | 4.0 | 15.0 | 476.25 | 1.0 | 1.0 |
| 3.0 | NTAP | 79.78 | 79.67 | 84.51 | 89.12 | Technology | Computer Hardware | 13.0 | 74.38 | 75.39 | 89.9 | 86.29 | 5.0 | 38.0 | 123.44 | 1.0 | 1.0 |
| 4.0 | ODFL | 34.14 | 29.49 | 22.5 | 47.14 | Industrials | Trucking | 135.0 | 43.82 | 47.38 | 82.23 | 94.27 | 2.0 | 91.0 | 214.33 | 1.0 | 1.0 |
| Pos. | | Name | | RS Today | | RS 3Wk | | RS 6Wk | | RS 26wk | | Secotr | | Industry | | Pos Ind | | EPS | | SMR | | A/C | | CR | | Ind Pos. | | Sec Pos. | | Close. | | 10wk | | 26wk | |
| 1.0 | INSM | 96.94 | 96.67 | 97.29 | 66.99 | Healthcare | Biotechnology | 6 | 11.5 | 84.98 | 83.92 | 66.87 | 10.0 | 13.0 | 72.66 | 1.0 | 1.0 |
| 2.0 | REVG | 90.74 | 87.85 | 86.13 | 97.55 | Industrials | Farm and Heavy Construction Machinery | 46 | 92.45 | 86.1 | 3.39 | 46.62 | 2.0 | 21.0 | 29.2 | 1.0 | 1.0 |
| 3.0 | SMC | 89.66 | 87.76 | 90.45 | 96.19 | Energy | Oil and Gas Midstream | 52 | 19.48 | 0.0 | 86.52 | 0.0 | 2.0 | 6.0 | 36.0 | 1.0 | 1.0 |
| 4.0 | UFPT | 86.61 | 90.1 | 91.17 | 88.12 | Healthcare | Medical Devices | 17 | 83.48 | 65.22 | 8.13 | 95.7 | 4.0 | 37.0 | 298.79 | 0.0 | 1.0 |
| 5.0 | COKE | 85.71 | 86.96 | 91.98 | 81.5 | Consumer Defensive | Beverages - Non-Alcoholic | 55 | 82.89 | 54.25 | 84.75 | 99.89 | 1.0 | 5.0 | 1237.95 | 0.0 | 1.0 |
| Pos. | | Name | | RS Today | | RS 3Wk | | RS 6Wk | | RS 26wk | | Secotr | | Industry | | Pos Ind | | EPS | | SMR | | A/C | | CR | | Ind Pos. | | Sec Pos. | | Close. | | 10wk | | 26wk | |
| 1.0 | MAIN | 60.64 | 59.17 | 59.22 | 61.37 | Financial | Asset Management | 83 | 81.9 | 58.32 | 7.14 | 65.74 | 7.0 | 120.0 | 53.08 | 1.0 | 1.0 |
| 2.0 | PBA | 60.28 | 64.11 | 69.03 | 58.38 | Energy | Oil and Gas Midstream | 52 | 92.14 | 59.48 | 95.56 | 65.13 | 8.0 | 20.0 | 42.47 | 1.0 | 1.0 |
| 3.0 | WM | 59.83 | 61.87 | 63.54 | 69.8 | Industrials | Waste Management | 131 | 69.56 | 45.13 | 83.92 | 94.78 | 3.0 | 62.0 | 218.77 | 1.0 | 1.0 |
| 4.0 | EOS | 59.02 | 57.37 | 60.39 | 64.82 | Financial | Closed-End Fund - Equity | 98 | 64.67 | 65.73 | 92.14 | 46.42 | 3.0 | 127.0 | 23.07 | 1.0 | 1.0 |
| 5.0 | DCI | 57.05 | 54.94 | 49.59 | 54.75 | Industrials | Specialty Industrial Machinery | 67 | 67.24 | 74.04 | 81.22 | 76.89 | 8.0 | 64.0 | 75.16 | 1.0 | 1.0 |
| 6.0 | MA | 56.96 | 63.03 | 55.71 | 61.28 | Financial | Credit Services | 24 | 77.6 | 82.64 | 46.17 | 99.28 | 8.0 | 134.0 | 512.53 | 1.0 | 1.0 |
| 7.0 | PSO | 55.25 | 55.66 | 50.94 | 62.19 | Communication Services | Publishing | 77 | 0.0 | 0.0 | 87.41 | 0.0 | 3.0 | 19.0 | 15.03 | 1.0 | 1.0 |
| 8.0 | BSTZ | 55.07 | 59.98 | 52.2 | 43.69 | Financial | Closed-End Fund - Equity | 98 | 24.18 | 42.57 | 83.92 | 38.34 | 4.0 | 137.0 | 20.79 | 1.0 | 1.0 |
| 9.0 | EVT | 53.45 | 48.29 | 48.69 | 46.69 | Financial | Closed-End Fund - Equity | 98 | 97.64 | 56.49 | 10.84 | 45.6 | 7.0 | 146.0 | 25.0 | 1.0 | 1.0 |
| 10.0 | WEYS | 53.36 | 56.11 | 55.62 | 47.77 | Consumer Cyclical | Footwear and Accessories | 69 | 81.75 | 47.6 | 8.68 | 52.45 | 2.0 | 49.0 | 35.27 | 1.0 | 1.0 |
| 11.0 | UBS | 52.92 | 57.64 | 60.93 | 85.49 | Financial | Banks - Diversified | 100 | 67.64 | 79.43 | 46.17 | 53.98 | 1.0 | 150.0 | 31.82 | 1.0 | 1.0 |
| 12.0 | ESGR | 52.83 | 60.34 | 65.43 | 64.55 | Financial | Insurance - Diversified | 78 | 28.39 | 83.95 | 97.76 | 97.54 | 2.0 | 151.0 | 323.82 | 1.0 | 1.0 |
| 13.0 | STEW | 52.29 | 47.3 | 50.04 | 55.93 | Financial | Closed-End Fund - Equity | 98 | 0.0 | 0.0 | 7.37 | 0.0 | 9.0 | 153.0 | 16.11 | 1.0 | 1.0 |
| 14.0 | CSCO | 50.76 | 30.66 | 25.11 | 27.01 | Technology | Communication Equipment | 15 | 8.5 | 25.05 | 92.6 | 66.66 | 7.0 | 77.0 | 57.5 | 1.0 | 1.0 |
| 15.0 | RVT | 50.67 | 49.82 | 54.18 | 56.11 | Financial | Closed-End Fund - Equity | 98 | 0.0 | 0.0 | 90.82 | 0.0 | 11.0 | 156.0 | 15.93 | 1.0 | 1.0 |
| 16.0 | BGH | 50.58 | 51.97 | 54.09 | 51.76 | Financial | Closed-End Fund - Debt | 54 | 41.91 | 87.29 | 92.14 | 33.94 | 7.0 | 157.0 | 15.43 | 1.0 | 1.0 |
| 17.0 | UTL | 50.13 | 53.95 | 56.52 | 30.46 | Utilities | Utilities - Diversified | 64 | 43.61 | 41.64 | 5.51 | 64.21 | 1.0 | 17.0 | 59.27 | 1.0 | 1.0 |
| 18.0 | EDR | 50.04 | 55.21 | 81.63 | 58.83 | Communication Services | Entertainment | 43 | 0.0 | 0.0 | 46.17 | 0.0 | 5.0 | 21.0 | 29.38 | 1.0 | 1.0 |
| 19.0 | PAXS | 47.7 | 41.18 | 57.24 | 52.94 | Financial | Closed-End Fund - Debt | 54 | 0.0 | 0.0 | 46.17 | 0.0 | 8.0 | 163.0 | 16.48 | 1.0 | 1.0 |
| 20.0 | ALEX | 47.52 | 39.65 | 42.03 | 23.75 | Real Estate | REIT - Retail | 31 | 55.15 | 80.07 | 46.17 | 38.75 | 6.0 | 19.0 | 19.48 | 1.0 | 1.0 |
| 21.0 | AY | 47.43 | 43.52 | 53.91 | 26.11 | Utilities | Utilities - Renewable | 121 | 61.11 | 60.73 | 99.64 | 46.01 | 2.0 | 18.0 | 22.14 | 1.0 | 1.0 |
| 22.0 | CWBC | 47.16 | 41.81 | 41.67 | 60.83 | Financial | Banks - Regional | 36 | 48.25 | 60.41 | 98.82 | 42.43 | 87.0 | 165.0 | 20.77 | 1.0 | 1.0 |
| 23.0 | CBOE | 46.27 | 58.72 | 58.23 | 73.7 | Financial | Financial Data and Stock Exchanges | 71 | 46.82 | 73.53 | 6.69 | 91.82 | 3.0 | 168.0 | 208.5 | 1.0 | 1.0 |
| 24.0 | NIE | 45.28 | 44.15 | 41.94 | 50.31 | Financial | Closed-End Fund - Equity | 98 | 68.82 | 0.0 | 99.14 | 0.0 | 14.0 | 174.0 | 23.87 | 1.0 | 1.0 |
| 25.0 | FAF | 44.65 | 45.41 | 49.14 | 31.36 | Financial | Insurance - Specialty | 80 | 14.07 | 42.02 | 1.25 | 63.59 | 8.0 | 177.0 | 66.41 | 1.0 | 1.0 |
| 26.0 | CNP | 43.12 | 35.79 | 32.49 | 39.98 | Utilities | Utilities - Regulated Electric | 94 | 92.36 | 35.93 | 84.75 | 55.31 | 12.0 | 21.0 | 31.56 | 1.0 | 1.0 |
| 27.0 | PG | 42.76 | 37.85 | 44.55 | 53.94 | Consumer Defensive | Household and Personal Products | 57 | 0.0 | 0.0 | 95.56 | 0.0 | 6.0 | 24.0 | 170.88 | 1.0 | 1.0 |
| 28.0 | SR | 42.58 | 35.34 | 36.81 | 25.11 | Utilities | Utilities - Regulated Gas | 118 | 77.72 | 47.89 | 87.41 | 75.25 | 2.0 | 22.0 | 68.38 | 1.0 | 1.0 |
| 29.0 | DIAX | 39.98 | 36.24 | 38.07 | 32.0 | Financial | Closed-End Fund - Equity | 98 | 94.55 | 78.34 | 88.85 | 35.88 | 17.0 | 191.0 | 15.22 | 1.0 | 1.0 |
| 30.0 | DGICA | 39.44 | 31.47 | 28.17 | 22.57 | Financial | Insurance - Property and Casualty | 39 | 54.12 | 77.18 | 46.17 | 32.0 | 9.0 | 193.0 | 15.89 | 1.0 | 1.0 |
| 31.0 | ARCC | 37.73 | 35.43 | 37.26 | 51.67 | Financial | Asset Management | 83 | 80.97 | 88.57 | 87.41 | 47.34 | 12.0 | 202.0 | 21.79 | 1.0 | 1.0 |
| 32.0 | AC | 36.92 | 32.28 | 32.13 | 19.03 | Financial | Asset Management | 83 | 55.49 | 90.05 | 92.14 | 61.86 | 13.0 | 207.0 | 36.33 | 1.0 | 1.0 |
| 33.0 | FMS | 36.65 | 40.82 | 43.38 | 28.83 | Healthcare | Medical Care Facilities | 50 | 9.89 | 32.94 | 46.17 | 33.74 | 3.0 | 88.0 | 21.79 | 1.0 | 1.0 |
| 34.0 | FSK | 35.84 | 29.22 | 29.52 | 40.25 | Financial | Asset Management | 83 | 64.27 | 49.43 | 89.9 | 44.17 | 14.0 | 211.0 | 21.48 | 1.0 | 1.0 |
| 35.0 | EQC | 34.05 | 30.03 | 32.76 | 26.38 | Real Estate | REIT - Office | 48 | 92.32 | 53.03 | 88.57 | 44.06 | 5.0 | 28.0 | 20.12 | 1.0 | 1.0 |
| 36.0 | SPLP | 32.97 | 24.28 | 21.06 | 24.11 | Industrials | Conglomerates | 62 | 90.13 | 40.42 | 97.28 | 64.11 | 2.0 | 92.0 | 40.52 | 1.0 | 1.0 |
| 37.0 | PAG | 29.11 | 23.38 | 30.33 | 44.6 | Consumer Cyclical | Auto and Truck Dealerships | 1 | 43.98 | 14.11 | 7.14 | 83.94 | 4.0 | 72.0 | 157.22 | 1.0 | 1.0 |
| 38.0 | CQP | 20.3 | 17.62 | 19.62 | 48.59 | Energy | Oil and Gas Midstream | 52 | 0.0 | 0.0 | 85.32 | 0.0 | 12.0 | 44.0 | 53.29 | 1.0 | 1.0 |
| 39.0 | WINA | 20.03 | 17.98 | 19.08 | 42.52 | Consumer Cyclical | Specialty Retail | 75 | 35.16 | 51.39 | 92.14 | 98.56 | 5.0 | 82.0 | 395.42 | 1.0 | 1.0 |
| 40.0 | YY | 17.43 | 13.75 | 15.84 | 55.12 | Communication Services | Internet Content and Information | 91 | 28.2 | 32.69 | 85.32 | 57.05 | 11.0 | 36.0 | 36.11 | 1.0 | 1.0 |
| Pos. | | Name | | RS Today | | RS 3Wk | | RS 6Wk | | RS 26wk | | Secotr | | Industry | | Pos Ind | | EPS | | SMR | | A/C | | CR | | Ind Pos. | | Sec Pos. | | Close. | | 10wk | | 26wk | |
| 1.0 | LBPH | 99.55 | 99.64 | 99.63 | 98.27 | Healthcare | Biotechnology | 6 | 0.0 | 0.0 | 95.56 | 0.0 | 3.0 | 4.0 | 59.77 | 1.0 | 1.0 |
| 2.0 | ROOT | 99.37 | 99.28 | 99.27 | 100.0 | Financial | Insurance - Property & Casualty | 39 | 74.6 | 60.12 | 99.22 | 61.45 | 1.0 | 2.0 | 104.76 | 1.0 | 1.0 |
| 3.0 | SMR | 99.28 | 99.01 | 92.88 | 20.39 | Industrials | Specialty Industrial Machinery | 67 | 6.55 | 11.22 | 88.33 | 16.15 | 1.0 | 1.0 | 25.73 | 1.0 | 1.0 |
| 4.0 | RKLB | 98.65 | 95.05 | 93.96 | 28.64 | Industrials | Aerospace & Defense | 27 | 45.68 | 82.77 | 99.46 | 24.43 | 1.0 | 2.0 | 20.18 | 1.0 | 1.0 |
| 5.0 | FTAI | 98.38 | 97.66 | 99.09 | 98.64 | Industrials | Rental & Leasing Services | 16 | 0.0 | 0.0 | 98.53 | 0.0 | 2.0 | 5.0 | 171.21 | 1.0 | 1.0 |
| 6.0 | ZIM | 98.02 | 97.3 | 89.73 | 78.51 | Industrials | Marine Shipping | 136 | 0.0 | 0.0 | 94.14 | 0.0 | 1.0 | 7.0 | 27.01 | 1.0 | 1.0 |
| 7.0 | TLN | 97.84 | 97.75 | 97.65 | 0.0 | Utilities | Utilities - Independent Power Producers | 109 | 24.37 | 83.06 | 90.82 | 87.21 | 1.0 | 1.0 | 206.08 | 1.0 | 1.0 |
| 8.0 | SE | 97.39 | 93.61 | 93.24 | 60.19 | Consumer Cyclical | Internet Retail | 59 | 27.03 | 36.41 | 95.56 | 75.86 | 1.0 | 5.0 | 114.45 | 1.0 | 1.0 |
| 9.0 | CLMB | 96.22 | 95.23 | 95.04 | 40.88 | Technology | Electronics & Computer Distribution | 40 | 86.79 | 73.14 | 98.35 | 83.74 | 1.0 | 6.0 | 134.17 | 1.0 | 1.0 |
| 10.0 | SPOT | 95.59 | 94.51 | 95.67 | 95.19 | Communication Services | Internet Content & Information | 91 | 56.41 | 90.95 | 97.76 | 98.05 | 1.0 | 1.0 | 470.01 | 1.0 | 1.0 |
| 11.0 | TRAK | 95.23 | 91.18 | 92.97 | 96.64 | Technology | Software - Application | 8 | 61.98 | 63.42 | 99.14 | 38.13 | 3.0 | 7.0 | 23.76 | 1.0 | 1.0 |
| 12.0 | AFRM | 95.05 | 91.36 | 94.68 | 96.01 | Technology | Software - Infrastructure | 33 | 66.16 | 98.62 | 96.42 | 68.4 | 1.0 | 8.0 | 63.18 | 1.0 | 1.0 |
| 13.0 | FIX | 94.87 | 93.25 | 96.3 | 96.91 | Industrials | Engineering & Construction | 122 | 90.87 | 92.65 | 98.02 | 98.46 | 4.0 | 15.0 | 476.25 | 1.0 | 1.0 |
| 14.0 | LMB | 94.78 | 96.31 | 96.93 | 97.73 | Industrials | Building Products & Equipment | 110 | 81.87 | 88.48 | 85.9 | 77.3 | 1.0 | 16.0 | 96.87 | 1.0 | 1.0 |
| 15.0 | IONQ | 94.51 | 63.93 | 7.29 | 18.4 | Technology | Computer Hardware | 13 | 9.09 | 31.37 | 91.37 | 39.57 | 2.0 | 10.0 | 28.86 | 1.0 | 1.0 |
| 16.0 | TRGP | 94.24 | 90.64 | 89.1 | 89.21 | Energy | Oil & Gas Midstream | 52 | 62.54 | 17.16 | 99.7 | 89.97 | 1.0 | 1.0 | 202.83 | 1.0 | 1.0 |
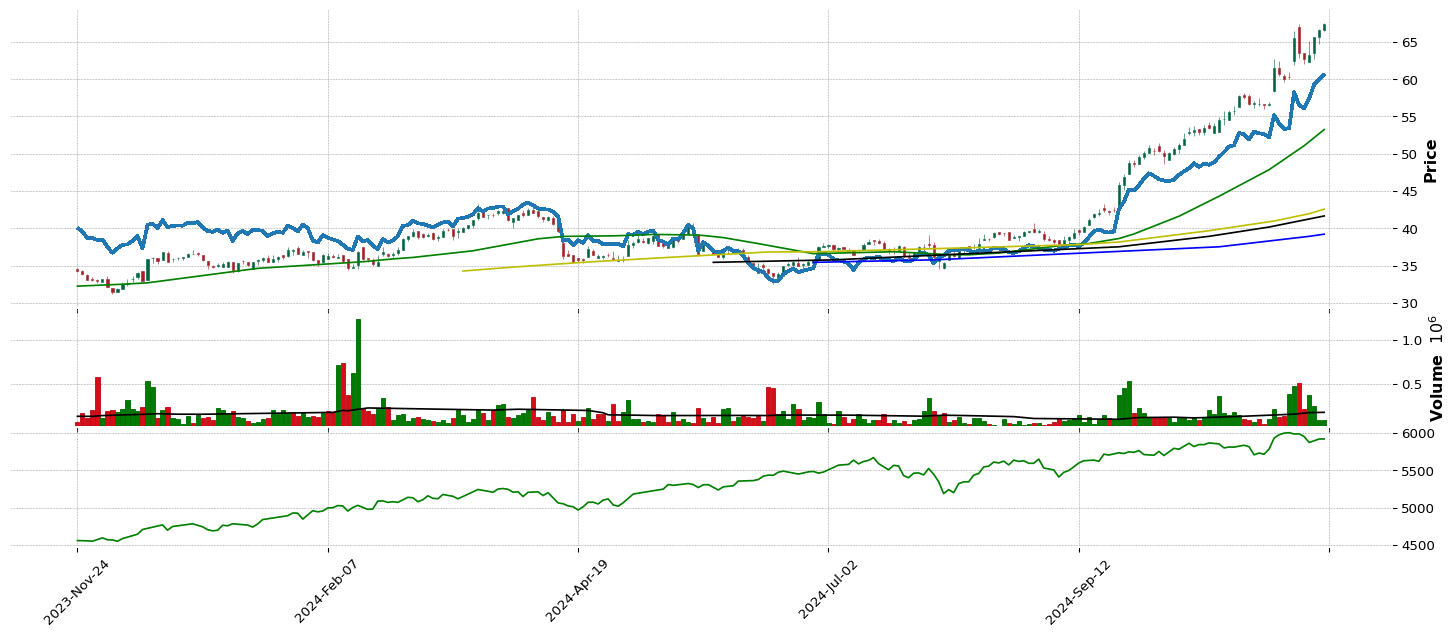
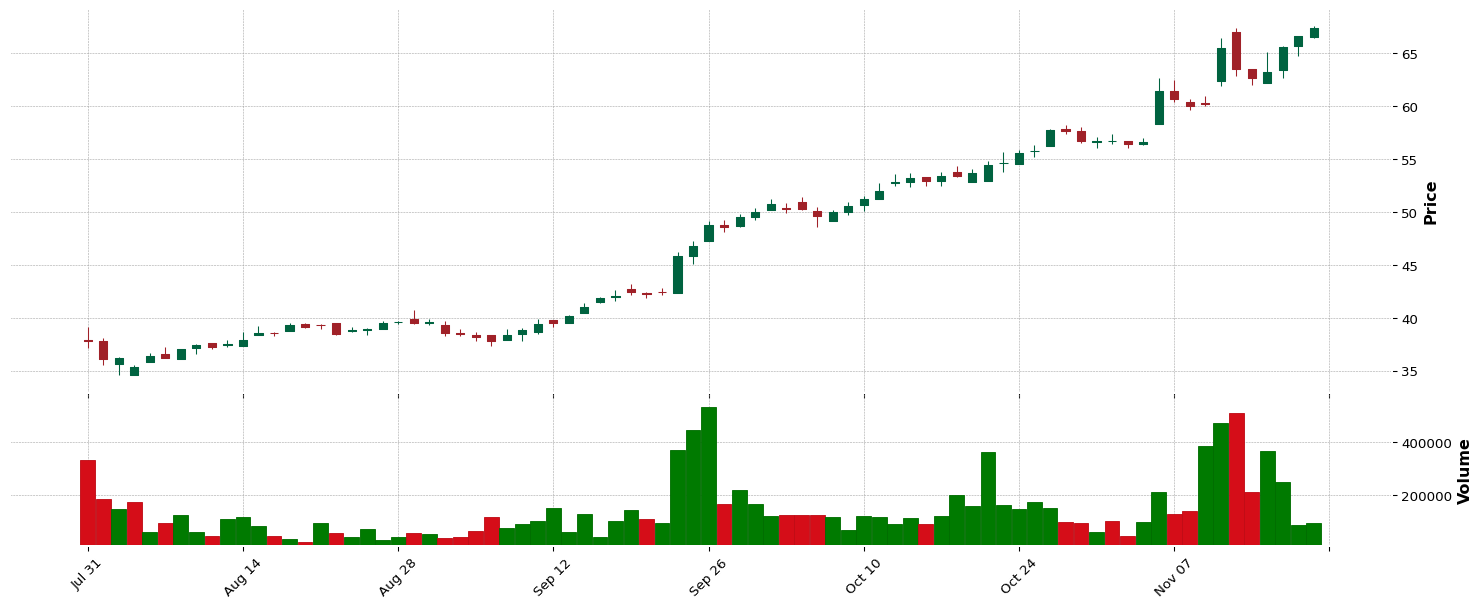
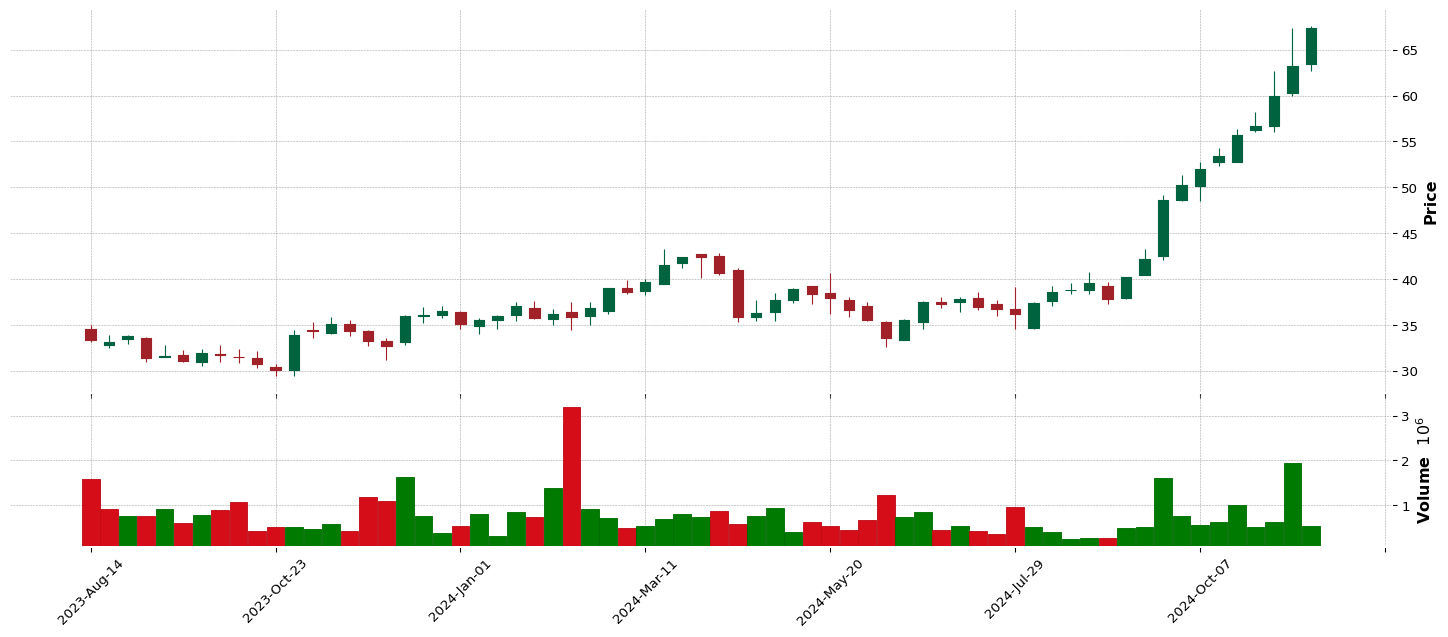
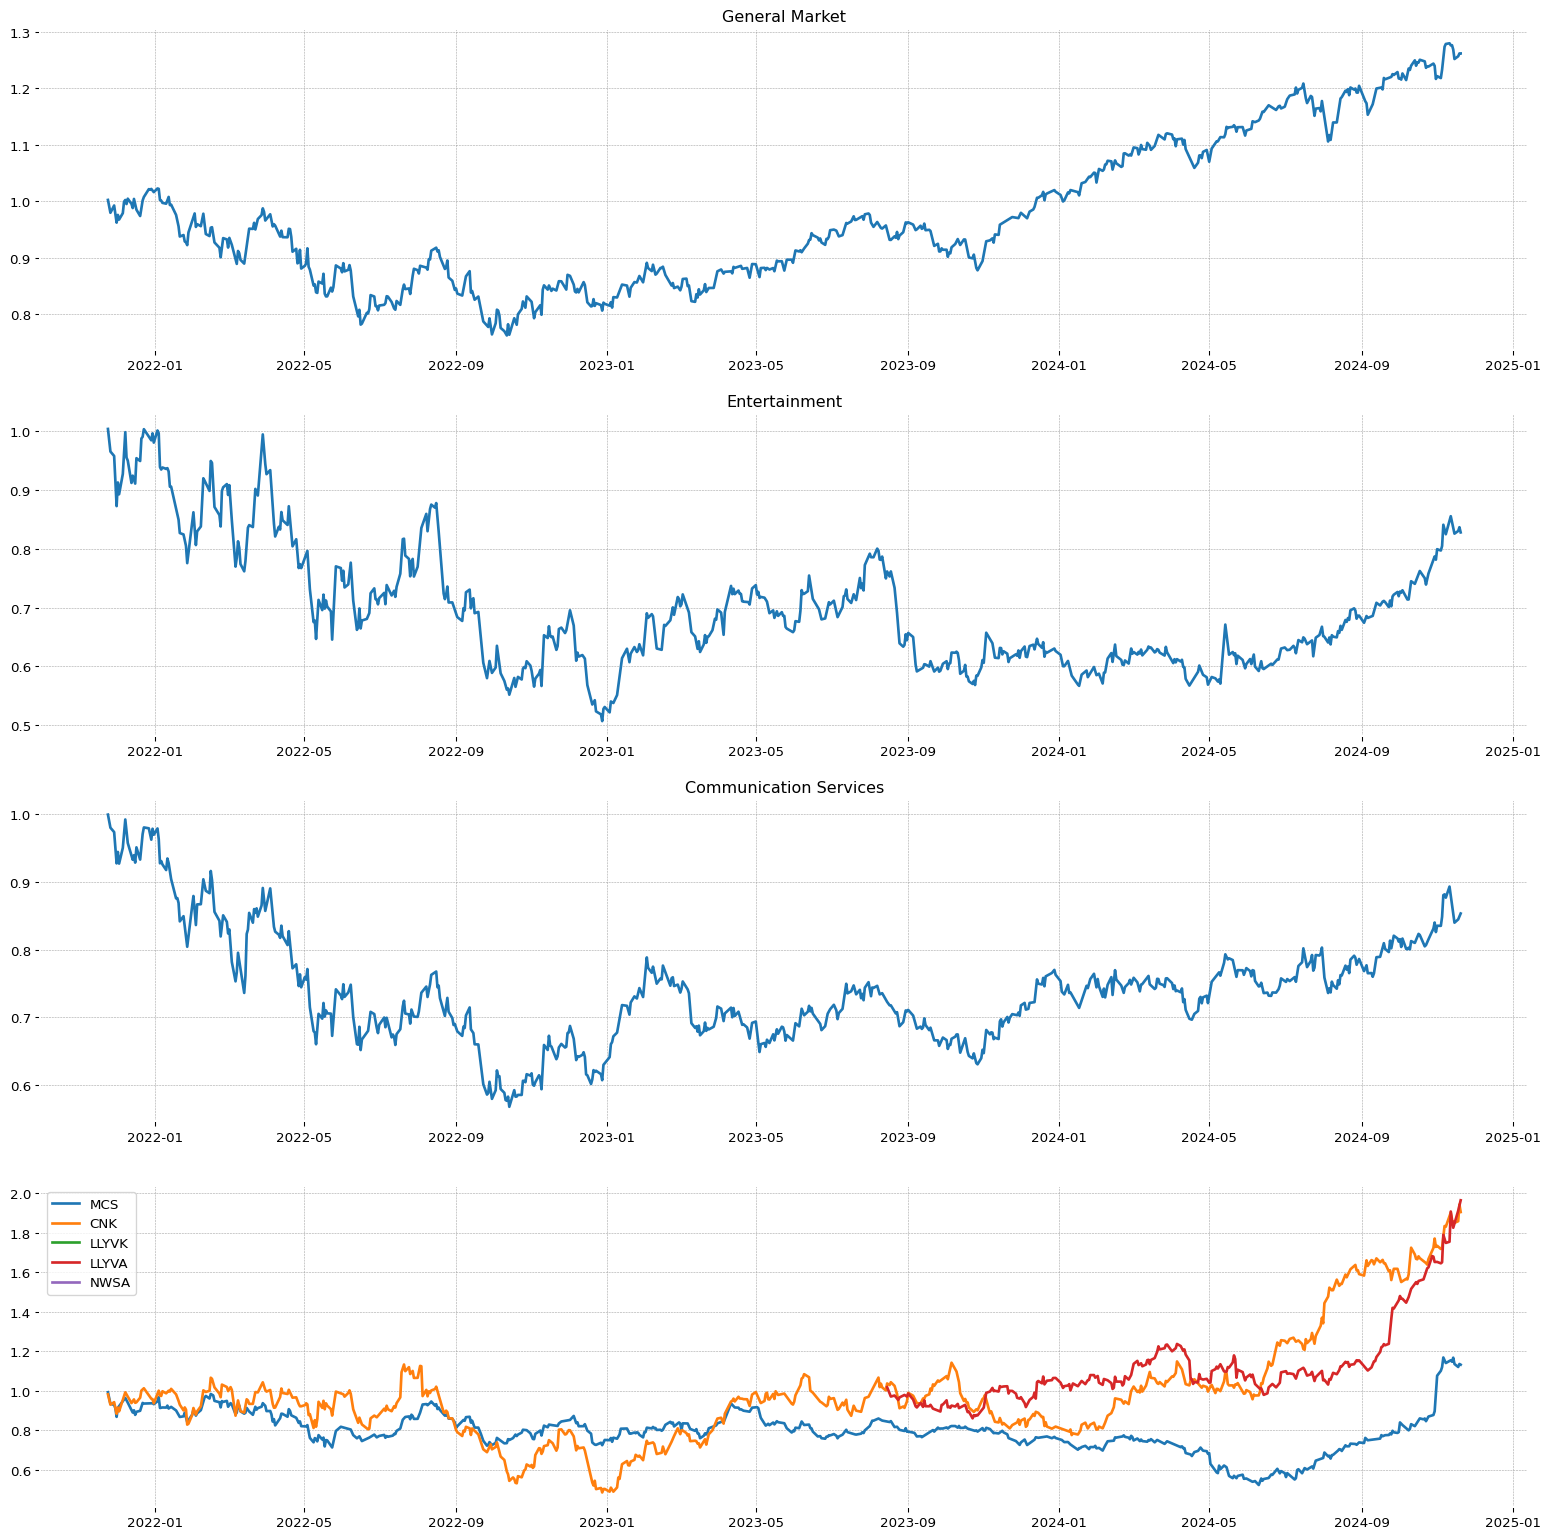
| 17.0 | CNK | 94.15 | 89.02 | 85.05 | 45.05 | Communication Services | Entertainment | 43 | 90.47 | 42.38 | 10.47 | 45.19 | 1.0 | 3.0 | 32.79 | 1.0 | 1.0 |
| 18.0 | IBKR | 94.07 | 91.0 | 86.67 | 87.85 | Financial | Capital Markets | 18 | 84.16 | 78.66 | 99.28 | 90.69 | 1.0 | 4.0 | 187.86 | 1.0 | 1.0 |
| 19.0 | QFIN | 93.62 | 92.98 | 90.9 | 82.13 | Financial | Credit Services | 24 | 22.45 | 36.99 | 92.14 | 48.97 | 2.0 | 5.0 | 35.25 | 1.0 | 1.0 |
| 20.0 | BLTE | 93.53 | 86.6 | 86.4 | 94.83 | Healthcare | Biotechnology | 6 | 8.56 | 0.0 | 96.71 | 0.0 | 20.0 | 23.0 | 82.52 | 1.0 | 1.0 |
| 21.0 | DESP | 93.44 | 92.35 | 89.91 | 96.73 | Consumer Cyclical | Travel Services | 28 | 89.14 | 72.66 | 88.85 | 32.31 | 2.0 | 10.0 | 17.7 | 1.0 | 1.0 |
| 22.0 | KGS | 92.72 | 89.11 | 87.48 | 0.0 | Energy | Oil & Gas Equipment & Services | 79 | 50.44 | 19.08 | 99.98 | 52.24 | 1.0 | 2.0 | 39.09 | 1.0 | 1.0 |
| 23.0 | TGS | 92.45 | 93.79 | 87.03 | 82.23 | Energy | Oil & Gas Integrated | 112 | 100.0 | 84.08 | 91.21 | 48.46 | 1.0 | 3.0 | 28.82 | 1.0 | 1.0 |
| 24.0 | NGVC | 92.09 | 93.34 | 91.26 | 92.38 | Consumer Defensive | Grocery Stores | 97 | 56.51 | 65.03 | 94.5 | 51.63 | 1.0 | 2.0 | 34.77 | 1.0 | 1.0 |
| 25.0 | GWRE | 92.0 | 92.53 | 92.43 | 84.31 | Technology | Software - Application | 8 | 83.08 | 95.25 | 98.47 | 92.53 | 8.0 | 17.0 | 197.22 | 1.0 | 1.0 |
| 26.0 | PAR | 91.28 | 88.84 | 77.31 | 75.43 | Technology | Software - Application | 8 | 0.0 | 0.0 | 83.92 | 0.0 | 9.0 | 18.0 | 76.05 | 1.0 | 1.0 |
| 27.0 | LLYVA | 90.92 | 85.52 | 83.16 | 0.0 | Communication Services | Entertainment | 43 | 0.0 | 0.0 | 99.49 | 0.0 | 2.0 | 5.0 | 67.41 | 1.0 | 1.0 |
| 28.0 | ZG | 90.65 | 82.28 | 70.65 | 22.66 | Communication Services | Internet Content & Information | 91 | 10.03 | 26.35 | 92.6 | 69.42 | 3.0 | 6.0 | 75.0 | 1.0 | 1.0 |
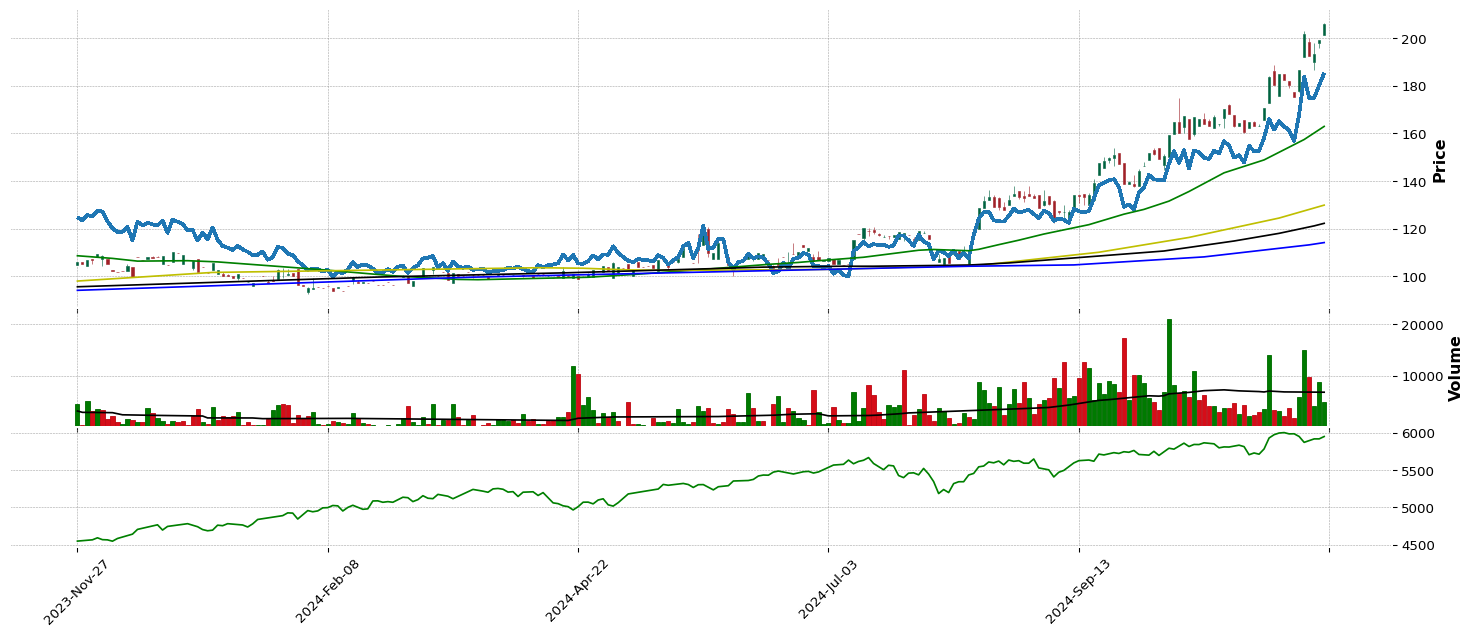
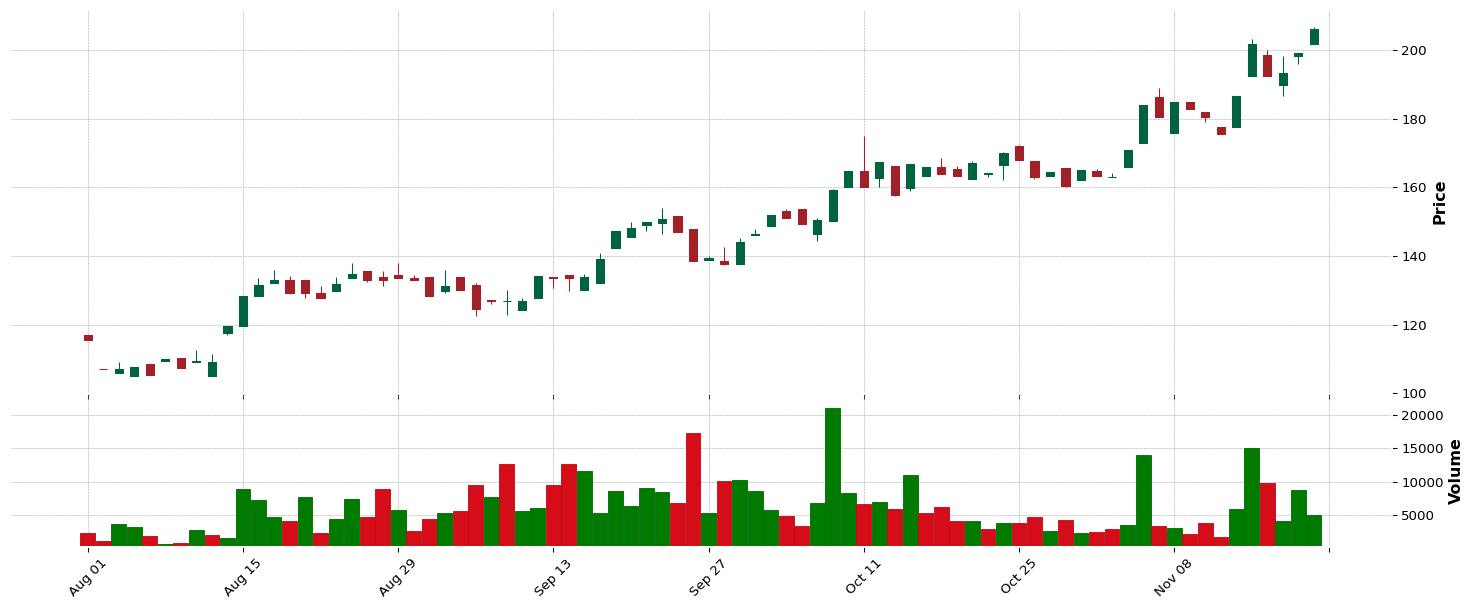
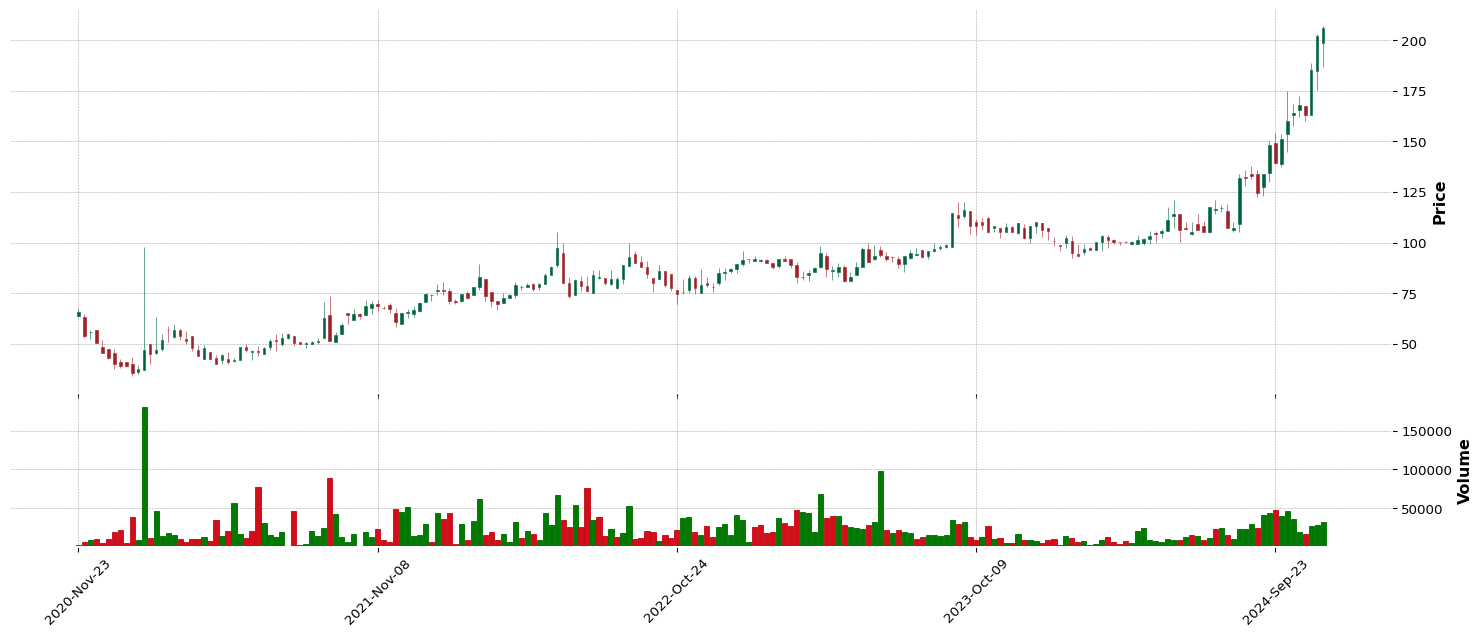
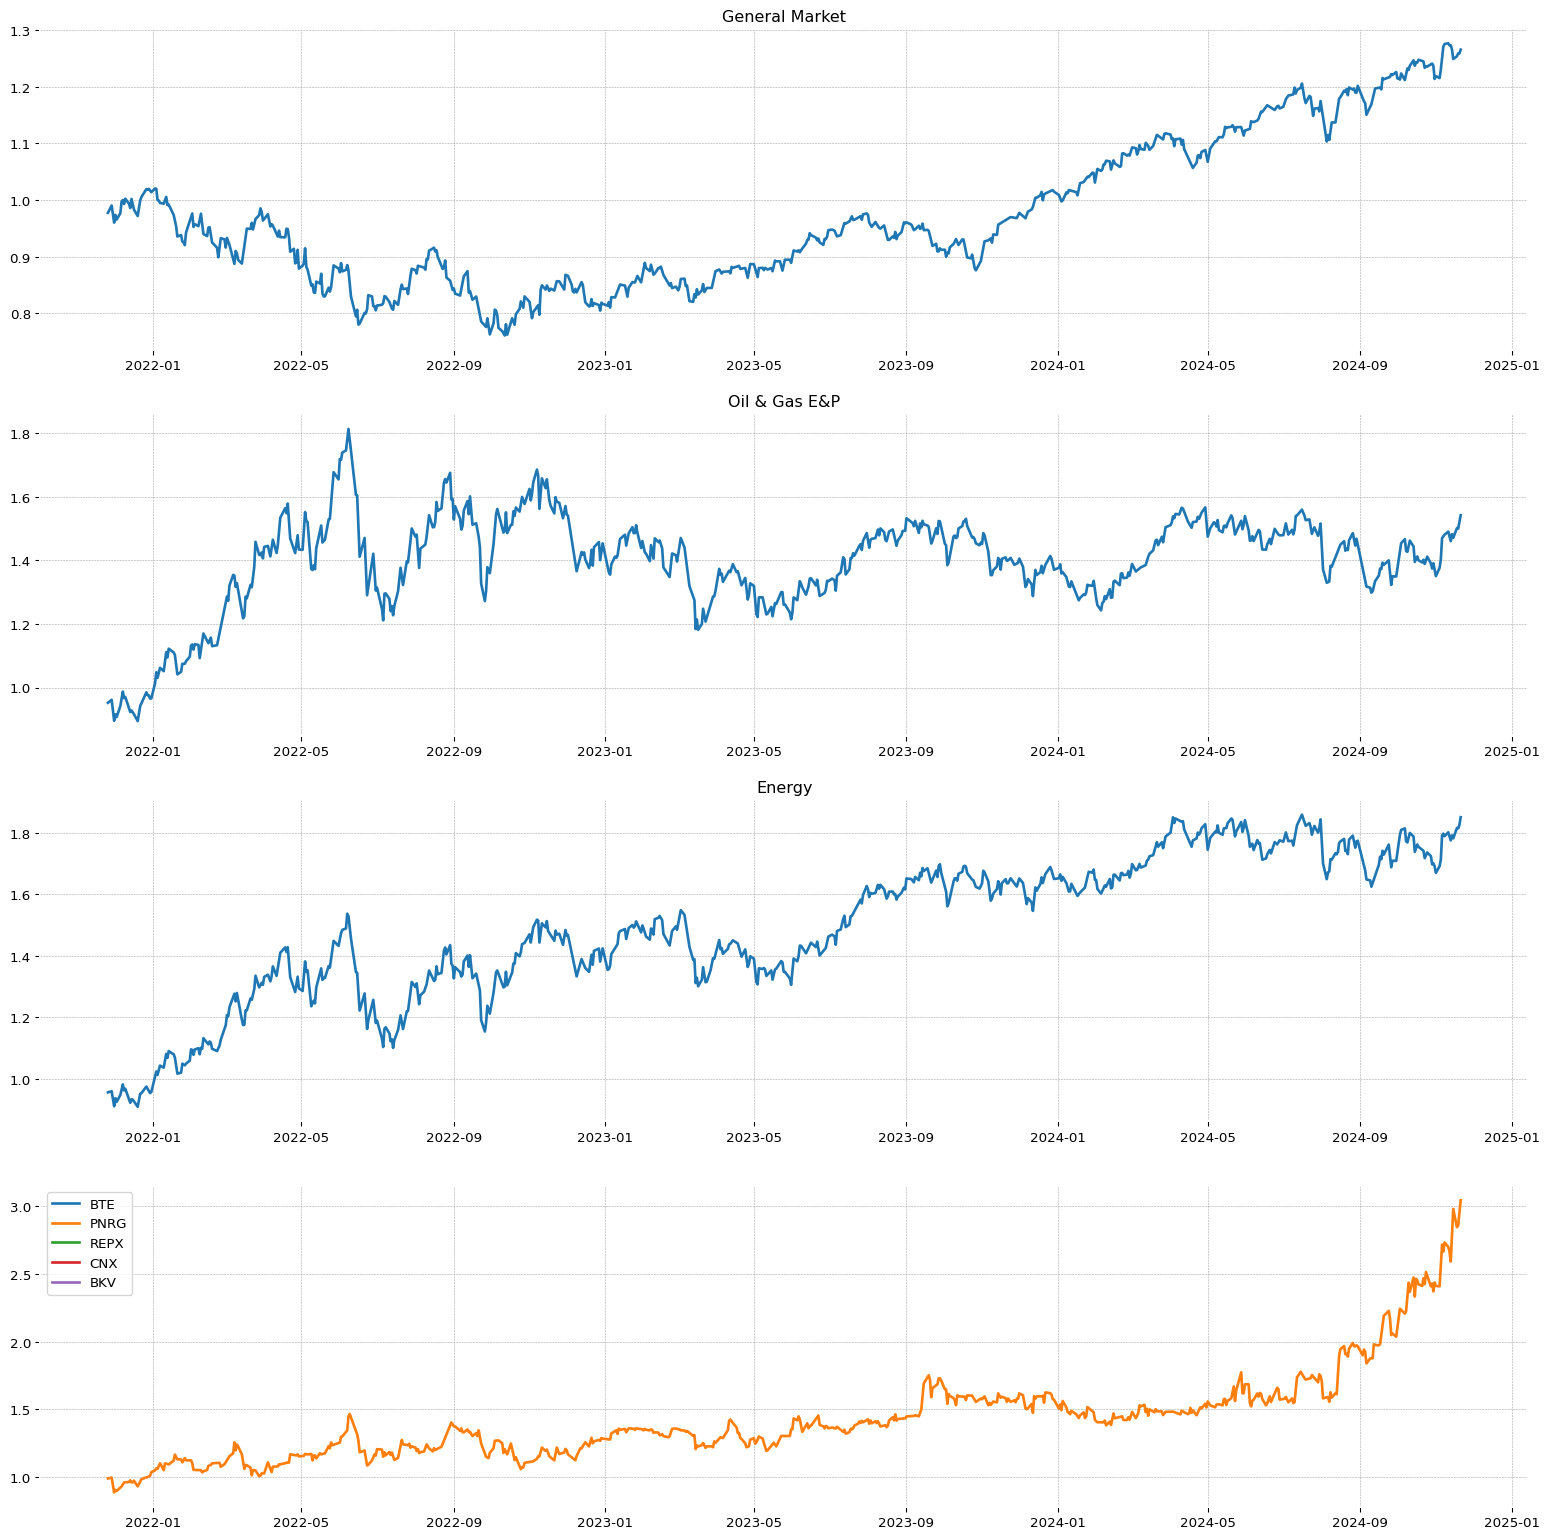
| 29.0 | PNRG | 90.02 | 80.39 | 78.48 | 60.74 | Energy | Oil & Gas E&P | 92 | 0.0 | 0.0 | 97.54 | 0.0 | 1.0 | 4.0 | 199.19 | 1.0 | 1.0 |
***************************
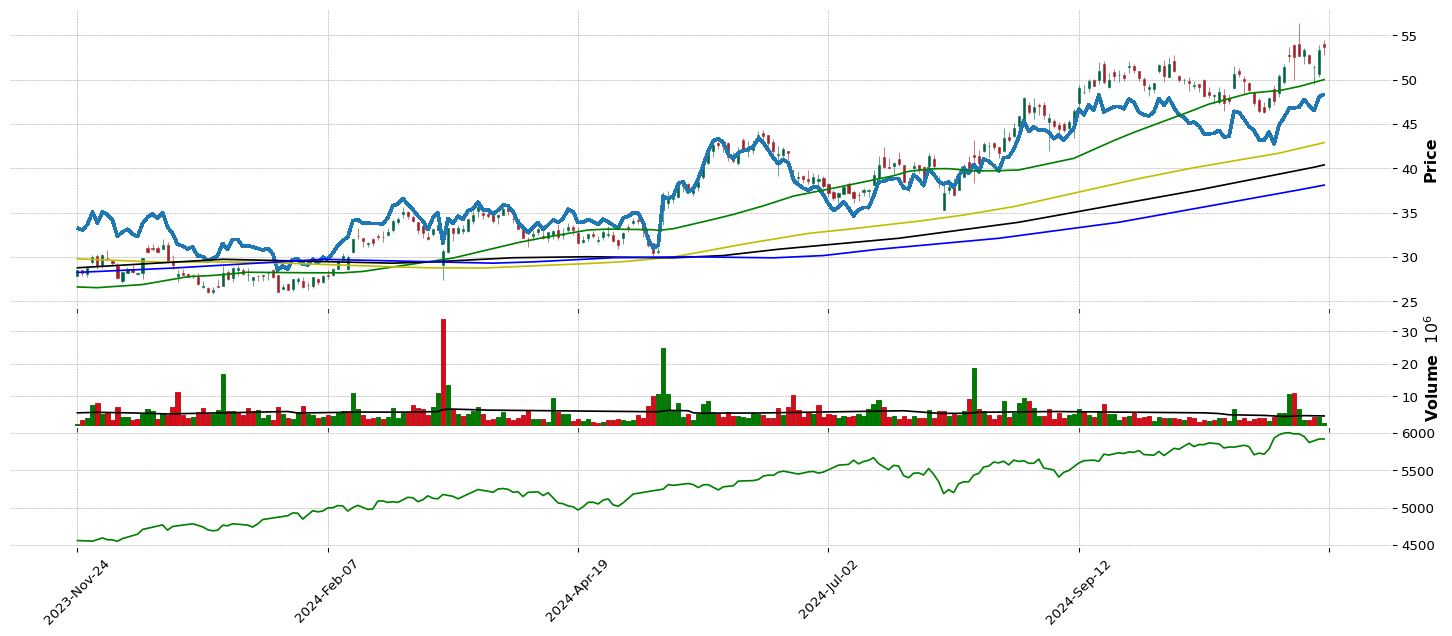
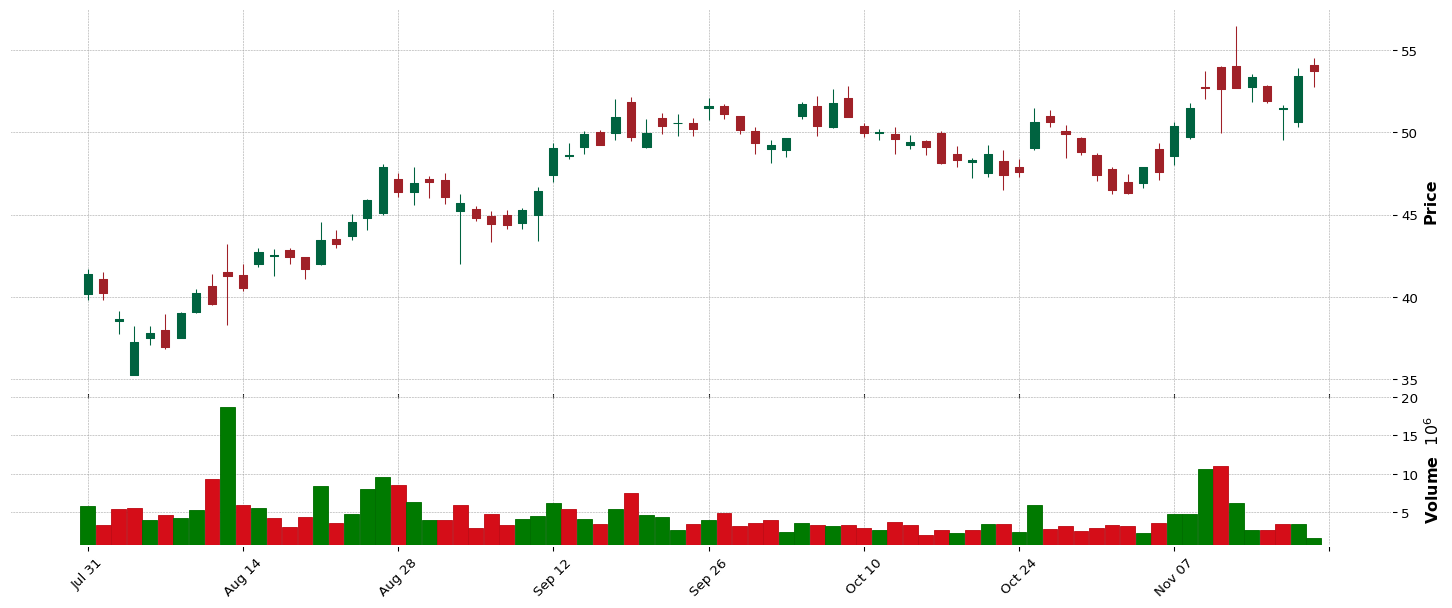
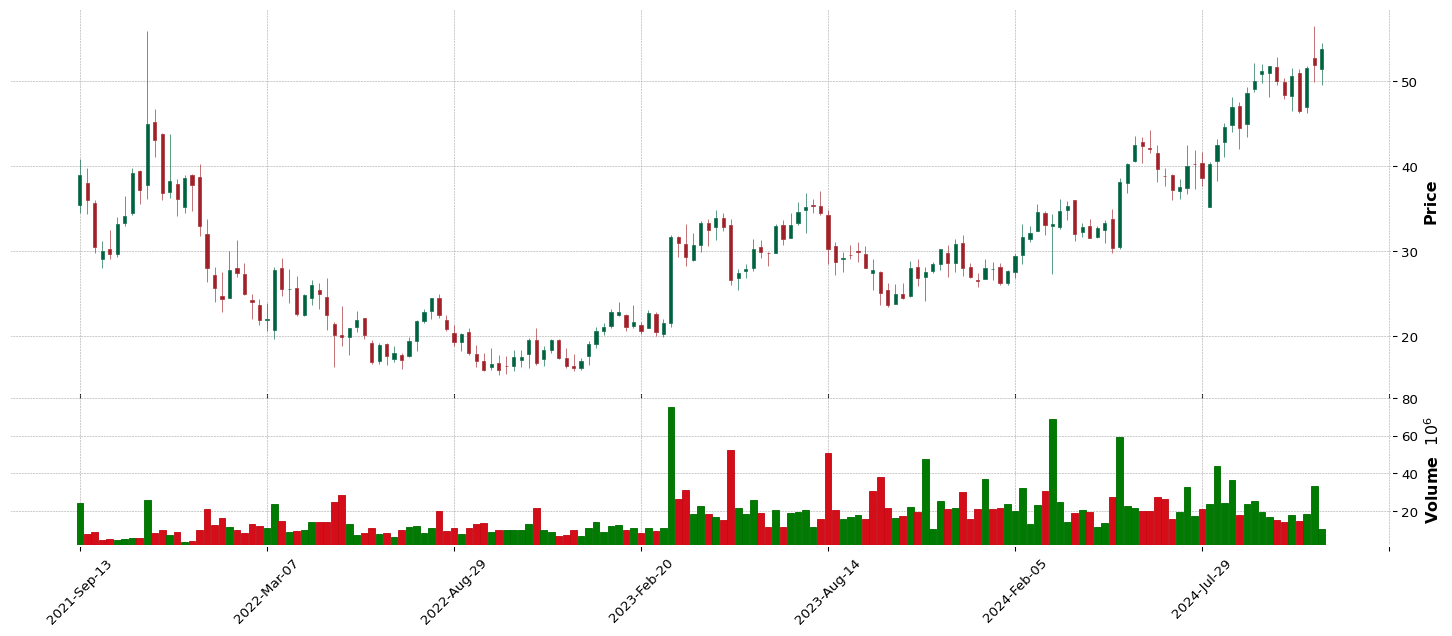
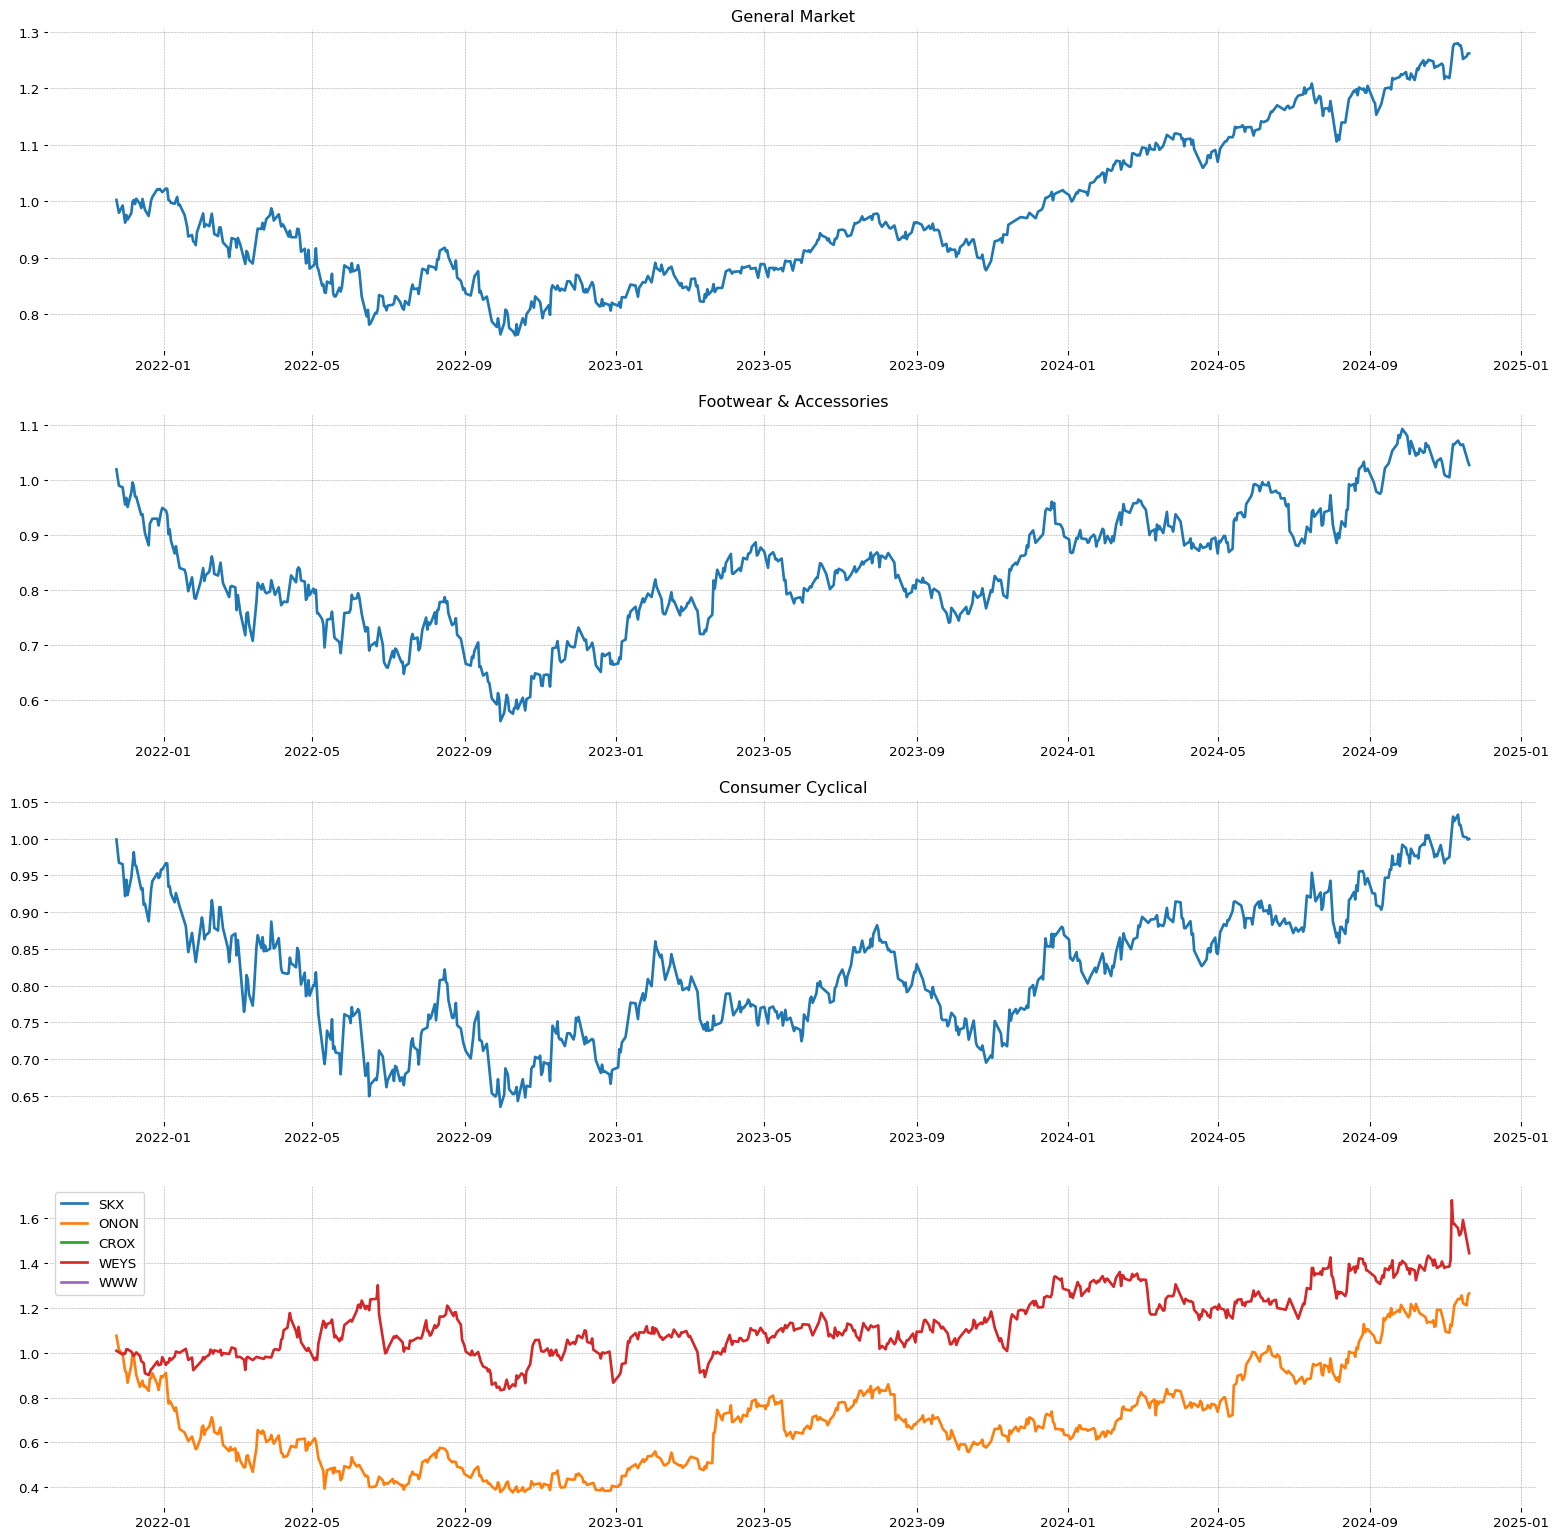
--> GENERAL INFORMATION ONON :
| Total stock number: | 211.57M |
| Market Cap: | 17.371881163B |
| Namee: | On Holding AG |
| IPO date: | 2021-09-15 |
| Type of Sector: | Consumer Cyclical |
| Sector Position: | 3/11 |
| RSI Sector: | 68/346 |
| Type of industry: | Footwear & Accessories |
| Industry stock position: | 69/147 |
| Industry stock position: | 1/8 |
| RS Rating: | 89.75 |
| EPS Rating: | 87.19 |
| SMR Rating: | 93.19 |
| 1 year return: | 88.69 |
| Stability Value of Earnigs: | 99.0 |
| Stock: | RS | EPS | SMR | 2Q | 1Q |
| ONON | 89 | 87 | 93 | 107 | 821 |
| WEYS | 53 | 81 | 47 | -11 | 13 |
| SHOO | 40 | 84 | 41 | 24 | 6 |
| NKE | 7 | 28 | 55 | 47 | -26 |
| SKX | 0 | 78 | 75 | 31 | -7 |
| CROX | 0 | 75 | 58 | 4 | 10 |
| WWW | 0 | 20 | 47 | -182 | -43 |
| DECK | 0 | 89 | 93 | 42 | 86 |
| 3Q | 2Q | 1Q | |
| Increase Earnings of last quarters: | 107.14 | 813.59 | -100.0% |
| Quarter maggiori 20% / 50% / 100% in 20: | 1 | 0 | 0 |
| Percentage surprise: | 157.14 | -7.24 | -29.16% |
| 2Q Increase Earnings: | 55.84 | 460.36 | 356.79% |
| 5/3/1 anno di Earnigs: | 0.0 | 0.01 | 0.07 |
| Perc. increase 3/1 Earnigs Vs 5/3: | 136.0 | 507.38% | |
| Revenue increase: | 24.78 | 27.77 | 32.32% |
| 2Q Revenue increase: | 20.22 | 26.27 | 30.04% |
| NeT income Ratio: | 17.43 | 5.42 | 4.79% |
| NeT income Increase: | 64.97 | 630.45 | -60.73% |
| EARNINGS | This Q | Next Q |
| this and next q growth: | 326.13 | -31.03% |
| Revision % of extimate growth | 0.0 | 0.0% |
| This Quarter / Next Quarter | 0.18 | 0.2 |
| last 7 | 0.18 | 0.2 |
| last 30 | 0.18 | 0.2 |
| last 60 | 0.18 | 0.2 |
| last 90 | 0.18 | 0.2 |
| REVENUE | This Q | Next Q |
| Growth sales extimation: | 32.50% | 30.00% |
| 2021 | 2022 | 2023 | ttm | |
| Earnings A/A increase: | -511.11 | 132.72 | 38.88% | |
| Earnings 2 A/A increase: | -1143.05 | -189.19 | 85.8% | |
| ROE value: | -31.13 | 6.34 | 7.78 | 10.19% |
| Net income Increase: | -518.47 | 133.89 | 37.95% |
--> Annual breakout:
| Current Year | Next Year | |
| Sales Improve: | 28.51% | 27.39% |
| EPS Growth Estimates | |
| No. of Analysts | 14 |
| Avg. Estimate | 592.42M |
| Low Estimate | 578.6M |
| High Estimate | 605.1M |
| Year Ago Sales | 447.1M |
| Sales Growth (year/est) | 32.50% |
| 2020 | 2021 | 2023 | ttm | |
| Current Liabilities/Current Asset: | 21.25 | 23.08 | 26.54% | |
| Non Current Liabilities/Non current Asset: | 67.34 | 51.4 | 48.18% | |
| Total Liabilities/Current Asset: | 40.23 | 39.25 | 45.03% | |
| Y/Y short debt situation: | 137.38 | 18.38 | 25.91% | |
| Y/Y long debt situation: | 258.29 | -7.11 | 25.16% |
| 3Q | 2Q | 1Q | |
| 2Q Increase Earnings: | 55.84 | 460.36 | 356.79% |
| 2Q Revenue increase: | 20.22 | 26.27 | 30.04% |
| 2Q NeT income Ratio: | 5.71 | 11.42 | 5.11% |
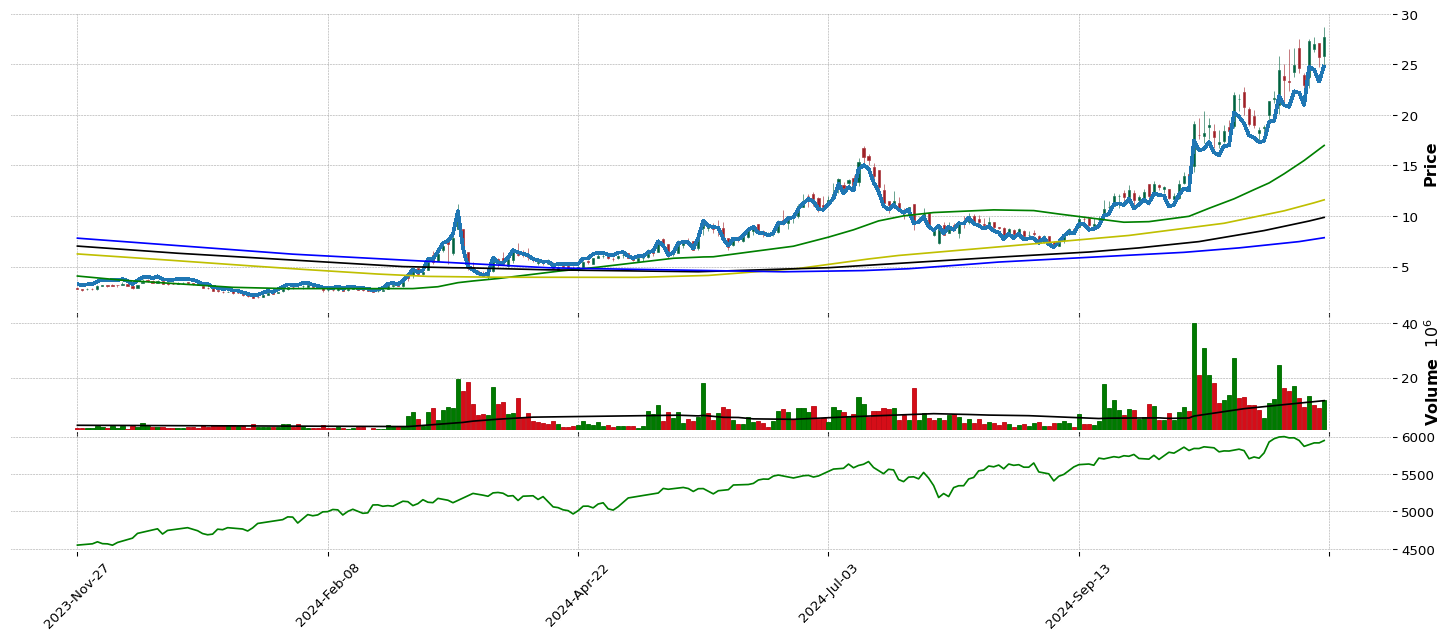
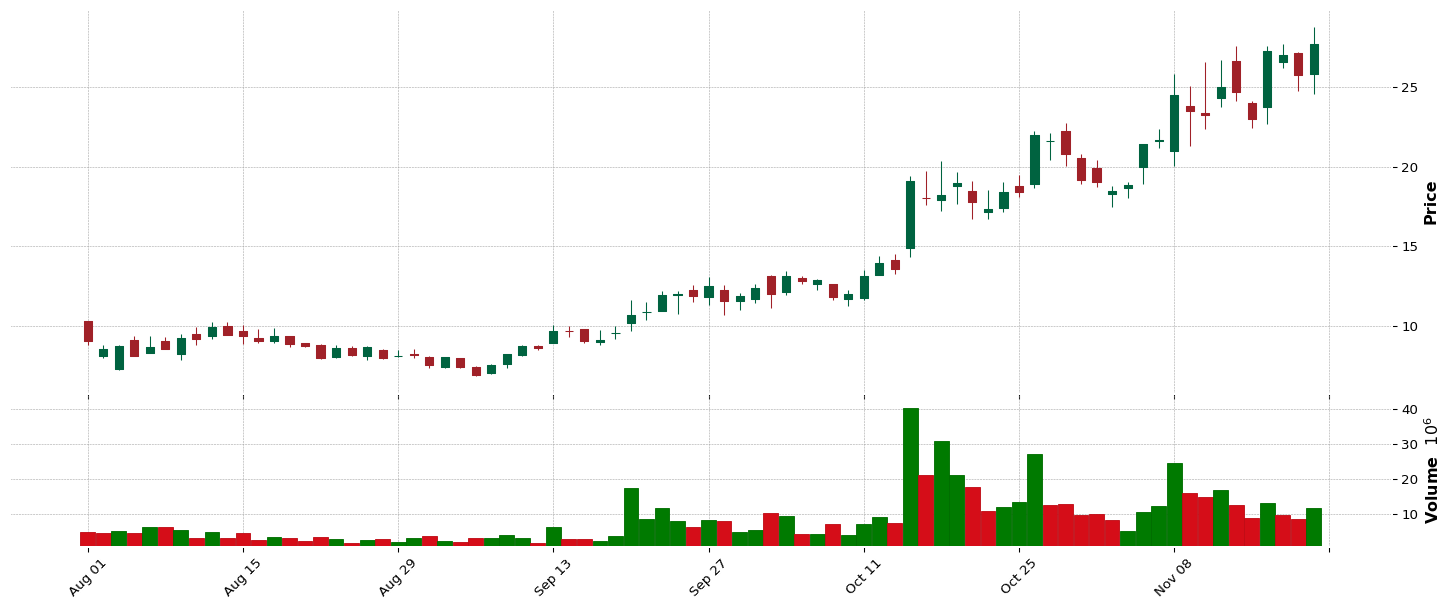
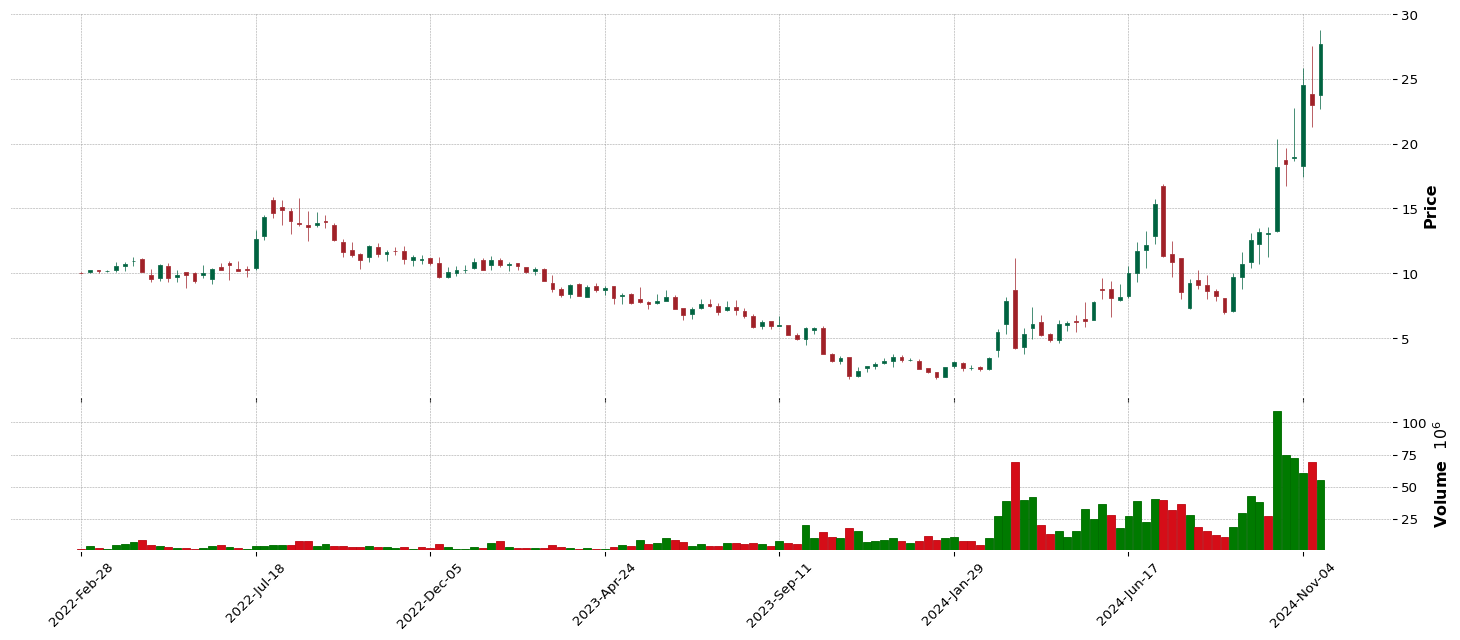
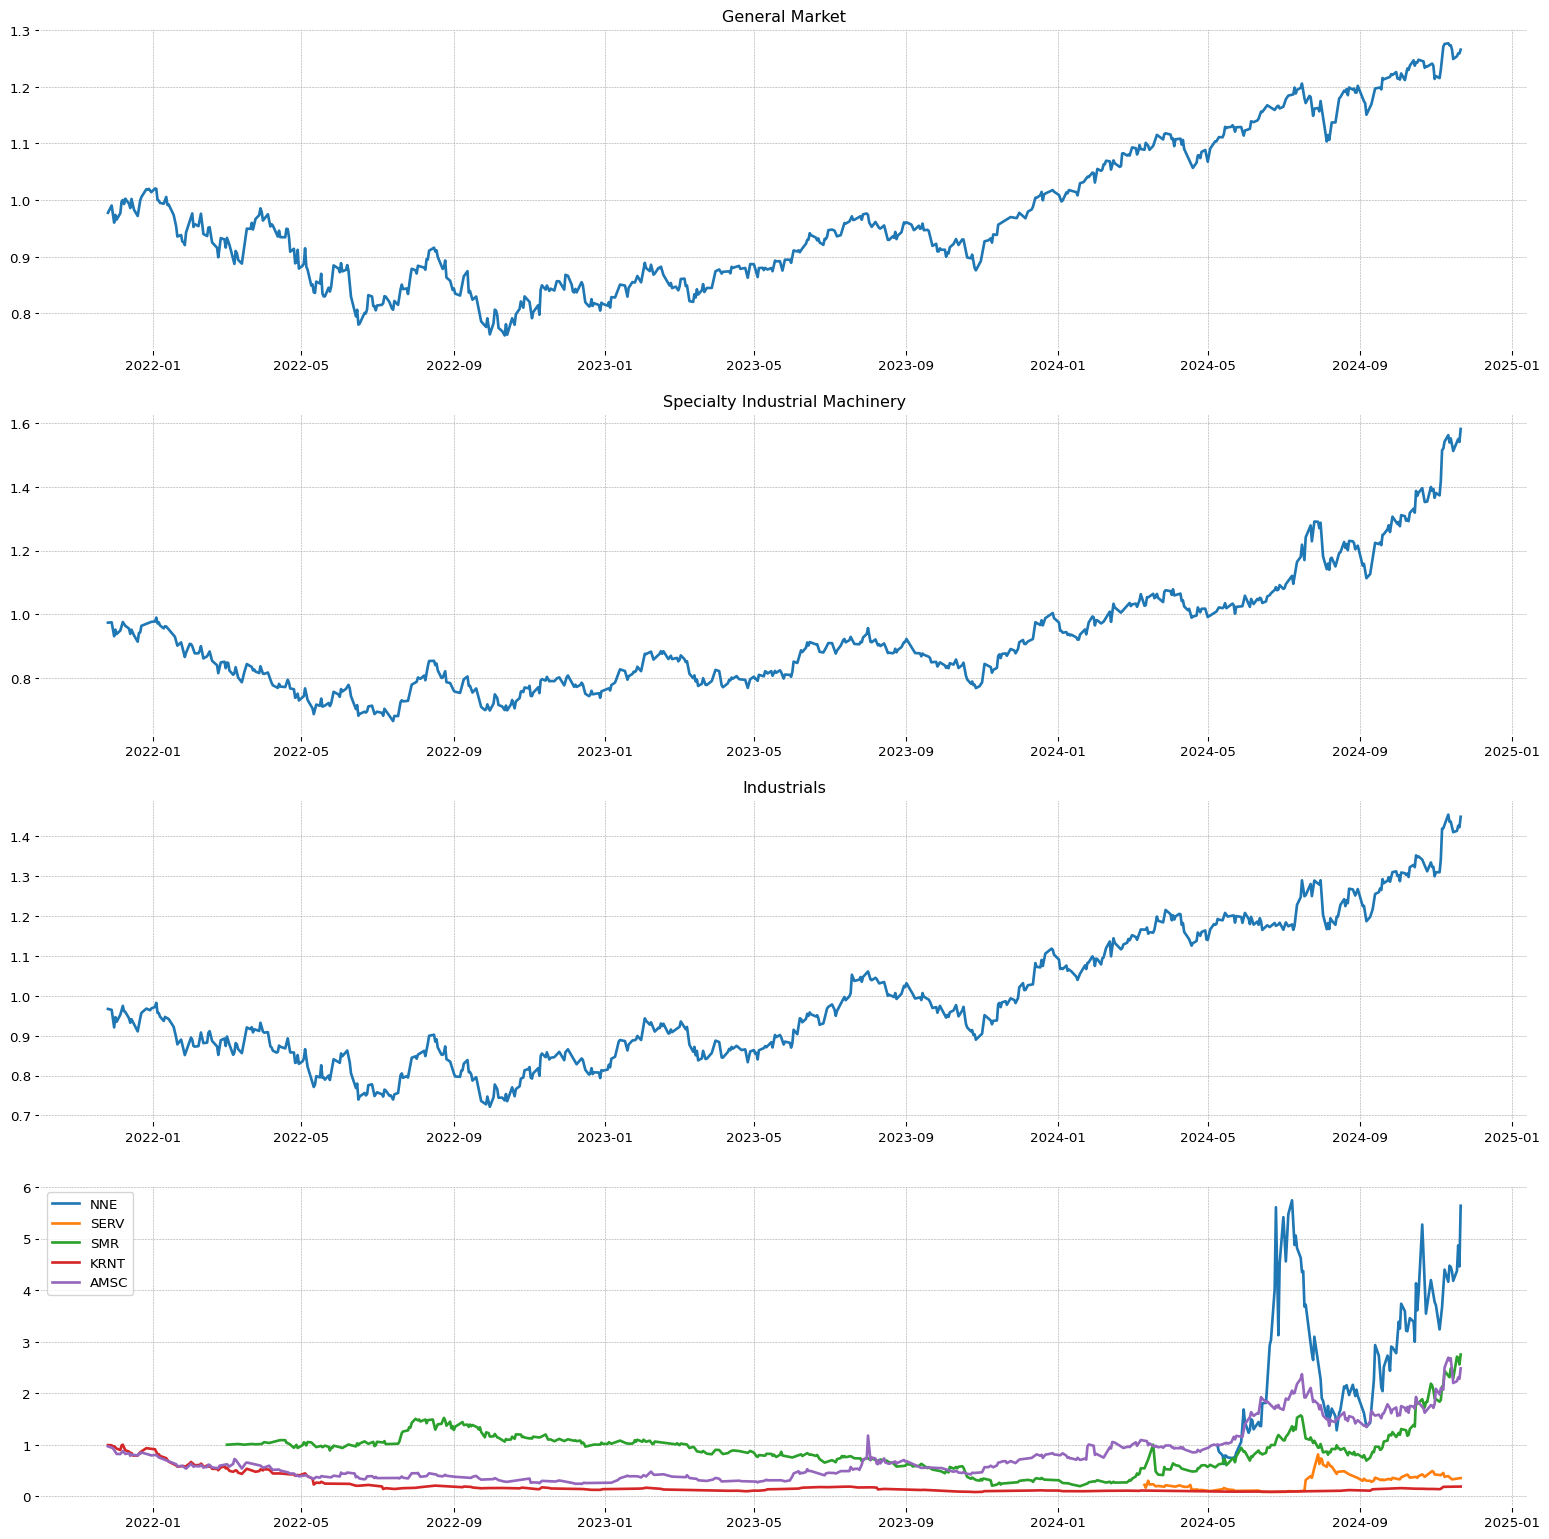
| SMR | EPS | RS | 11.22 | 6.55 | 99 |
| Sector | Sector Position |
| Industrials | 4/11 |
| Industry | Industry Position - | Stock on industry - | RSI Sector: |
| Specialty Industrial Machinery | 67/147 | 1/54 | 3/412 |
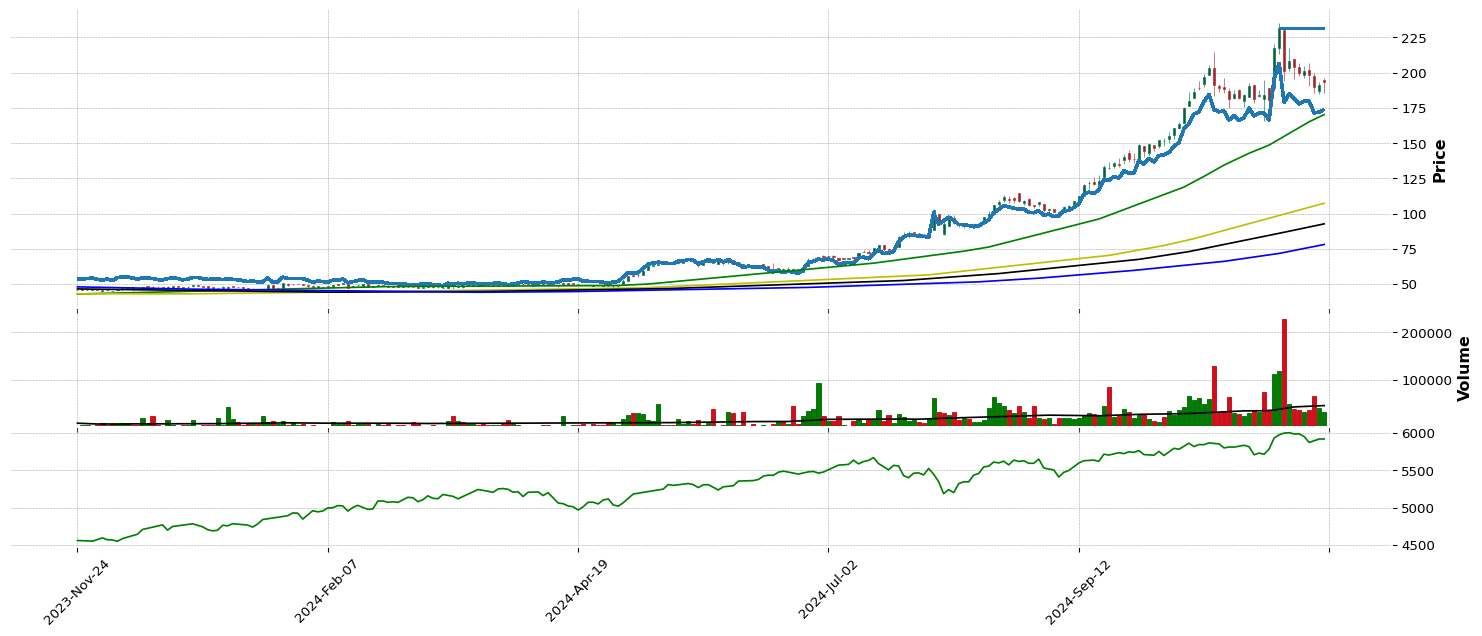
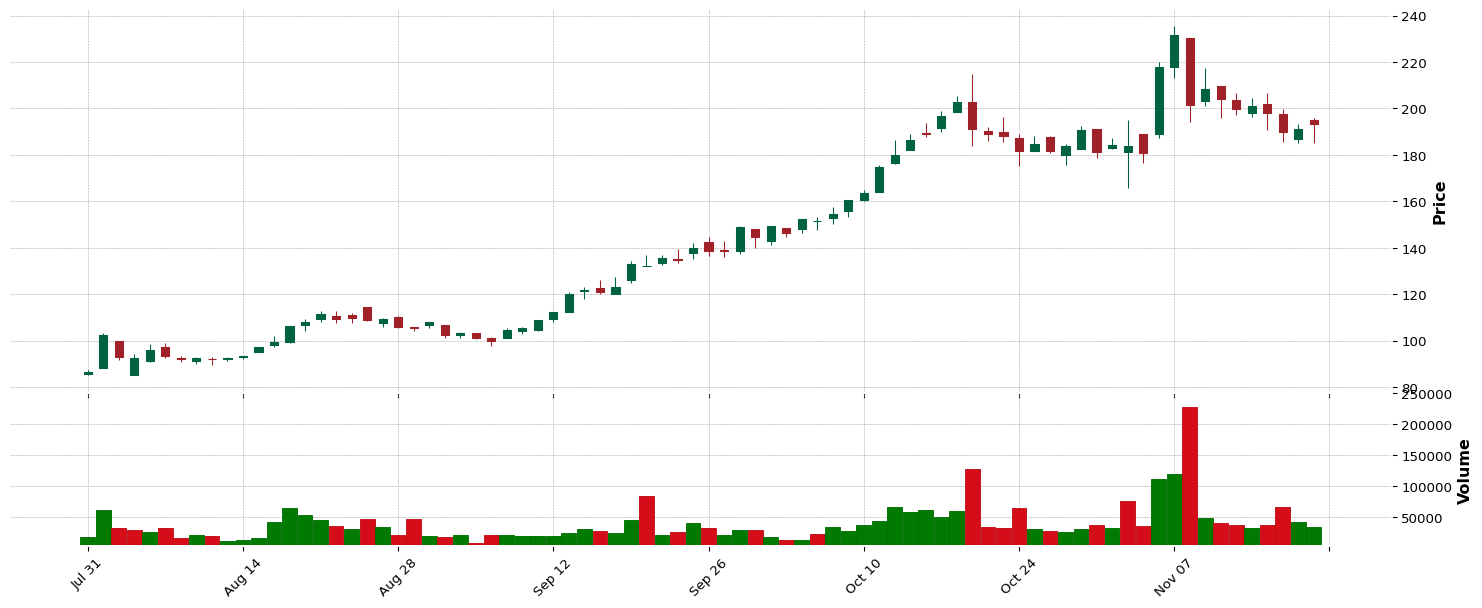
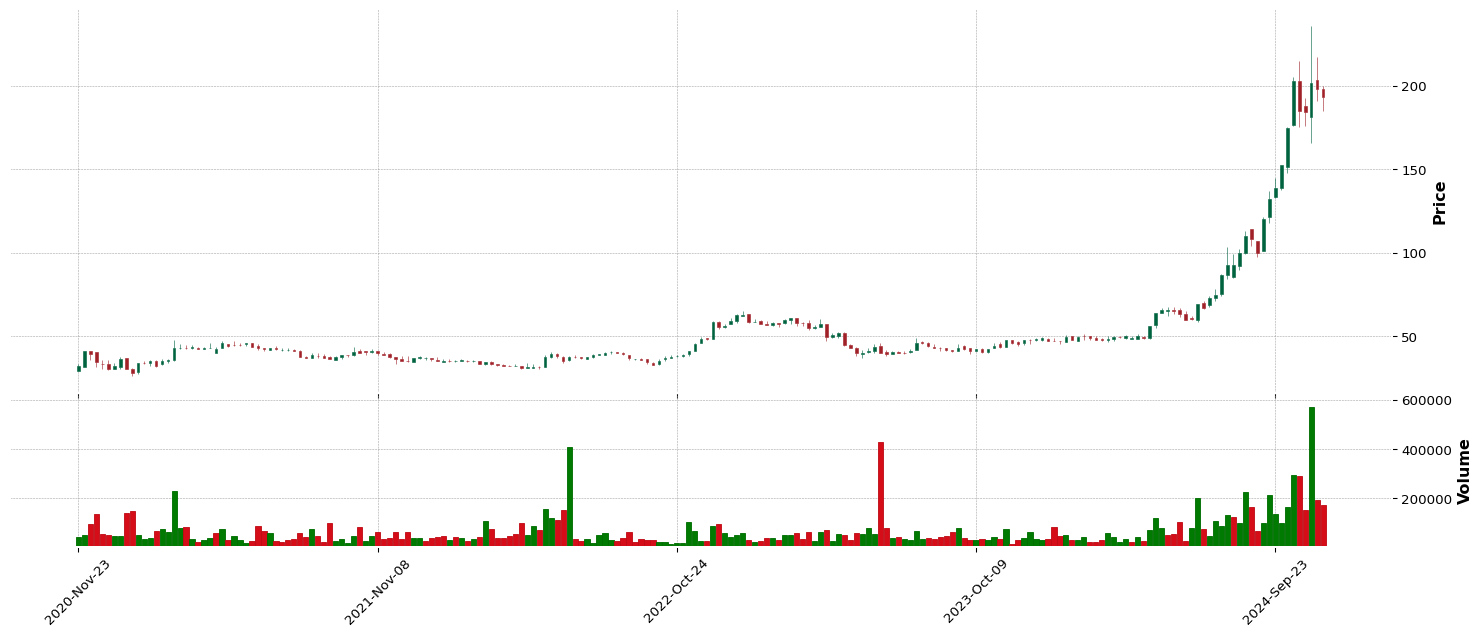
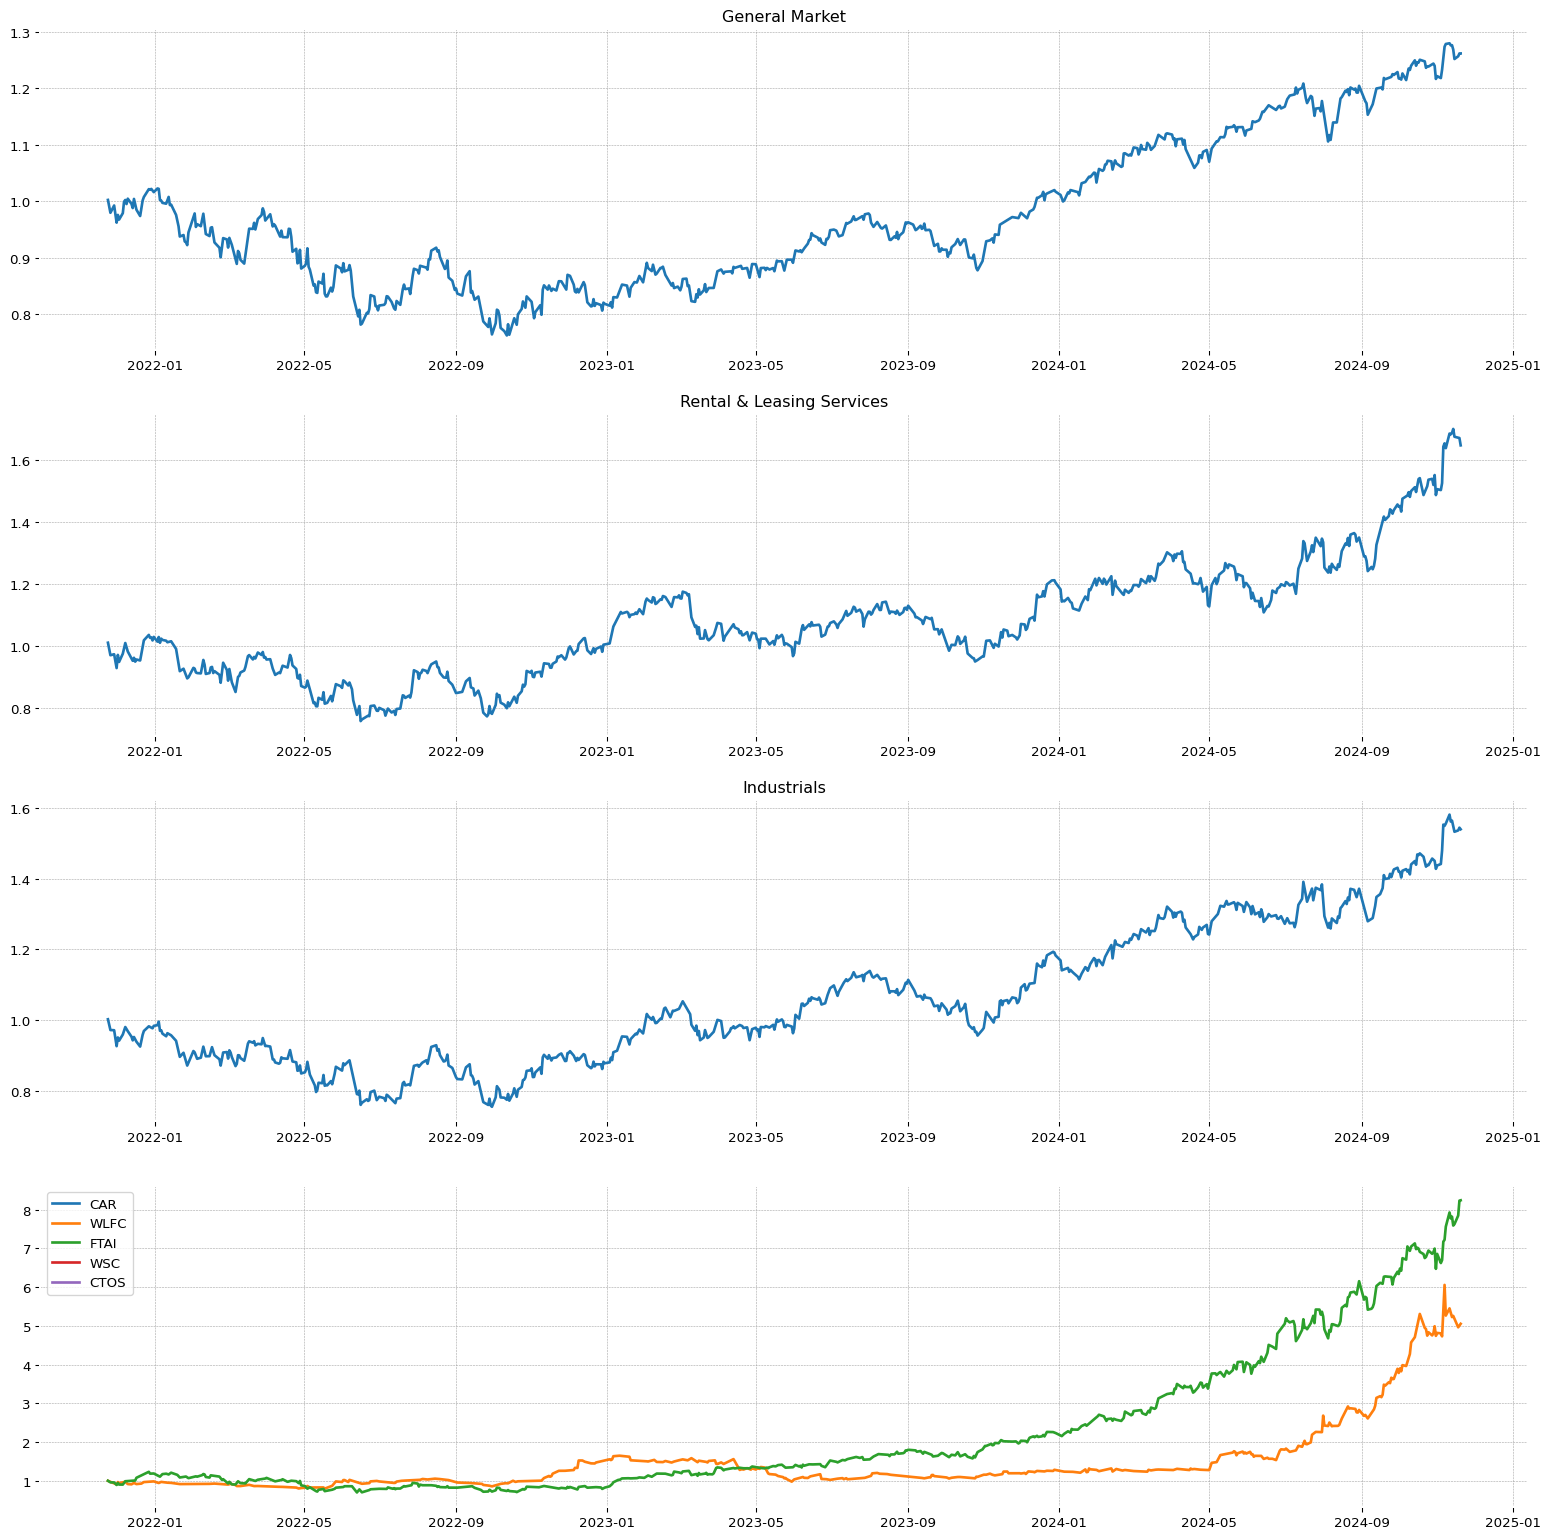
 SEZL
SEZL| SMR | EPS | RS | 97.52 | 98.51 | 98 |
| Sector | Sector Position |
| Industrials | 4/11 |
| Industry | Industry Position - | Stock on industry - | RSI Sector: |
| Rental & Leasing Services | 16/147 | 2/17 | 8/412 |
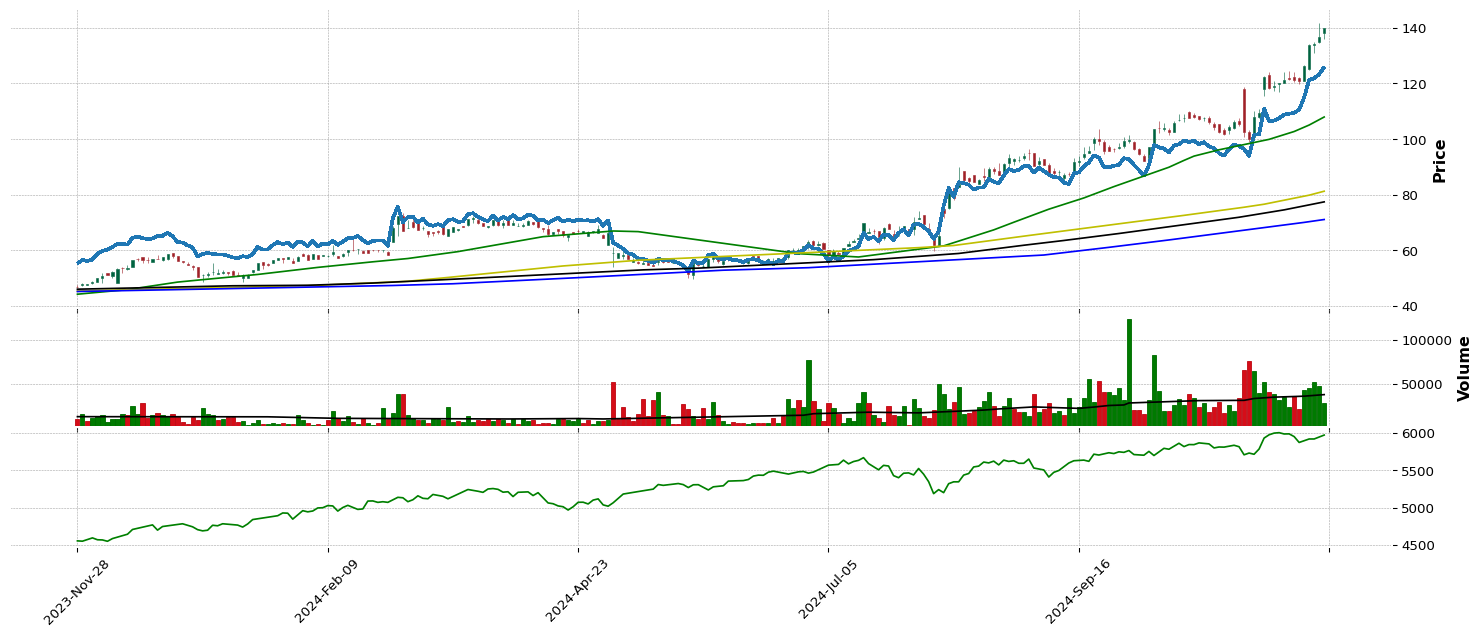
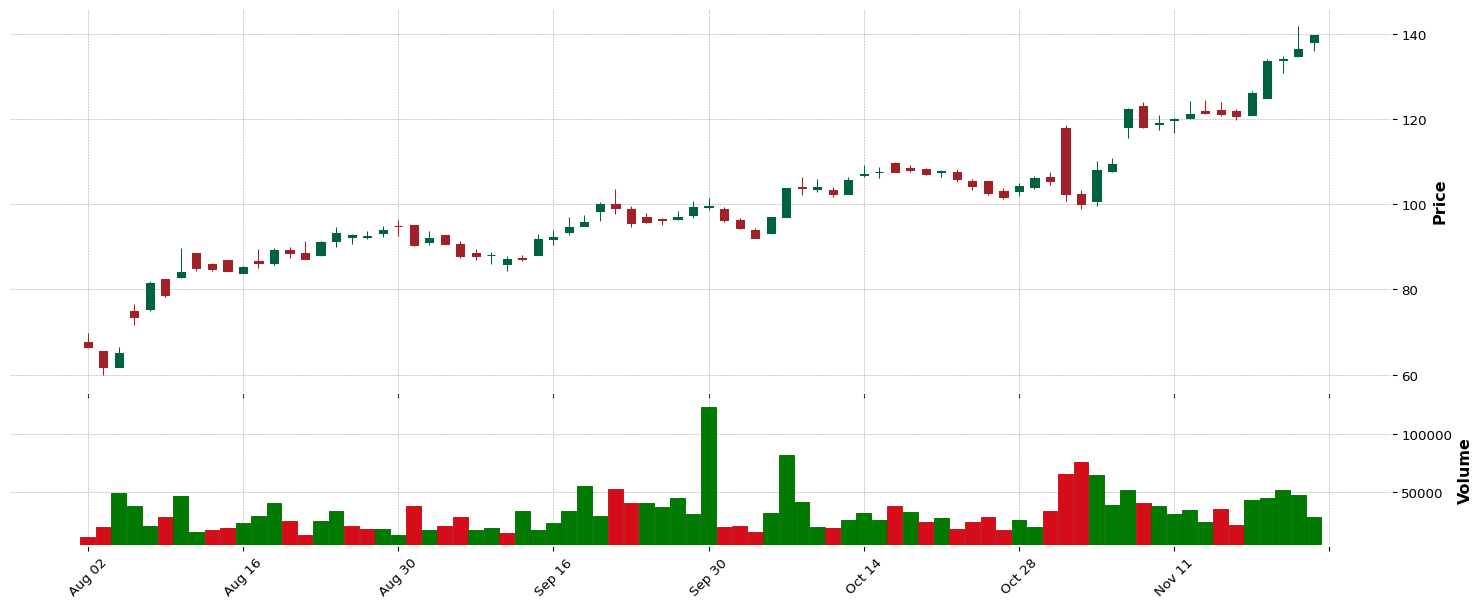
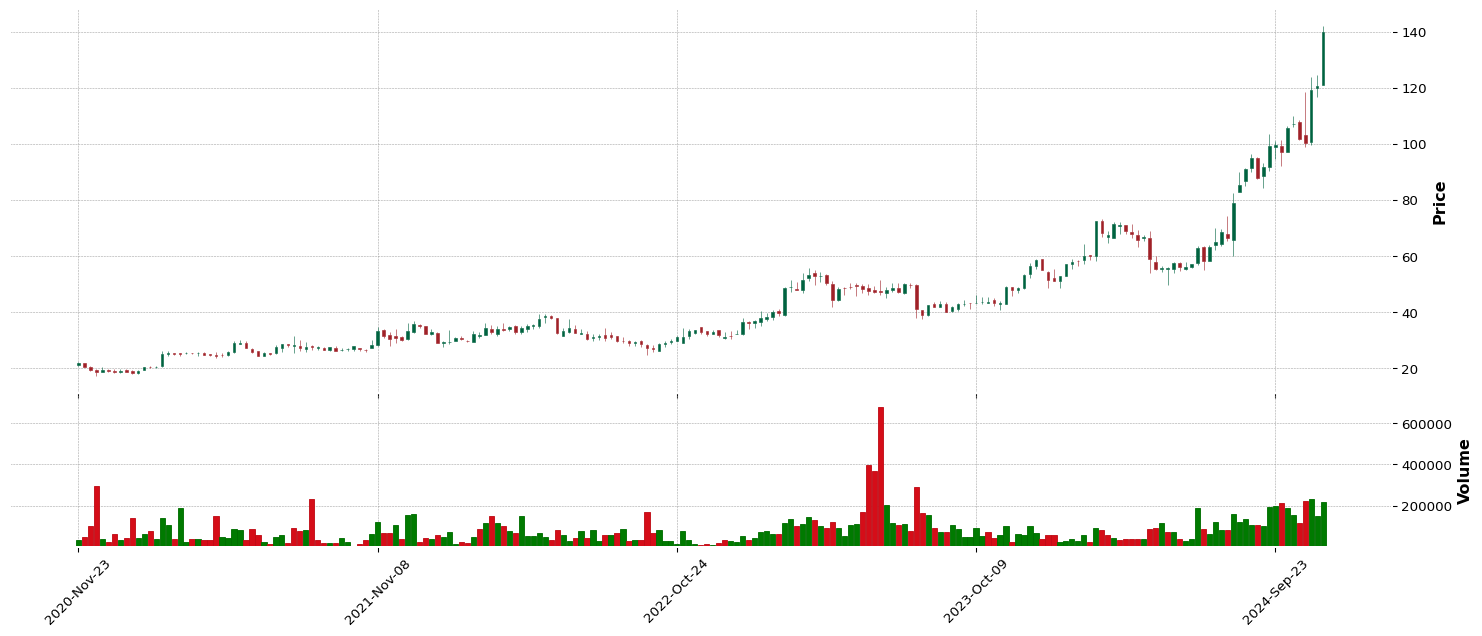
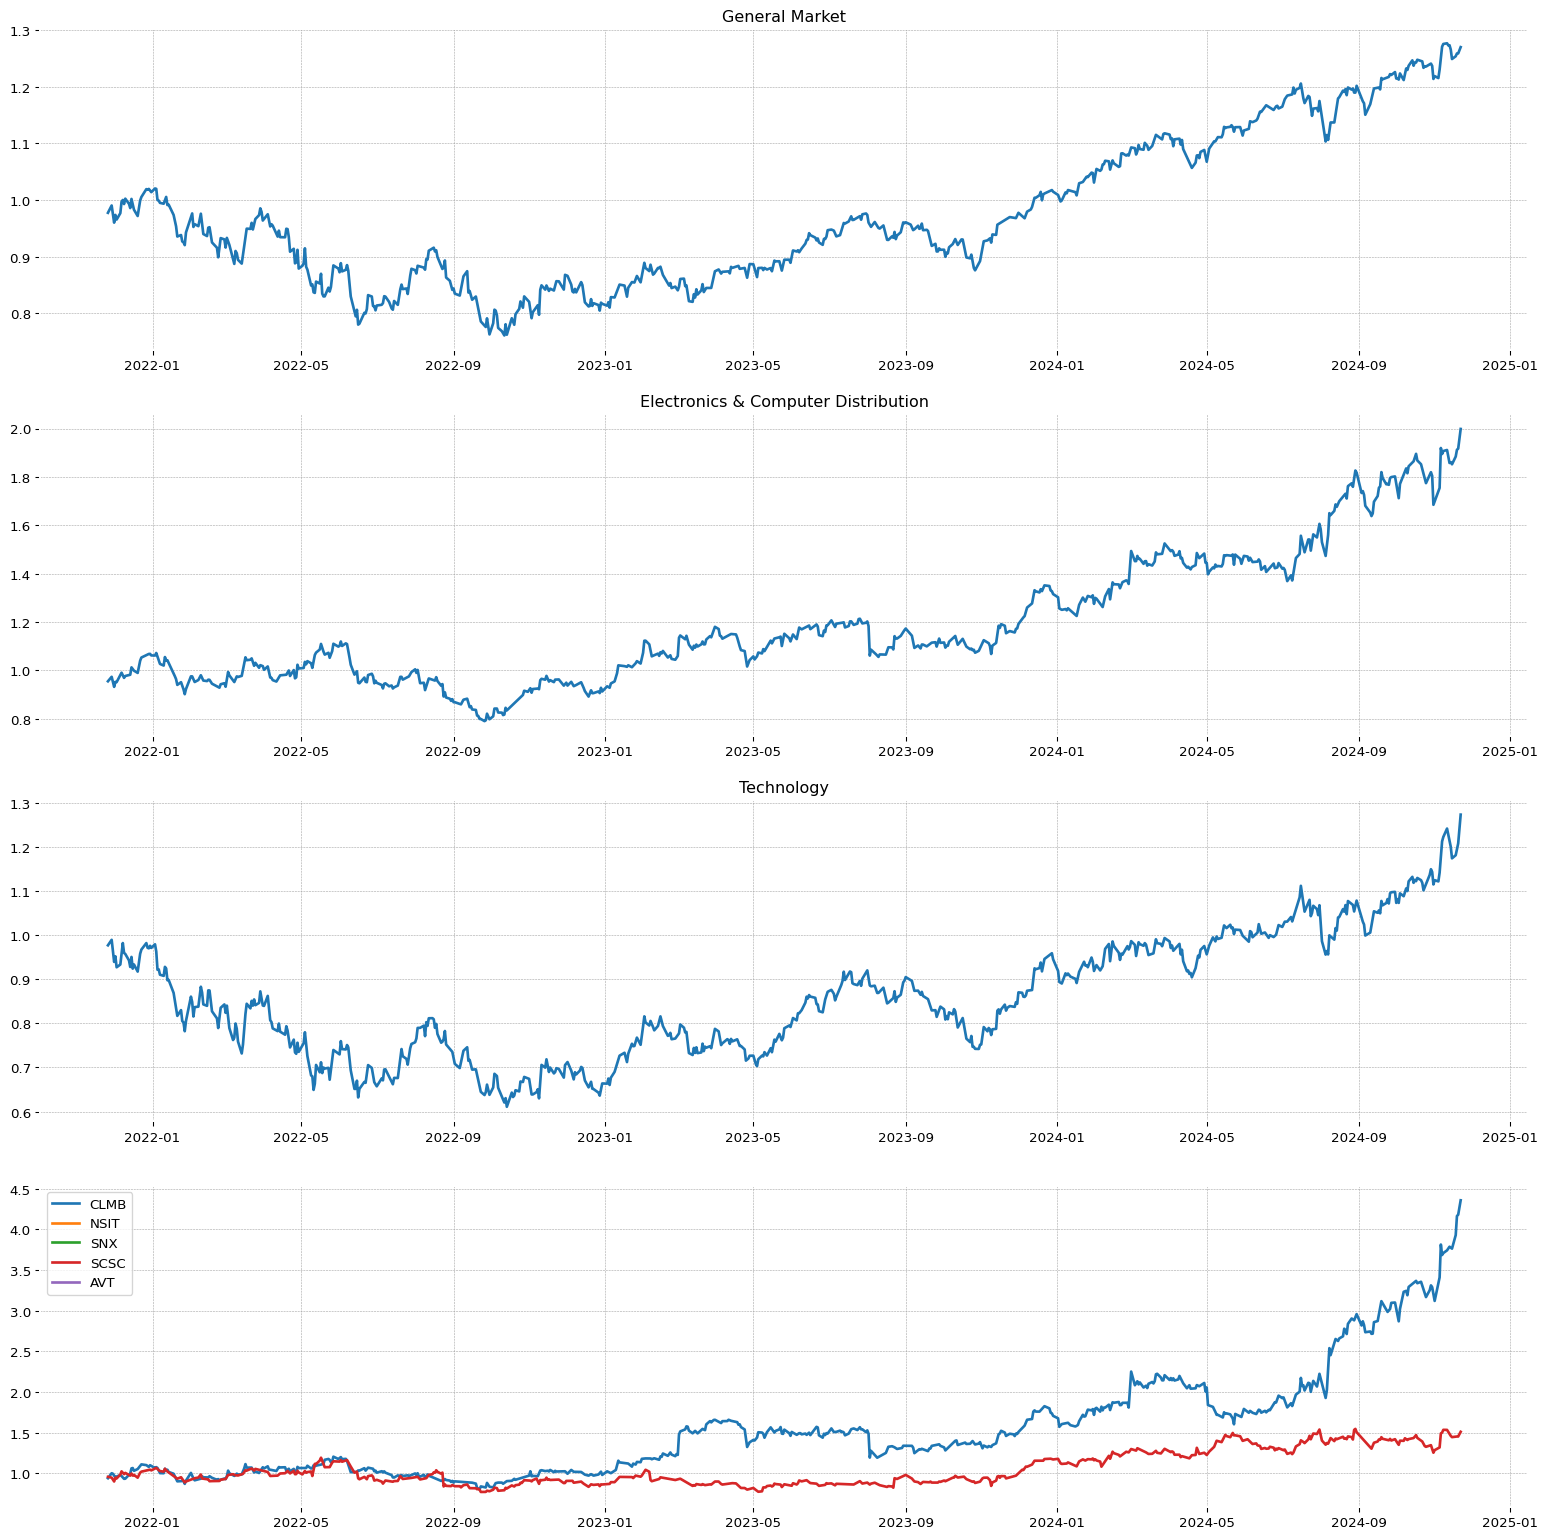
 CLMB
CLMB| SMR | EPS | RS | 73.14 | 86.79 | 96 |
| Sector | Sector Position |
| Technology | 2/11 |
| Industry | Industry Position - | Stock on industry - | RSI Sector: |
| Electronics & Computer Distribution | 40/147 | 1/7 | 17/457 |
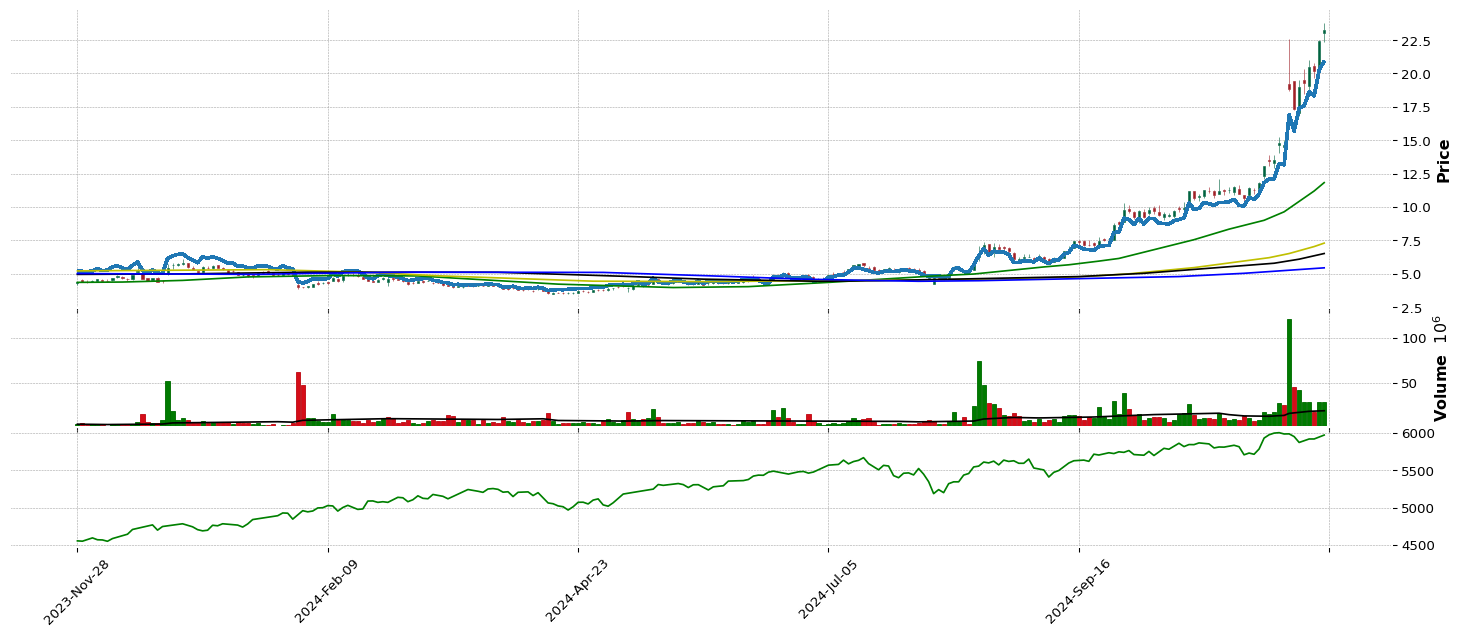
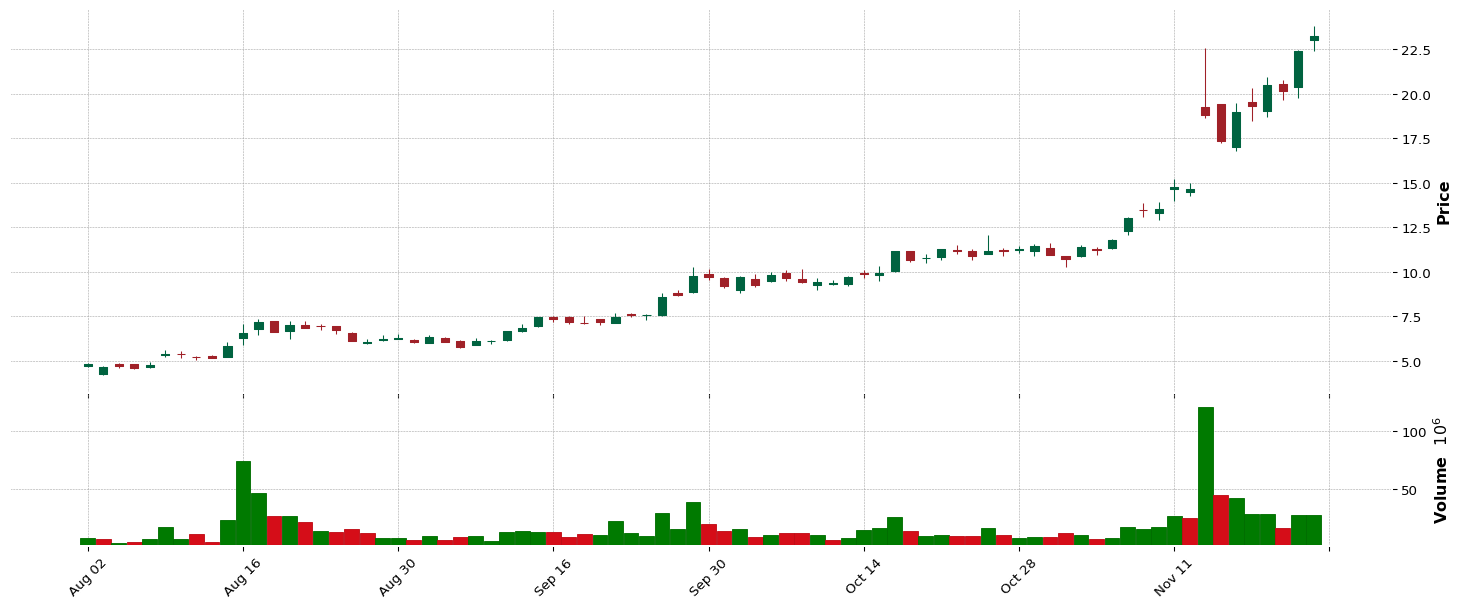
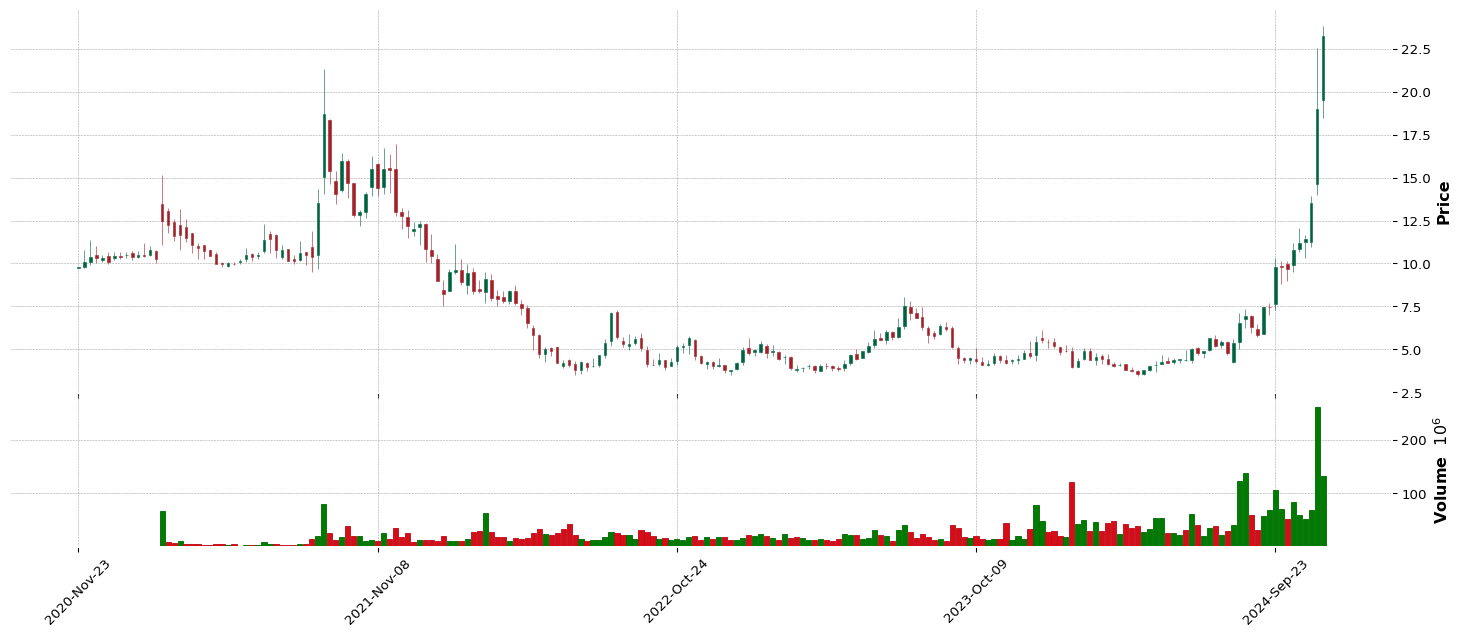
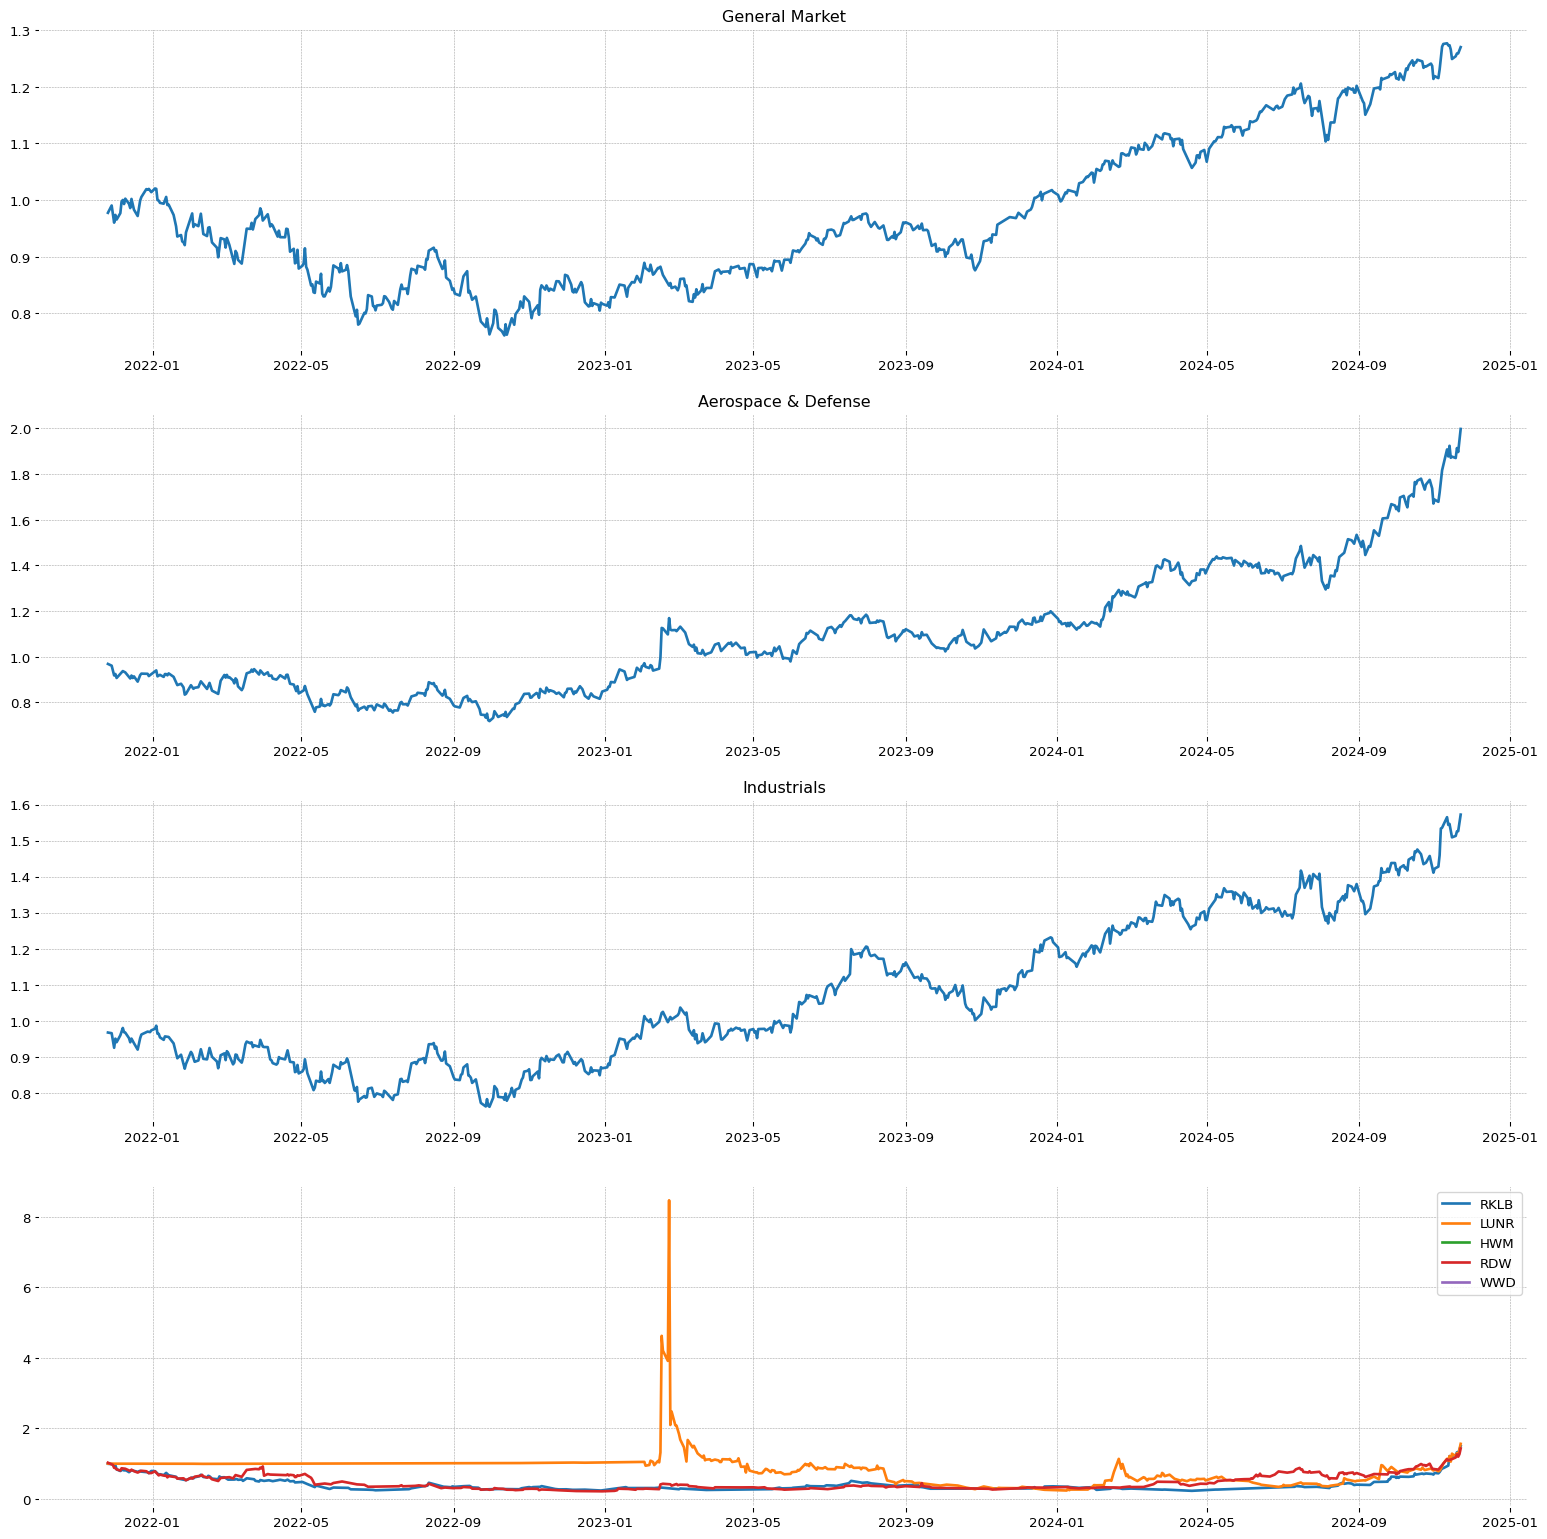
 RKLB
RKLB| SMR | EPS | RS | 82.77 | 45.68 | 98 |
| Sector | Sector Position |
| Industrials | 4/11 |
| Industry | Industry Position - | Stock on industry - | RSI Sector: |
| Aerospace & Defense | 27/147 | 1/48 | 2/412 |
 TLN
TLN| SMR | EPS | RS | 83.06 | 24.37 | 97 |
| Sector | Sector Position |
| Utilities | 10/11 |
| Industry | Industry Position - | Stock on industry - | RSI Sector: |
| Utilities - Independent Power Producers | 109/147 | 1/6 | 3/91 |
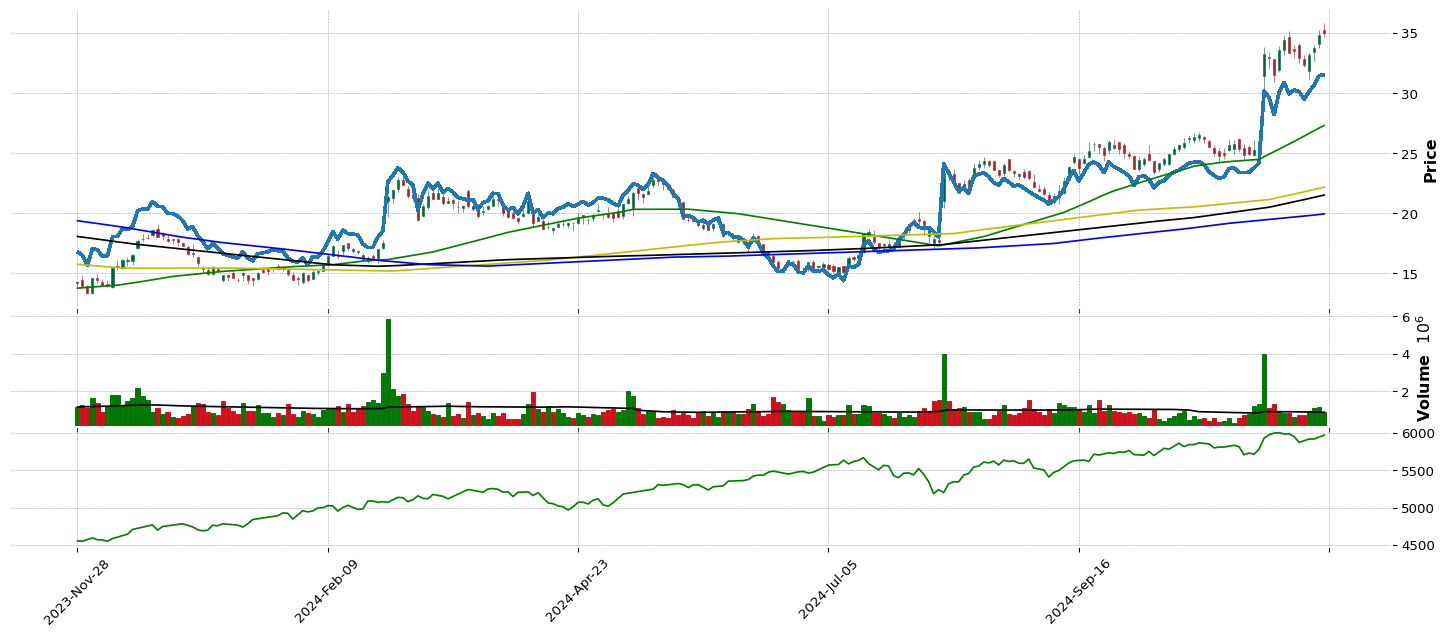
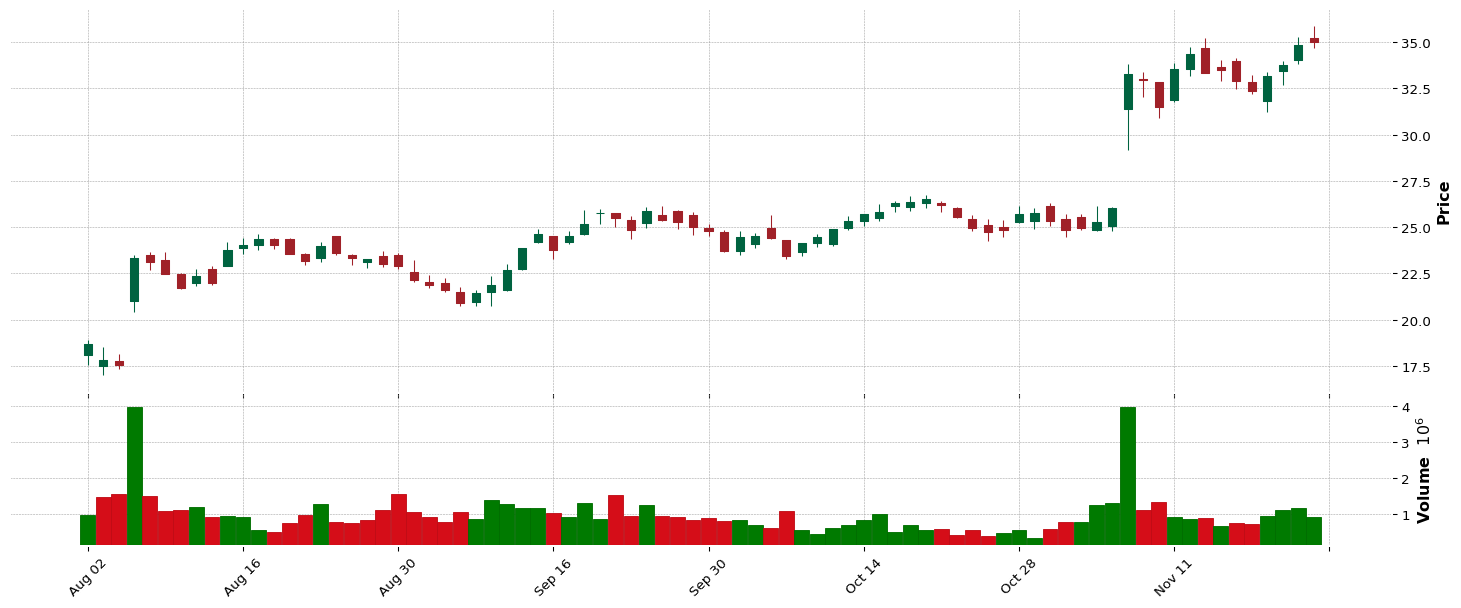
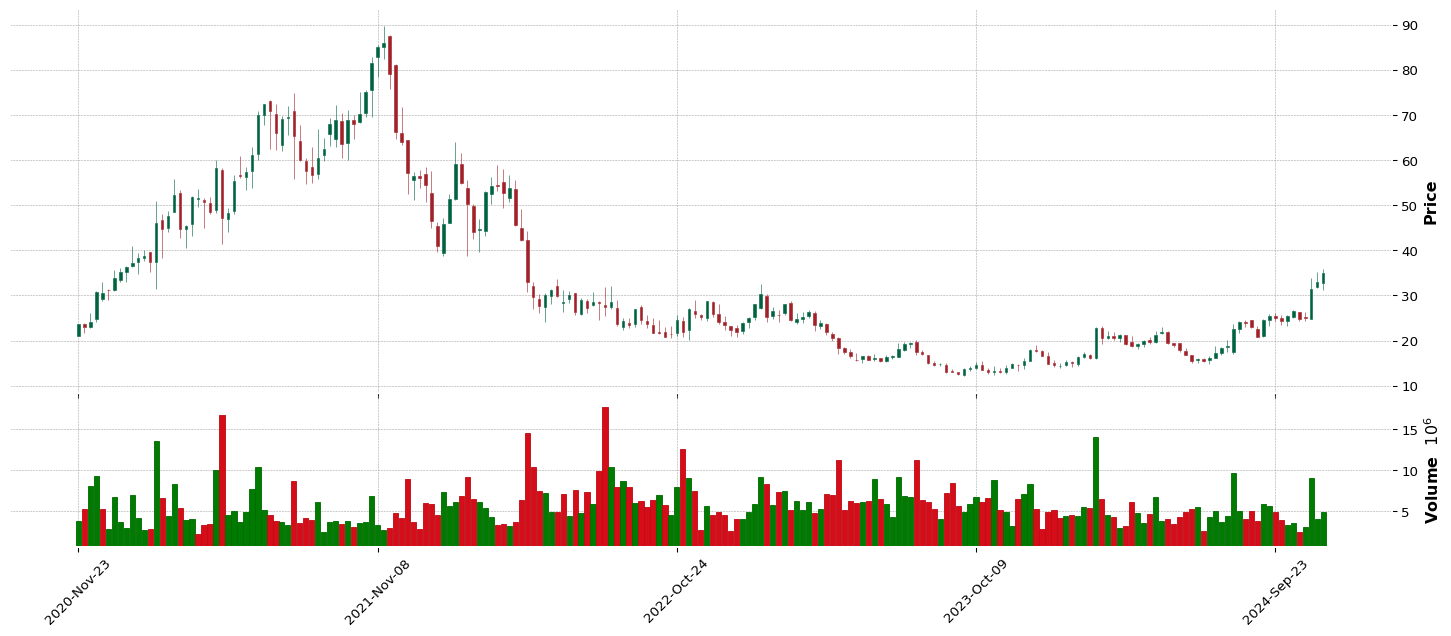
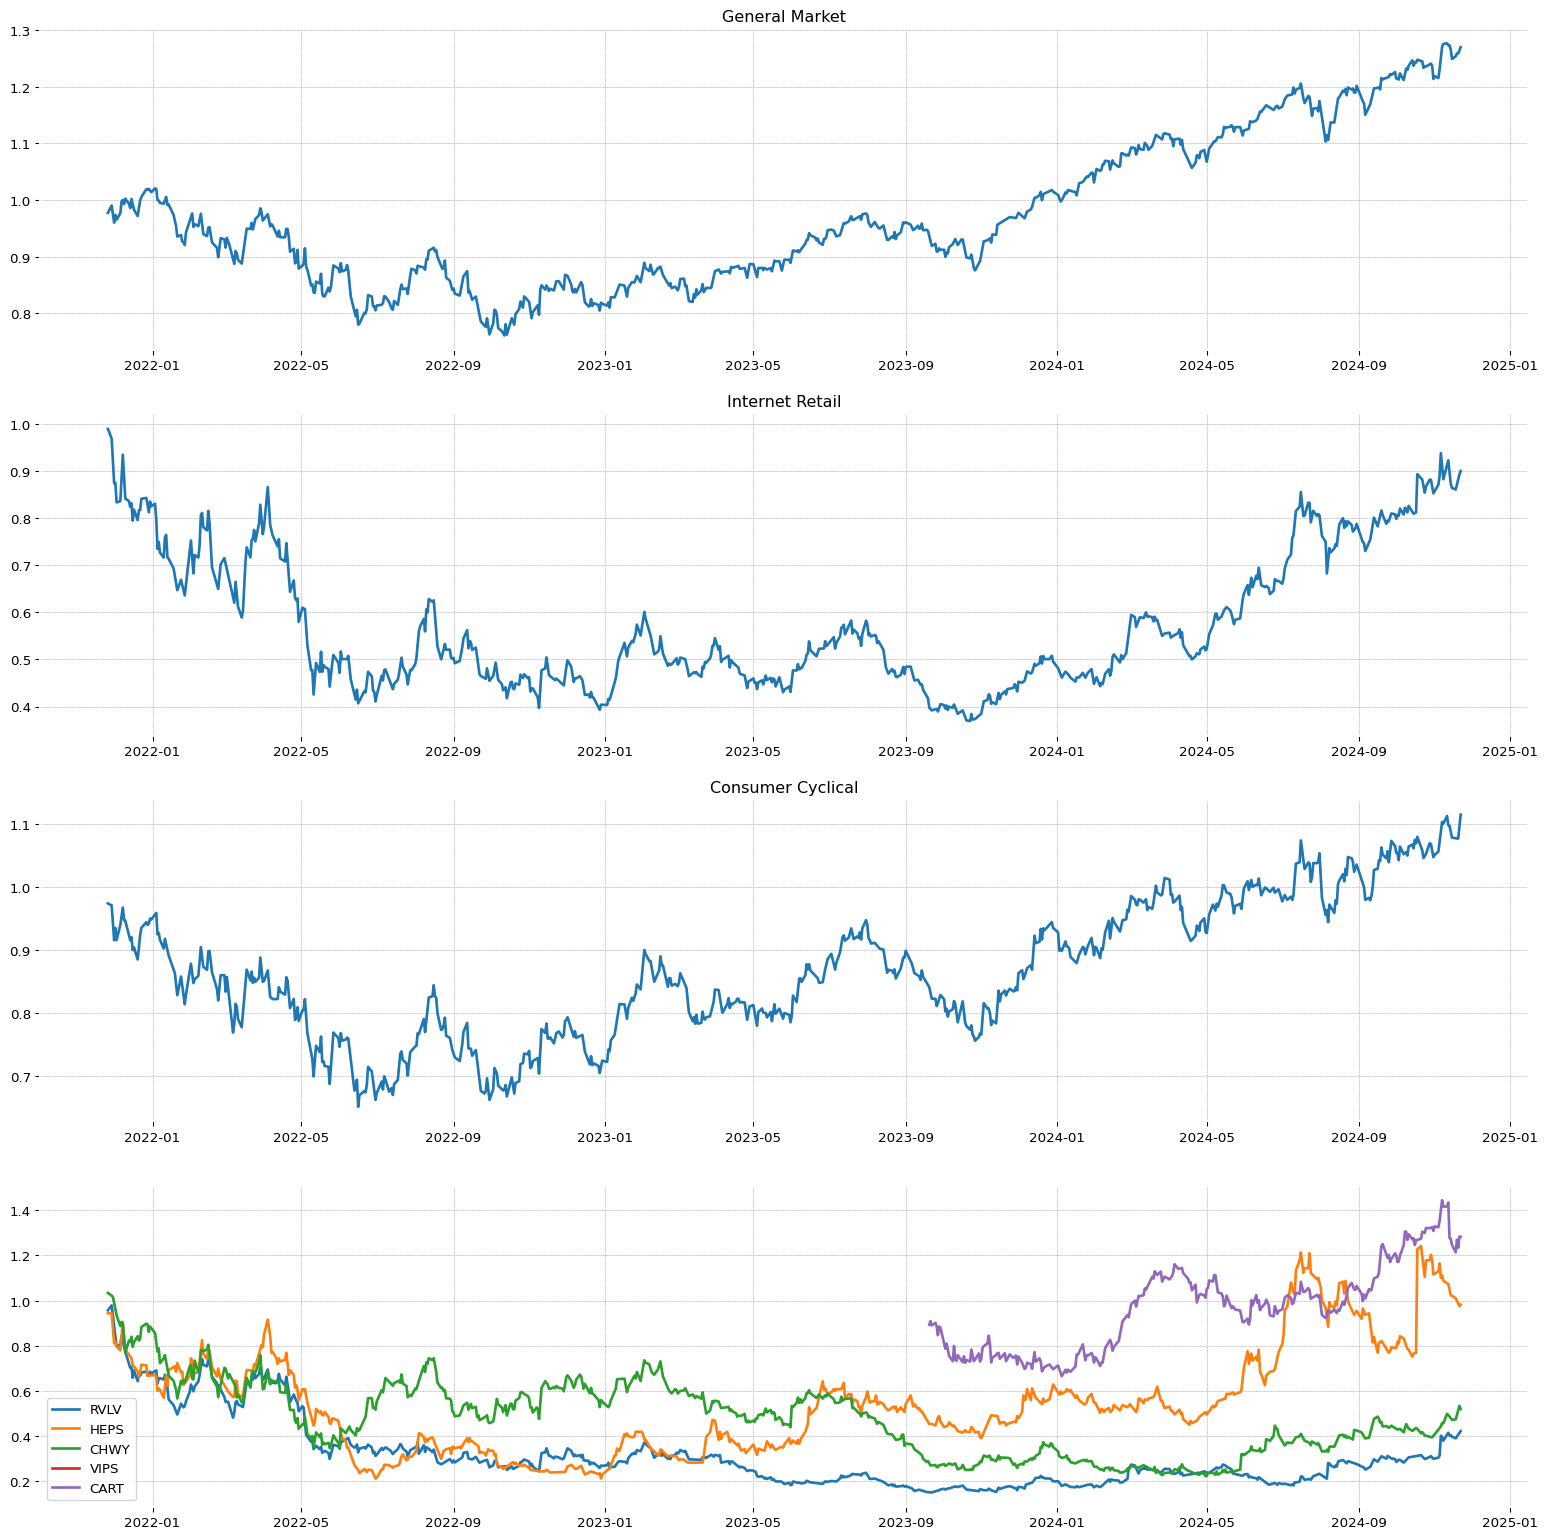
 RVLV
RVLV| SMR | EPS | RS | 33.49 | 30.55 | 93 |
| Sector | Sector Position |
| Consumer Cyclical | 3/11 |
| Industry | Industry Position - | Stock on industry - | RSI Sector: |
| Internet Retail | 59/147 | 2/20 | 19/346 |
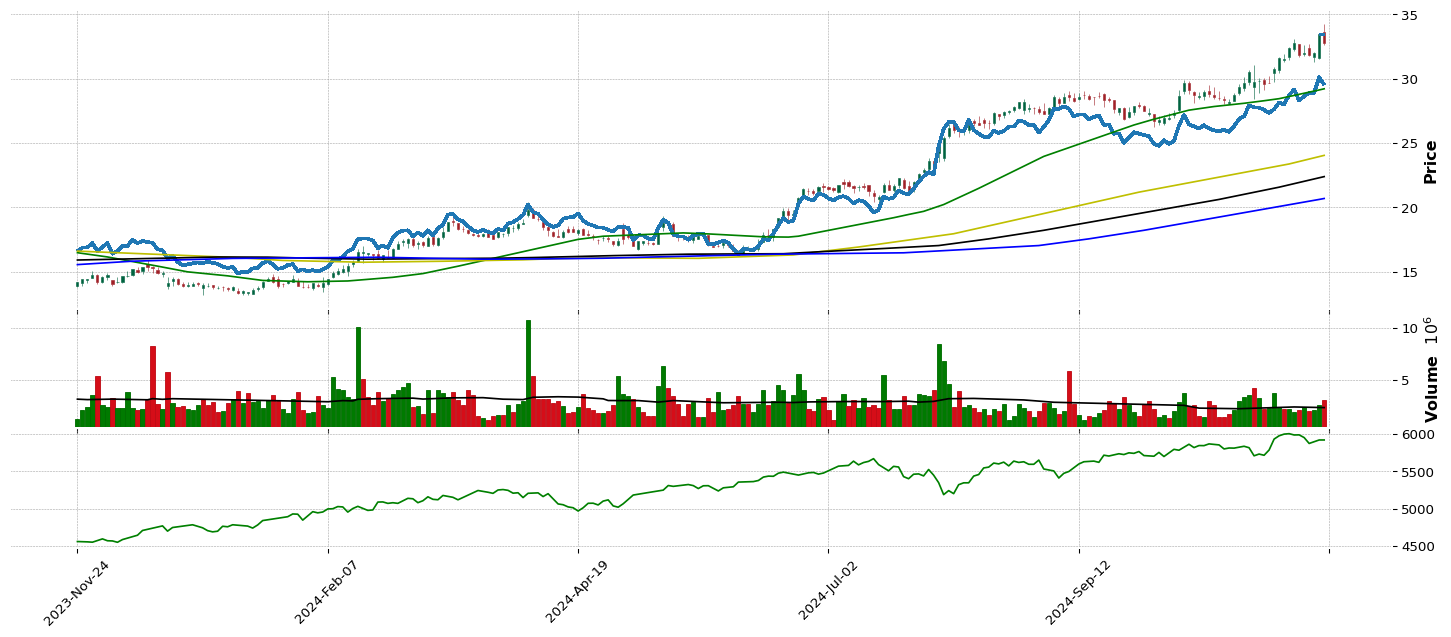
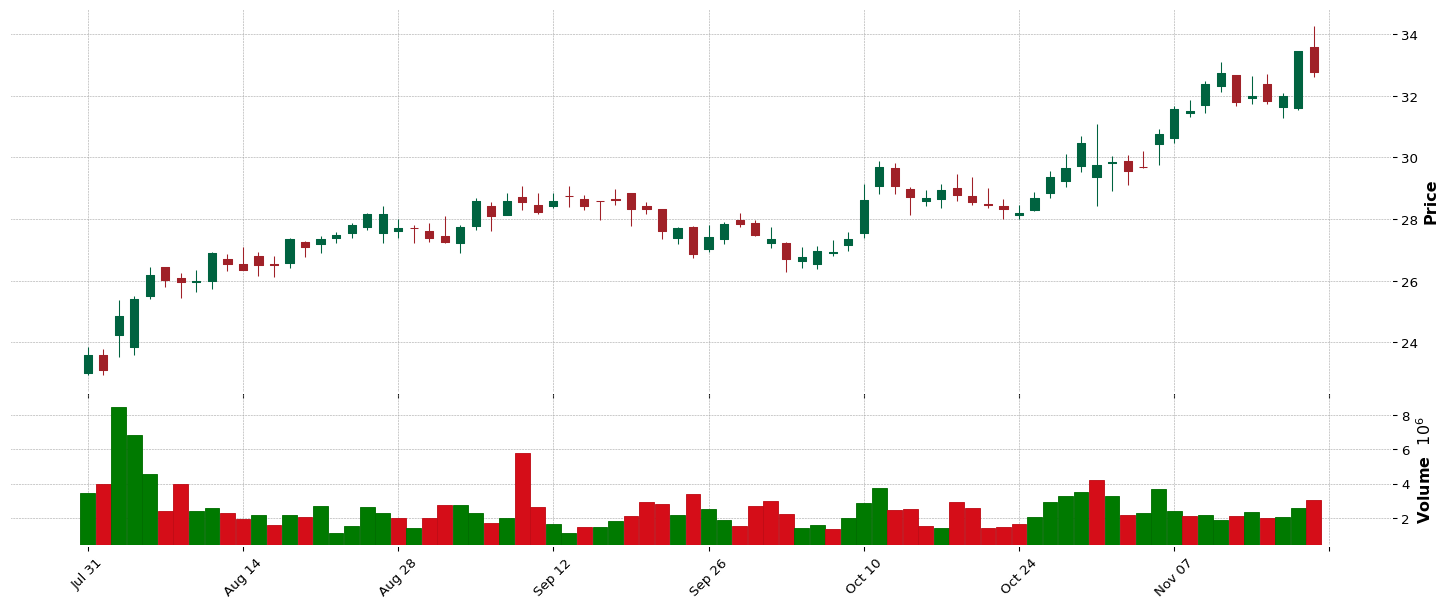
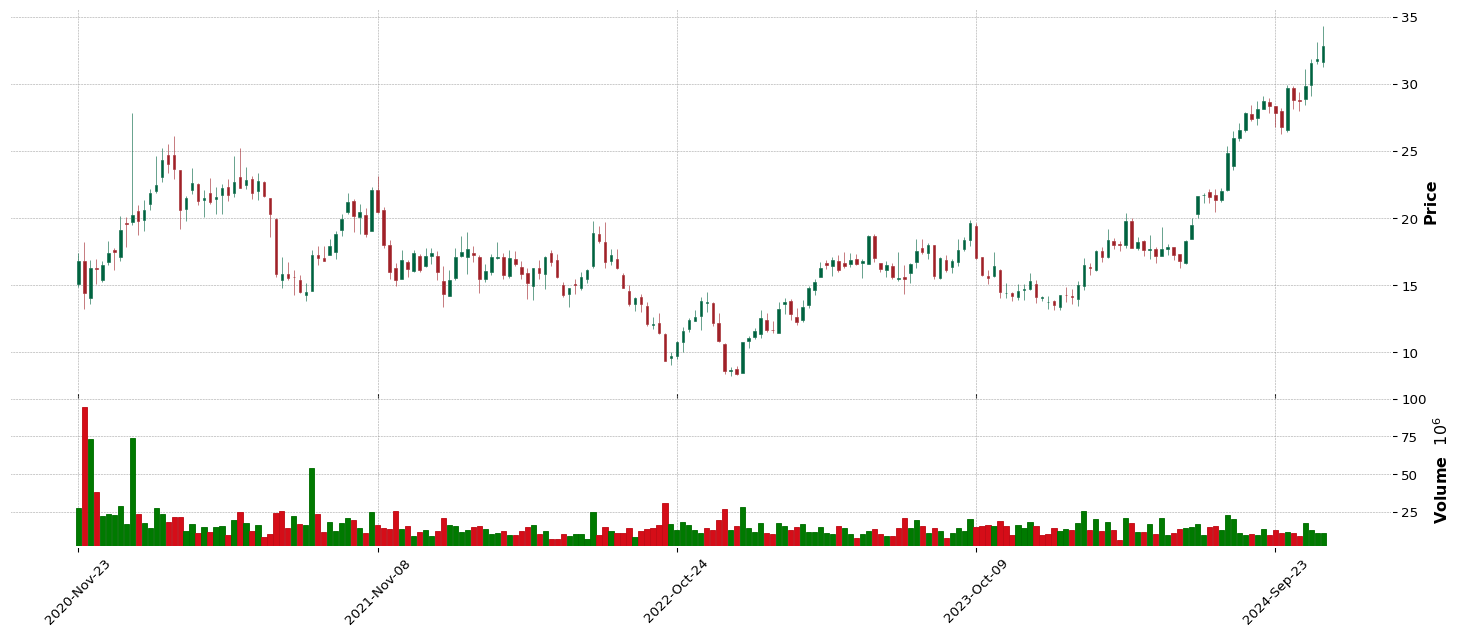
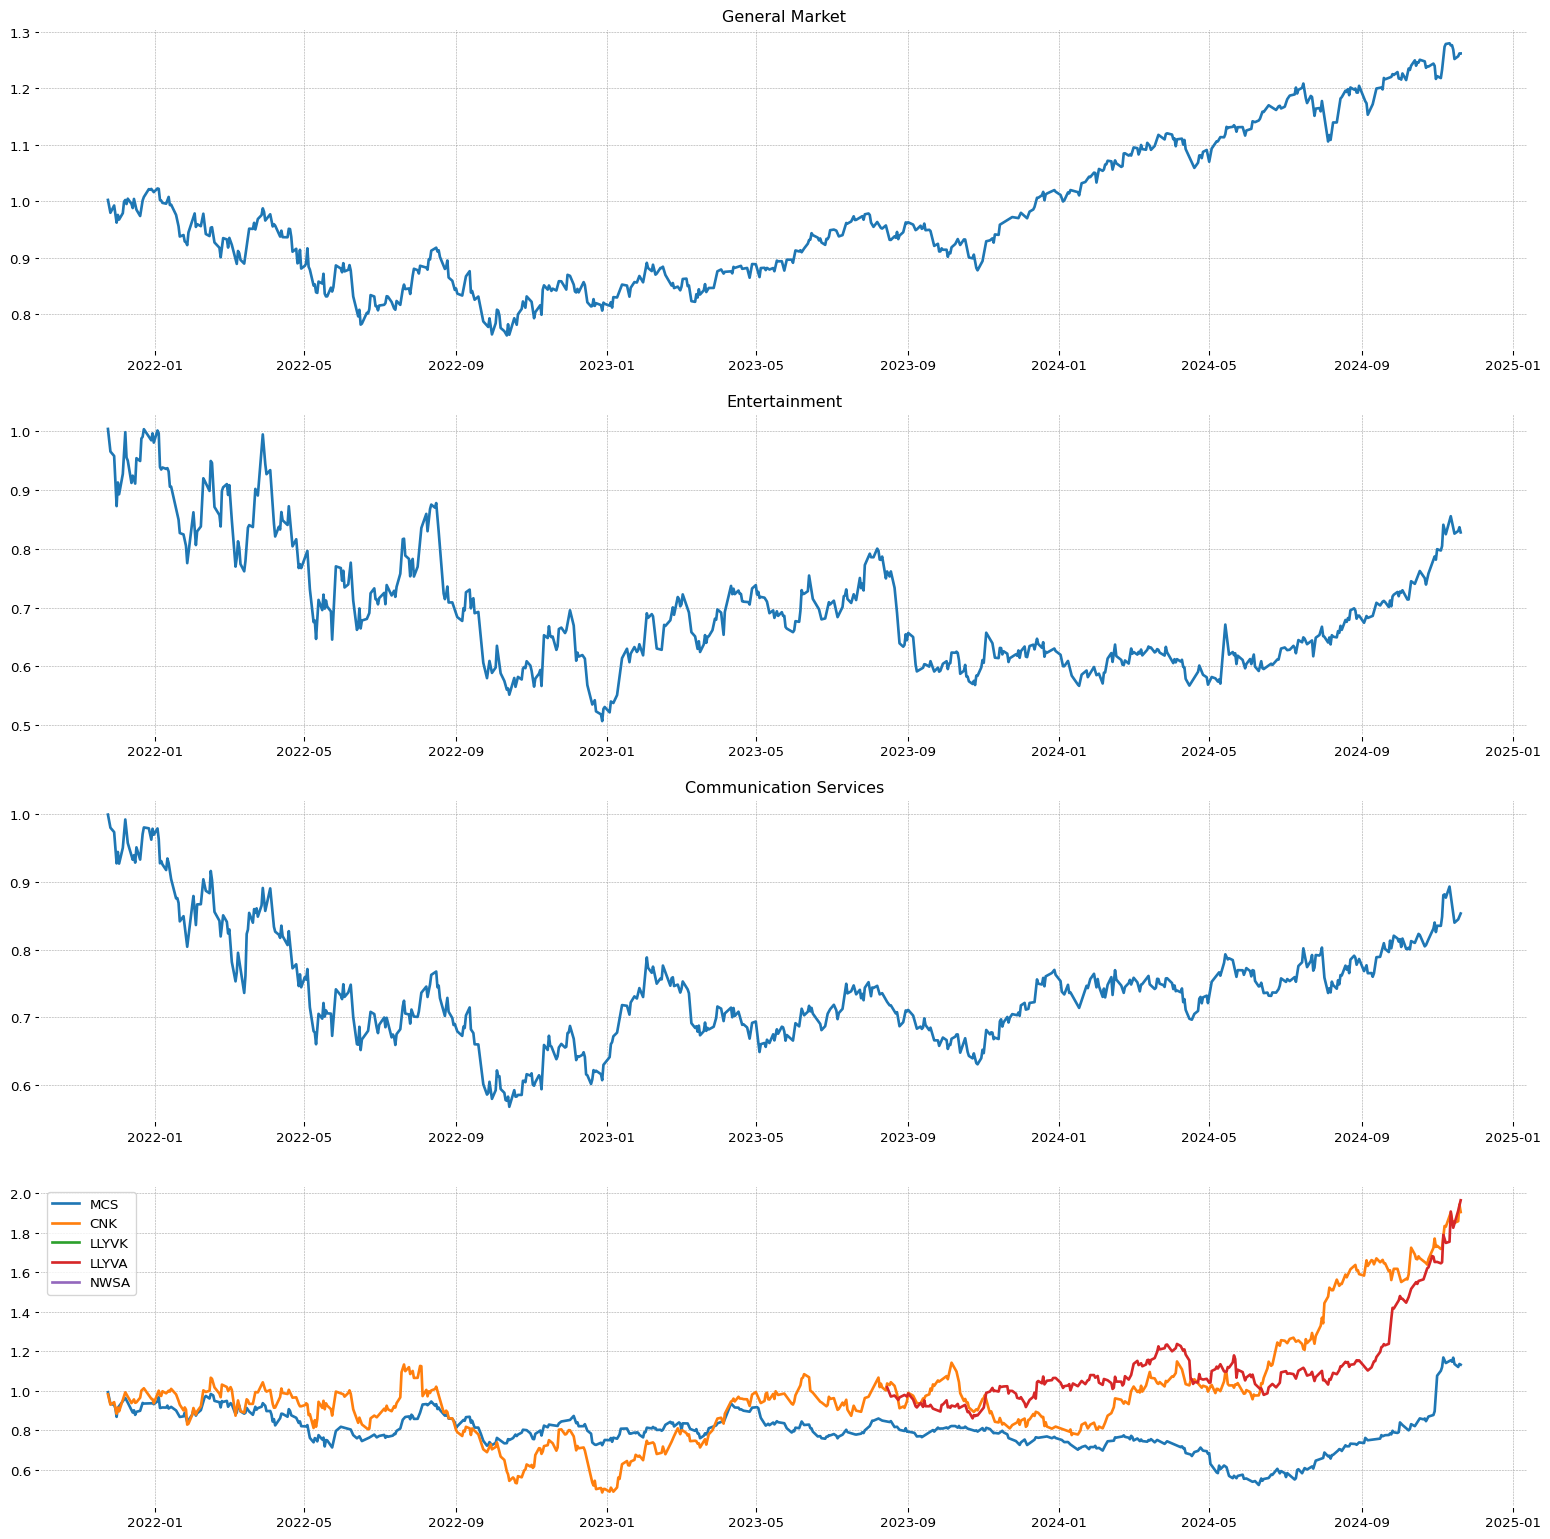
 CNK
CNK| SMR | EPS | RS | 42.38 | 90.47 | 94 |
| Sector | Sector Position |
| Communication Services | 9/11 |
| Industry | Industry Position - | Stock on industry - | RSI Sector: |
| Entertainment | 43/147 | 1/31 | 3/146 |
 QFIN
QFIN| SMR | EPS | RS | 26.72 | 48.65 | 96 |
| Sector | Sector Position |
| Industrials | 4/11 |
| Industry | Industry Position - | Stock on industry - | RSI Sector: |
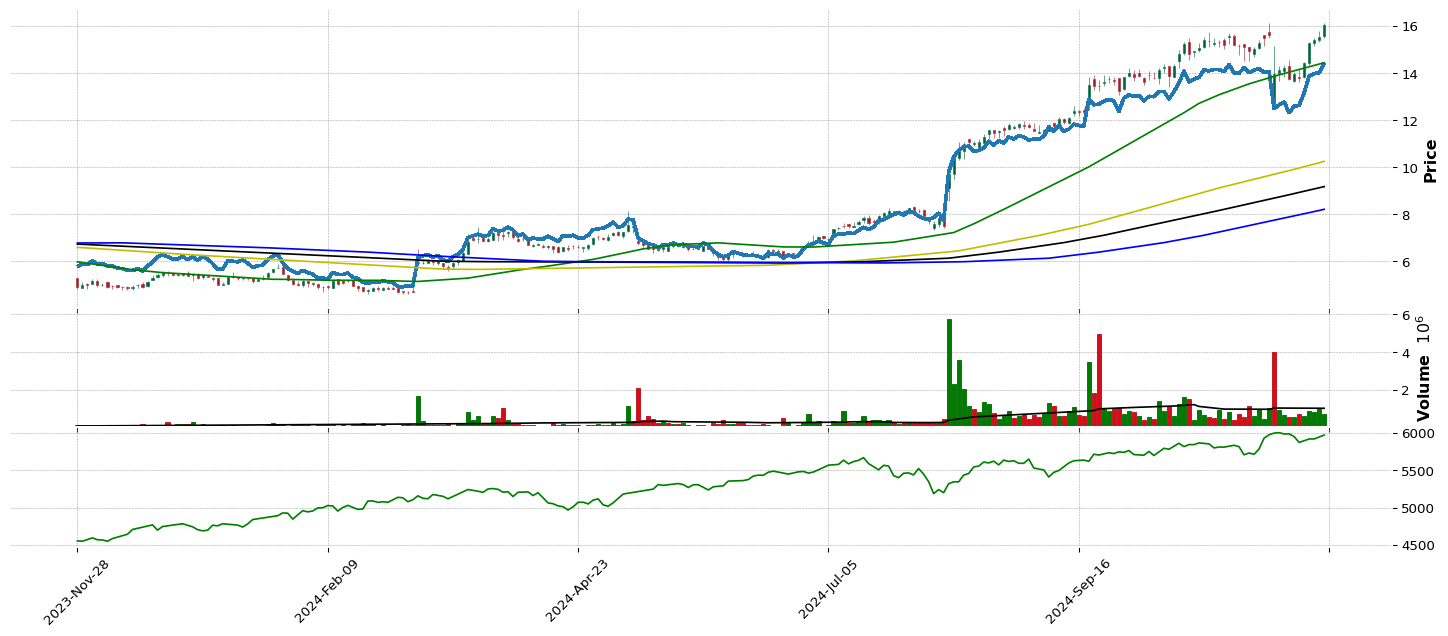
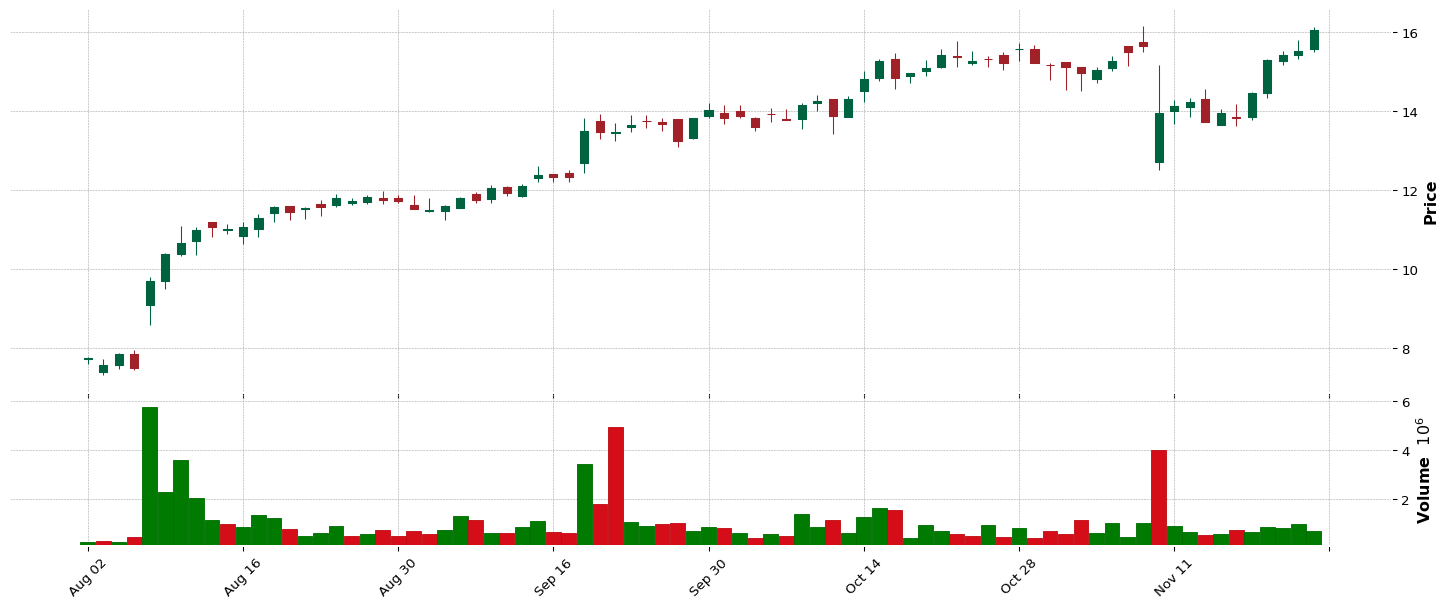
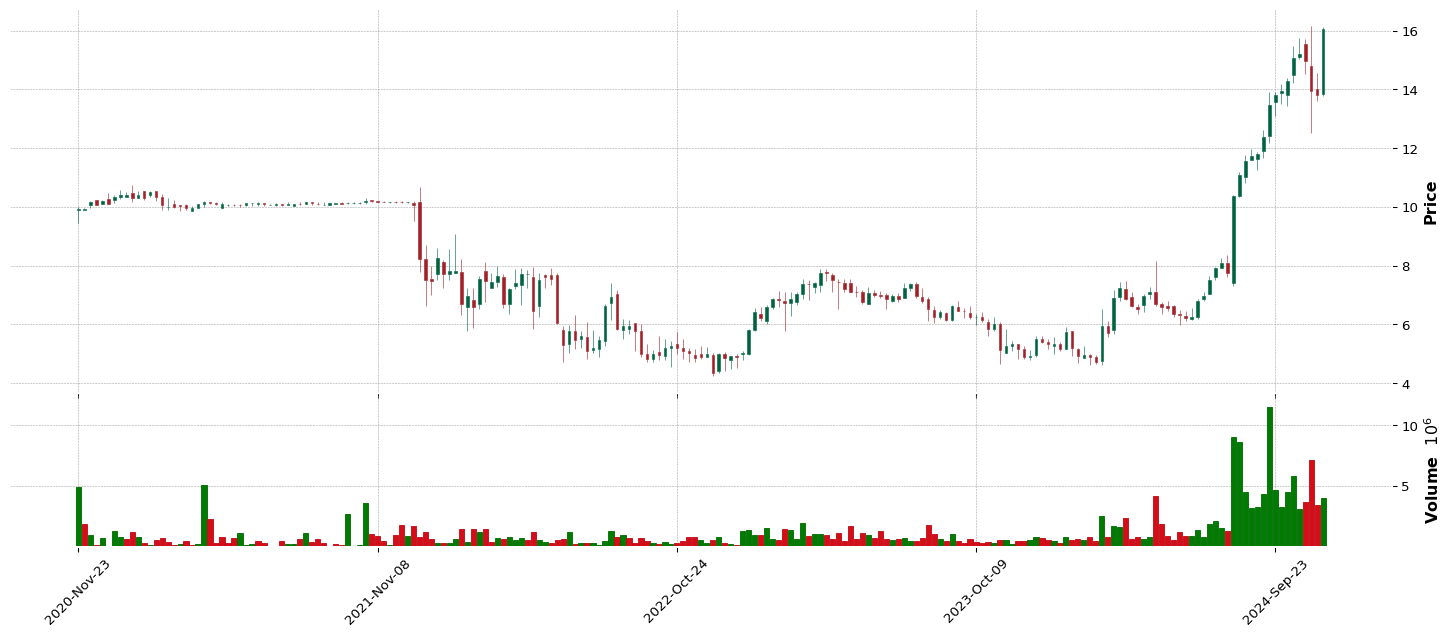
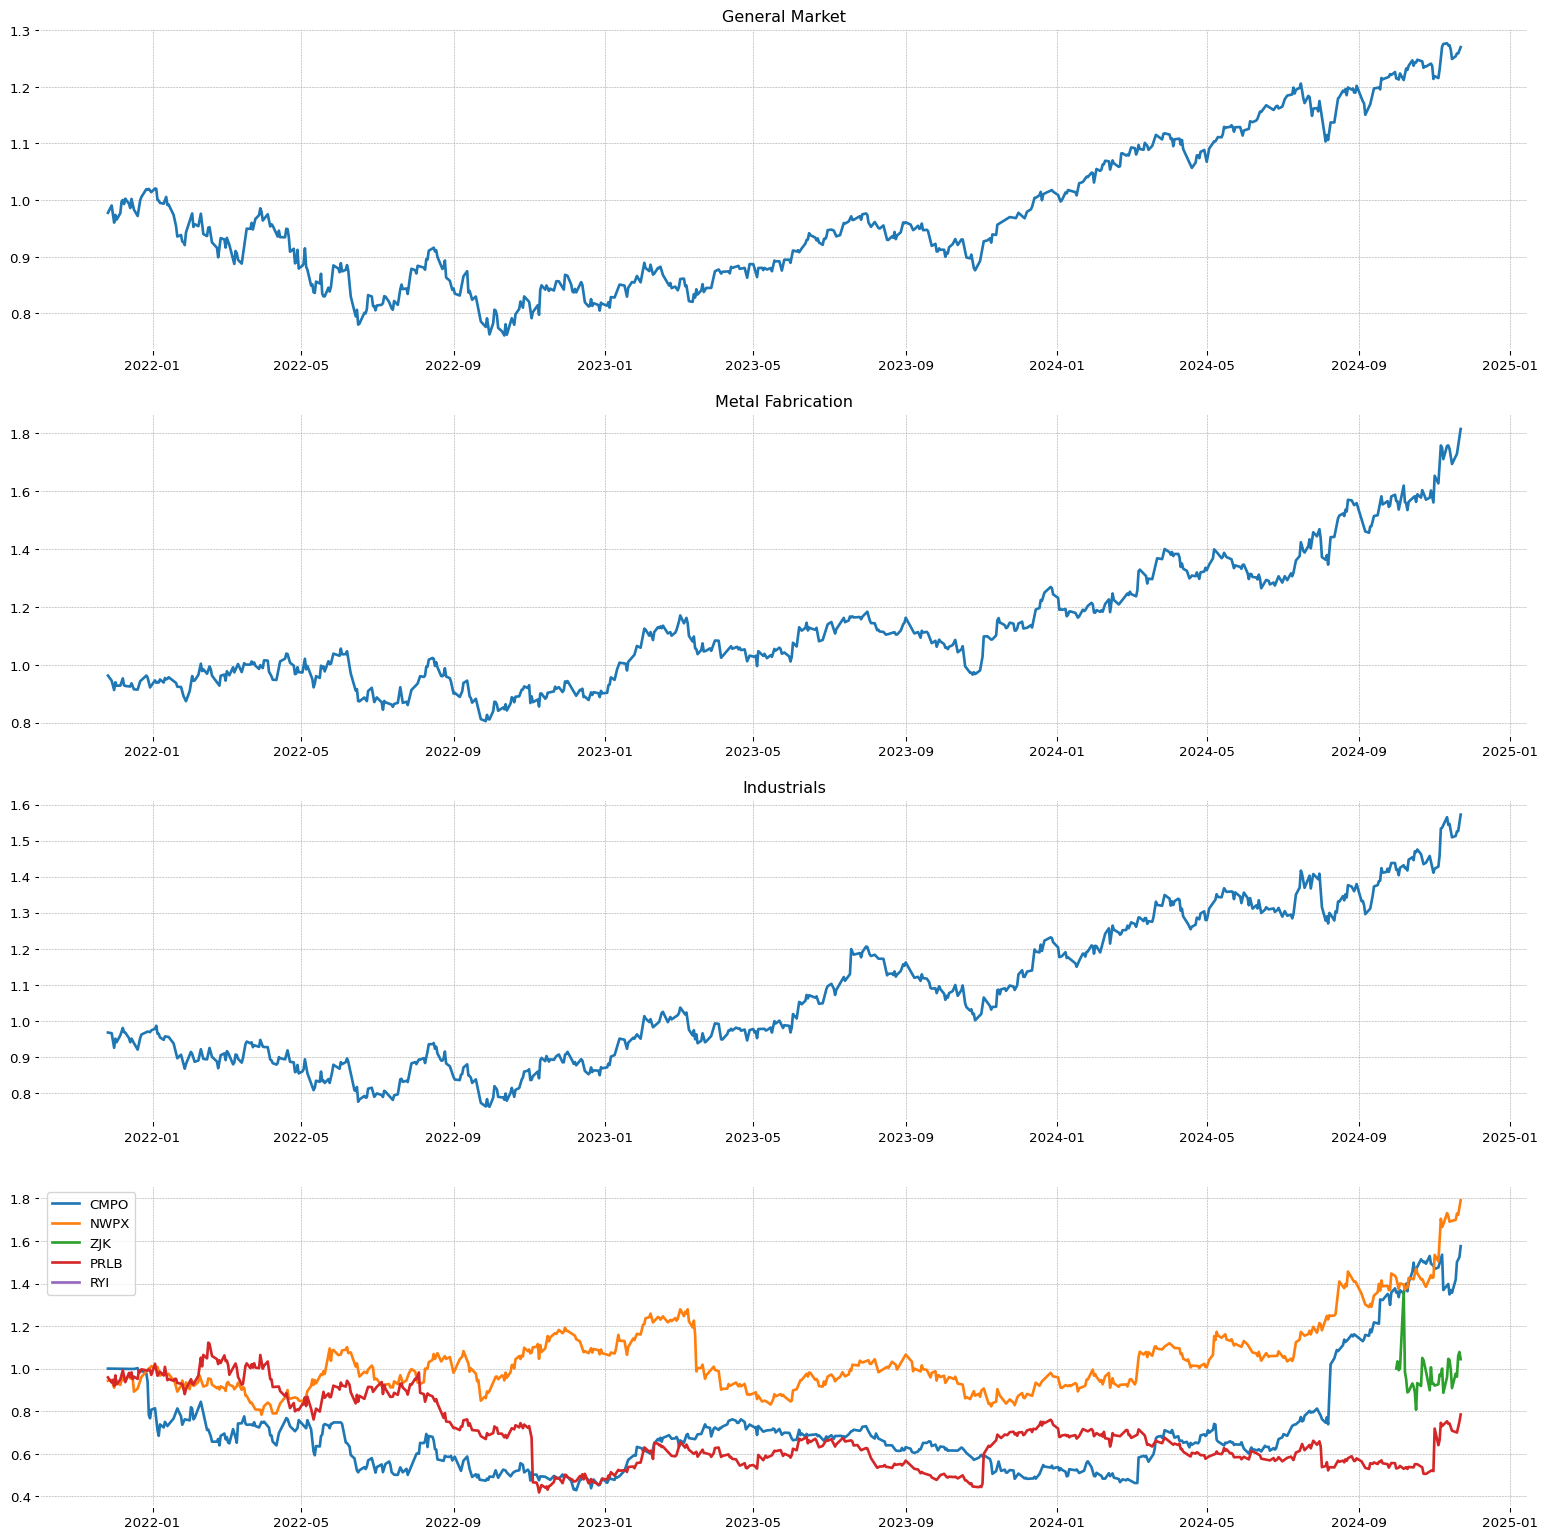
| Metal Fabrication | 34/147 | 1/13 | 13/412 |
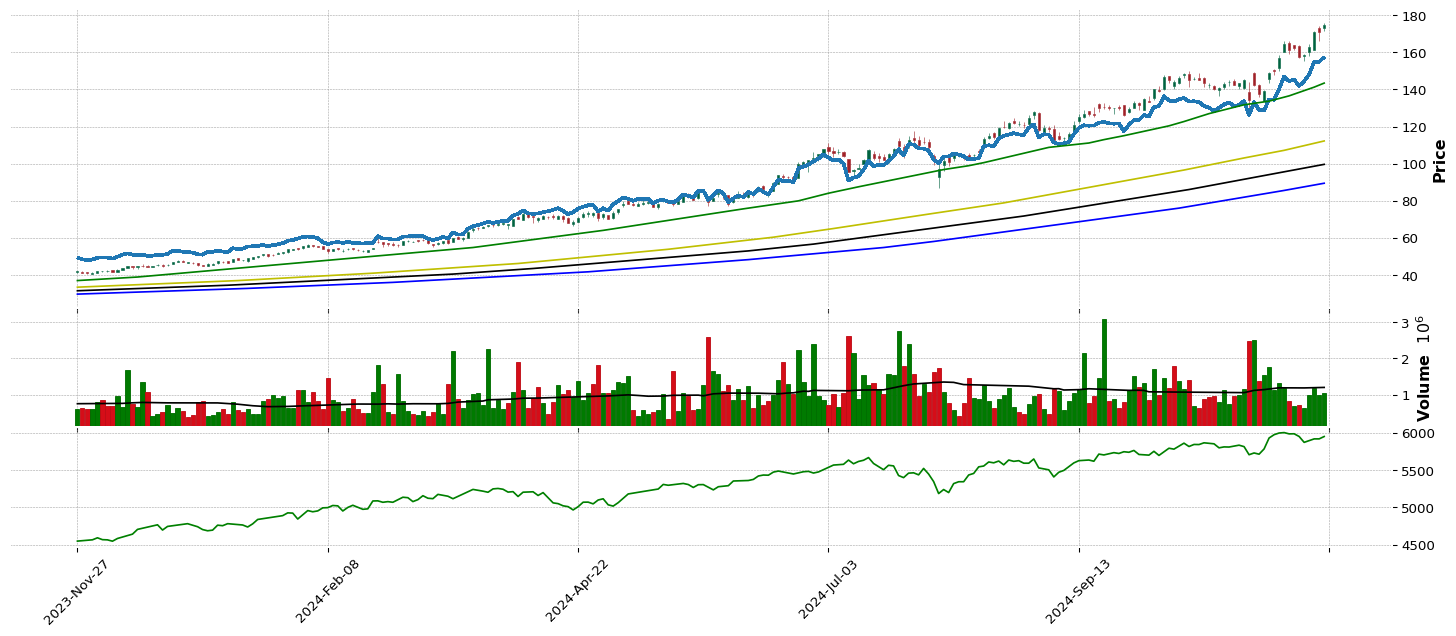
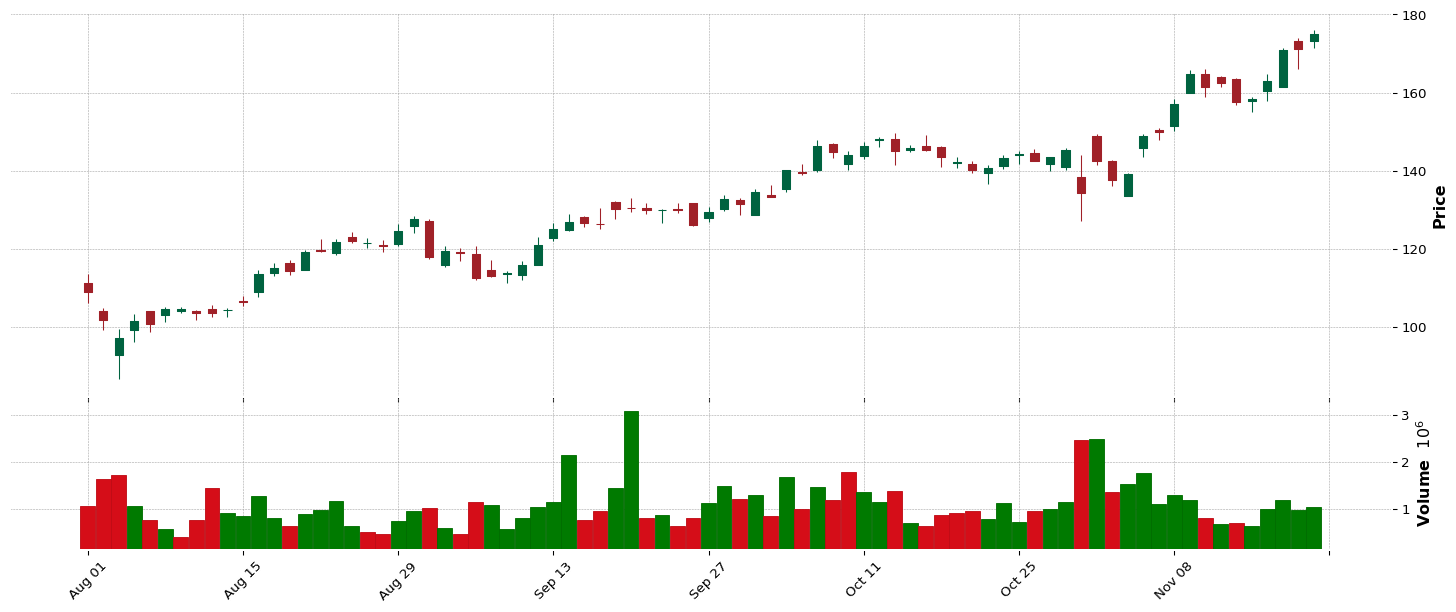
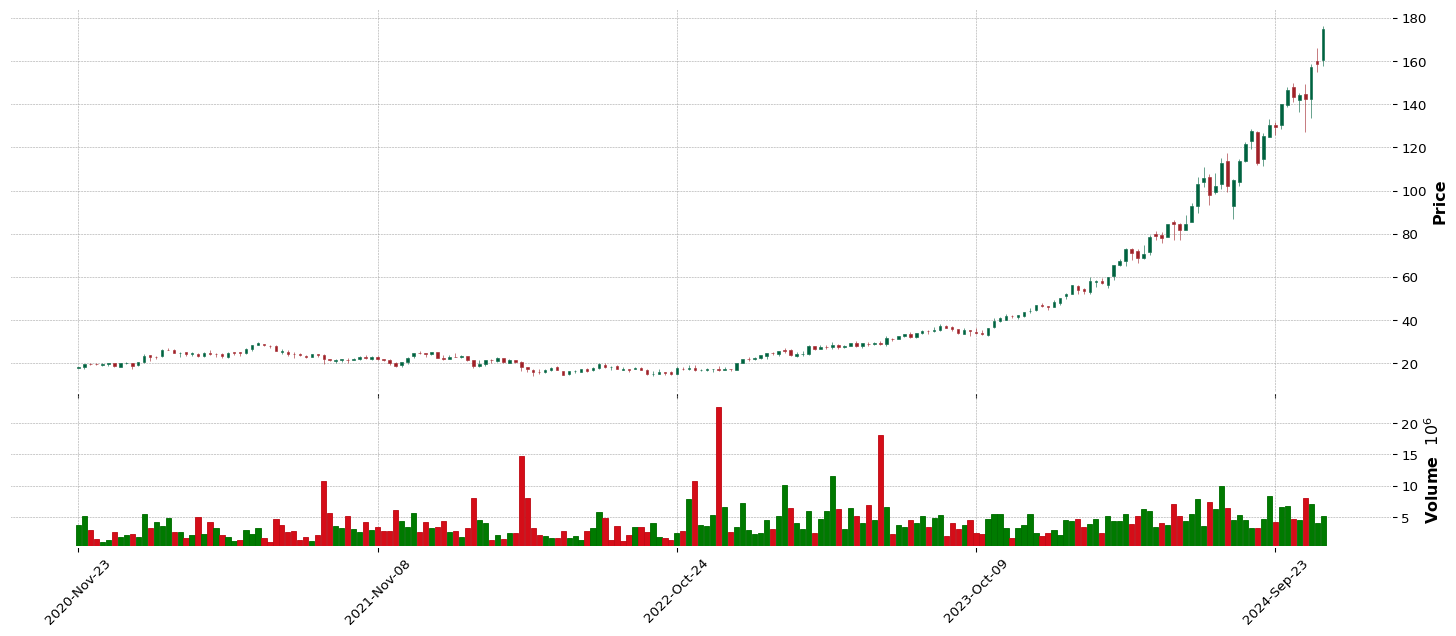
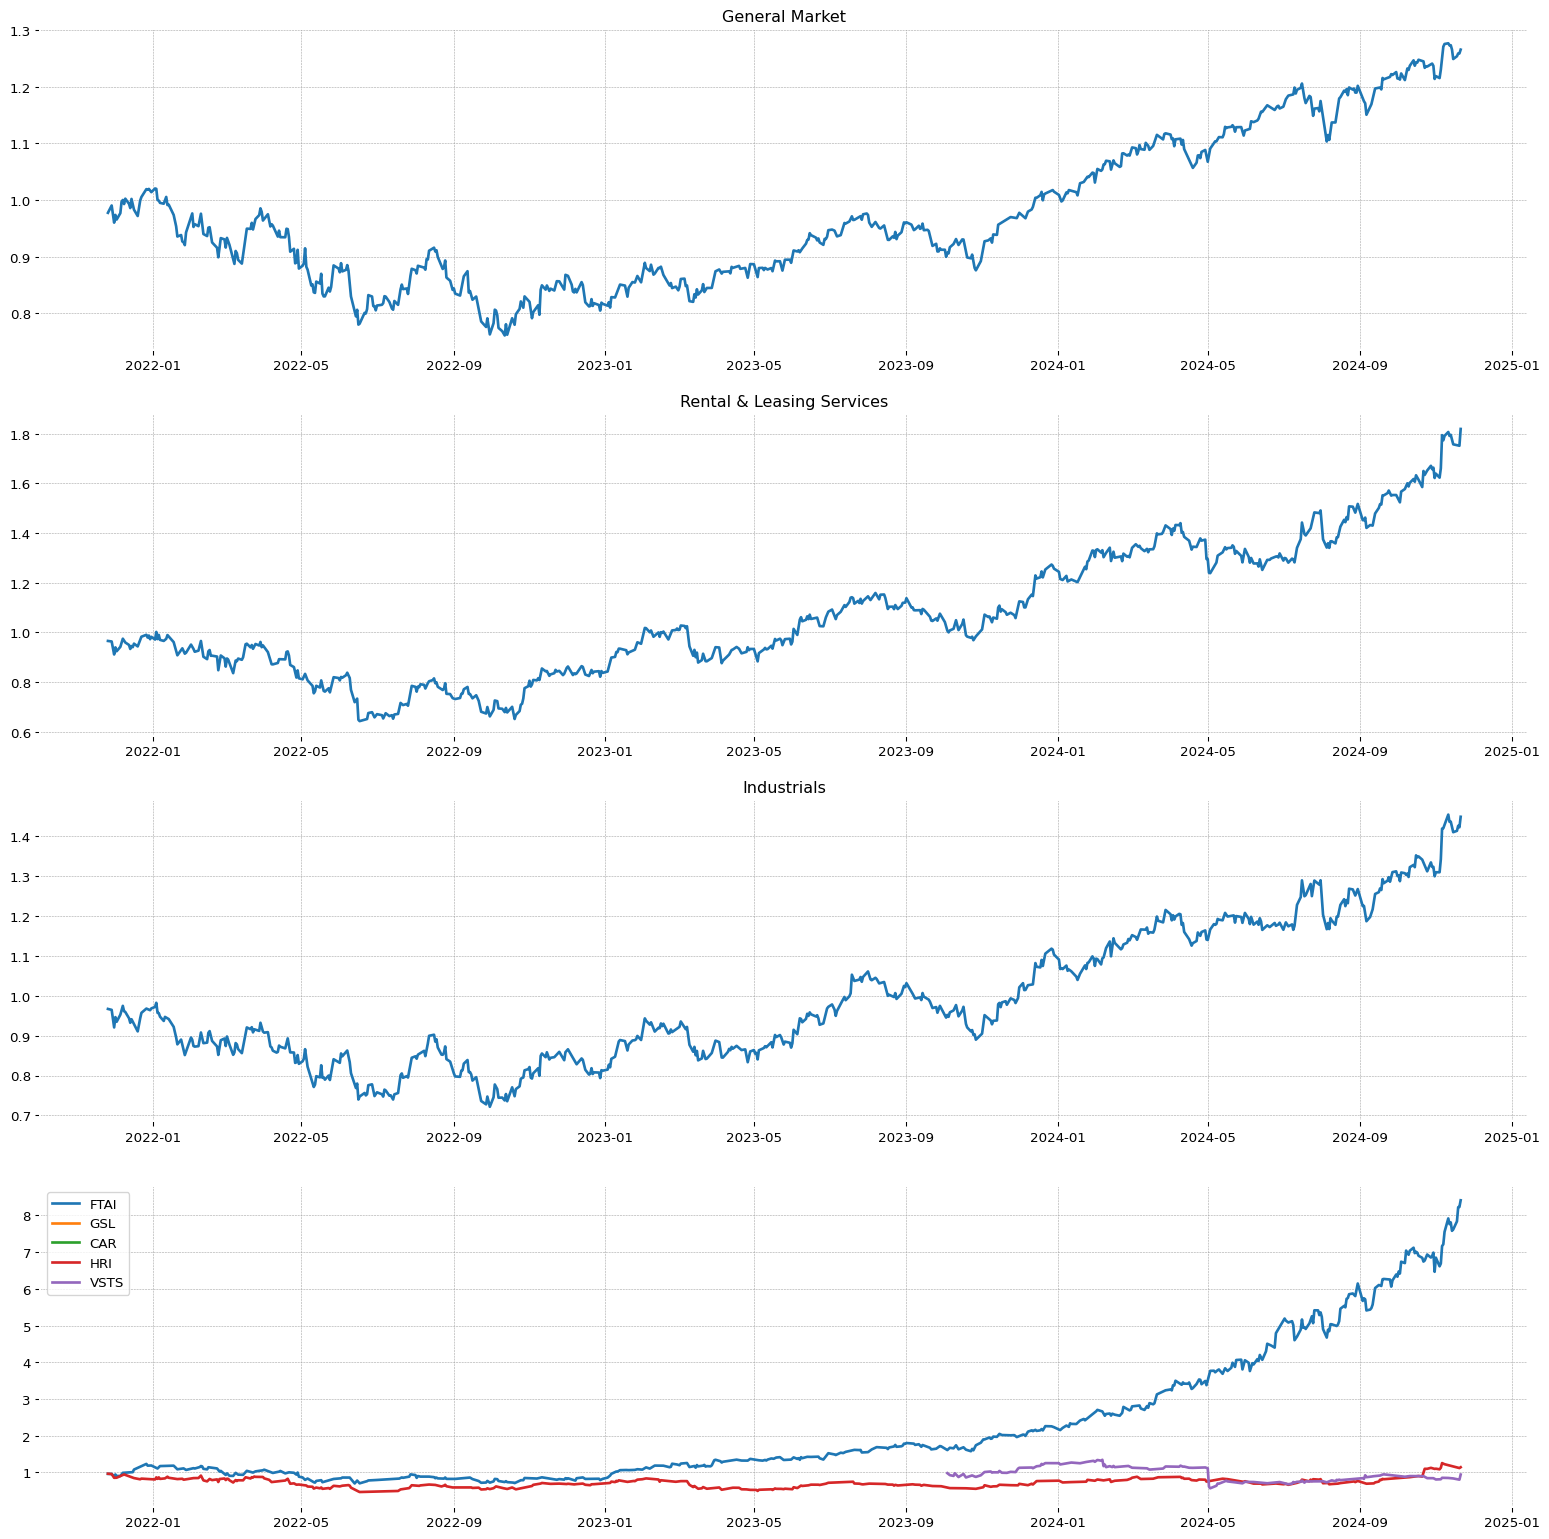
 FTAI
FTAI| SMR | EPS | RS | 0.0 | 0.0 | 98 |
| Sector | Sector Position |
| Industrials | 4/11 |
| Industry | Industry Position - | Stock on industry - | RSI Sector: |
| Rental & Leasing Services | 16/147 | 1/17 | 18/412 |
 LAZ
LAZ| SMR | EPS | RS | 0.0 | 0.0 | 90 |
| Sector | Sector Position |
| Communication Services | 9/11 |
| Industry | Industry Position - | Stock on industry - | RSI Sector: |
| Entertainment | 43/147 | 2/31 | 4/146 |
 SPXC
SPXC| SMR | EPS | RS | 89.25 | 51.96 | 90 |
| Sector | Sector Position |
| Industrials | 4/11 |
| Industry | Industry Position - | Stock on industry - | RSI Sector: |
| Building Products & Equipment | 110/147 | 2/27 | 146/412 |
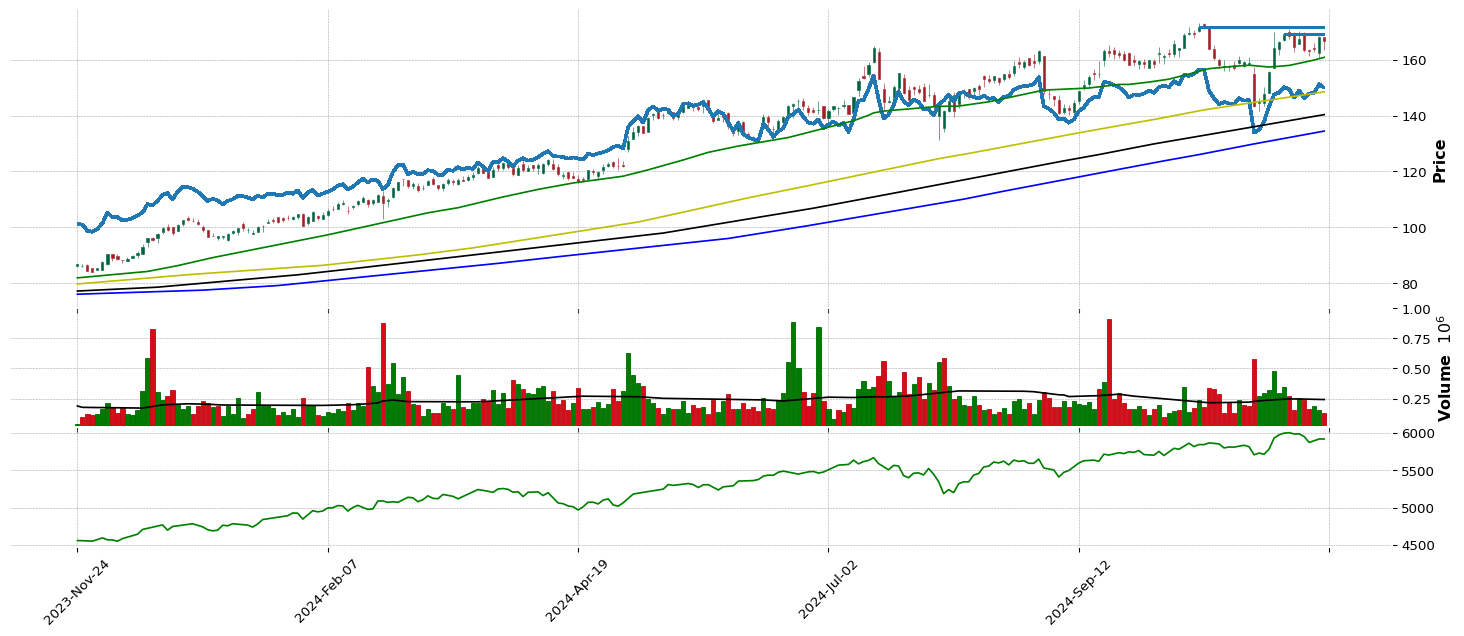
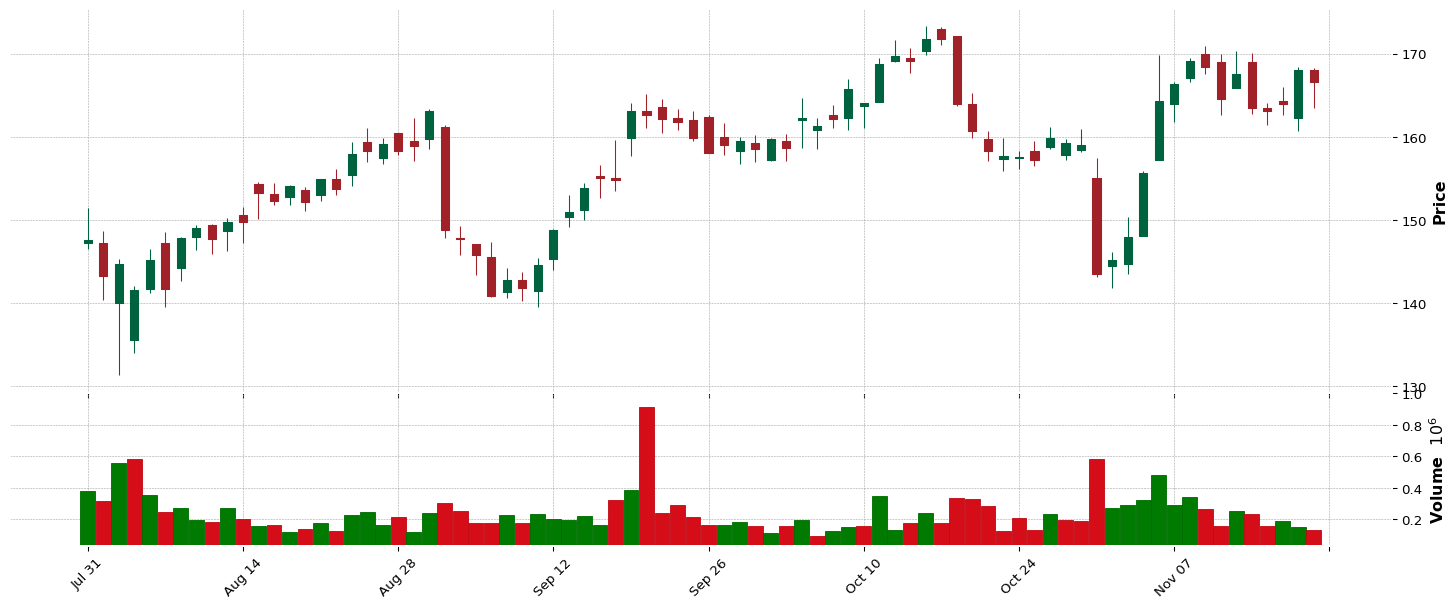
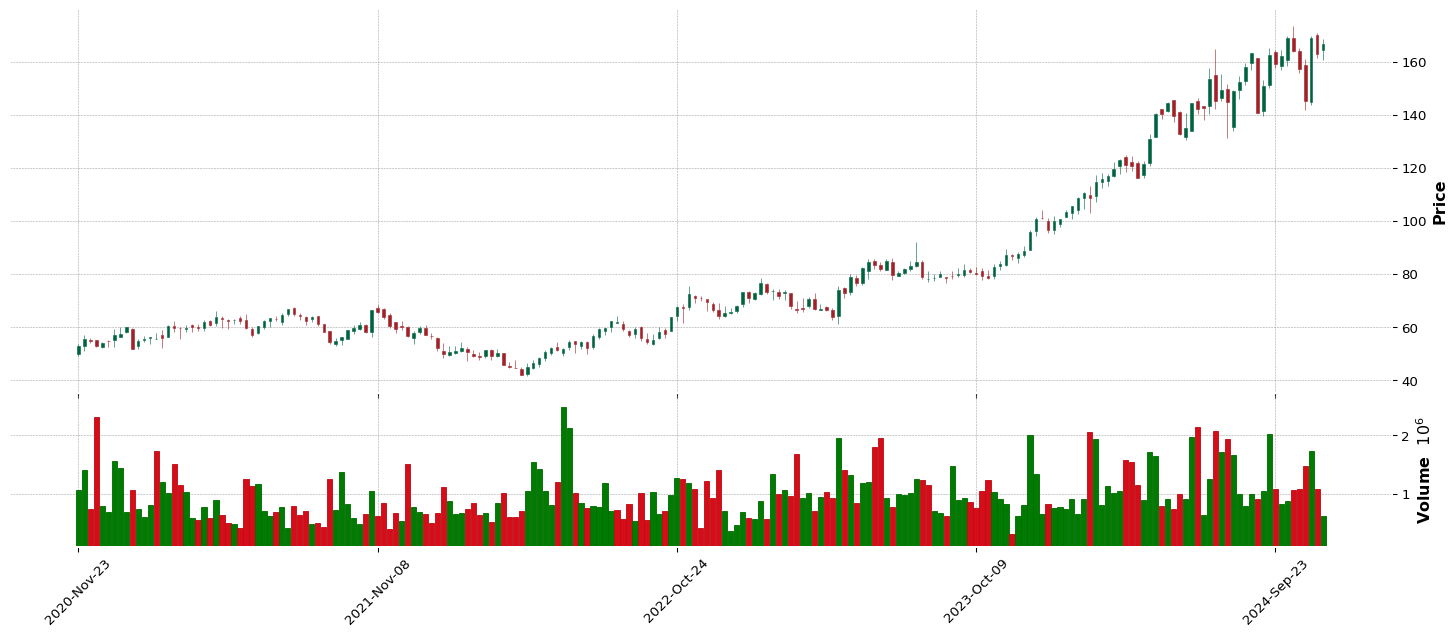
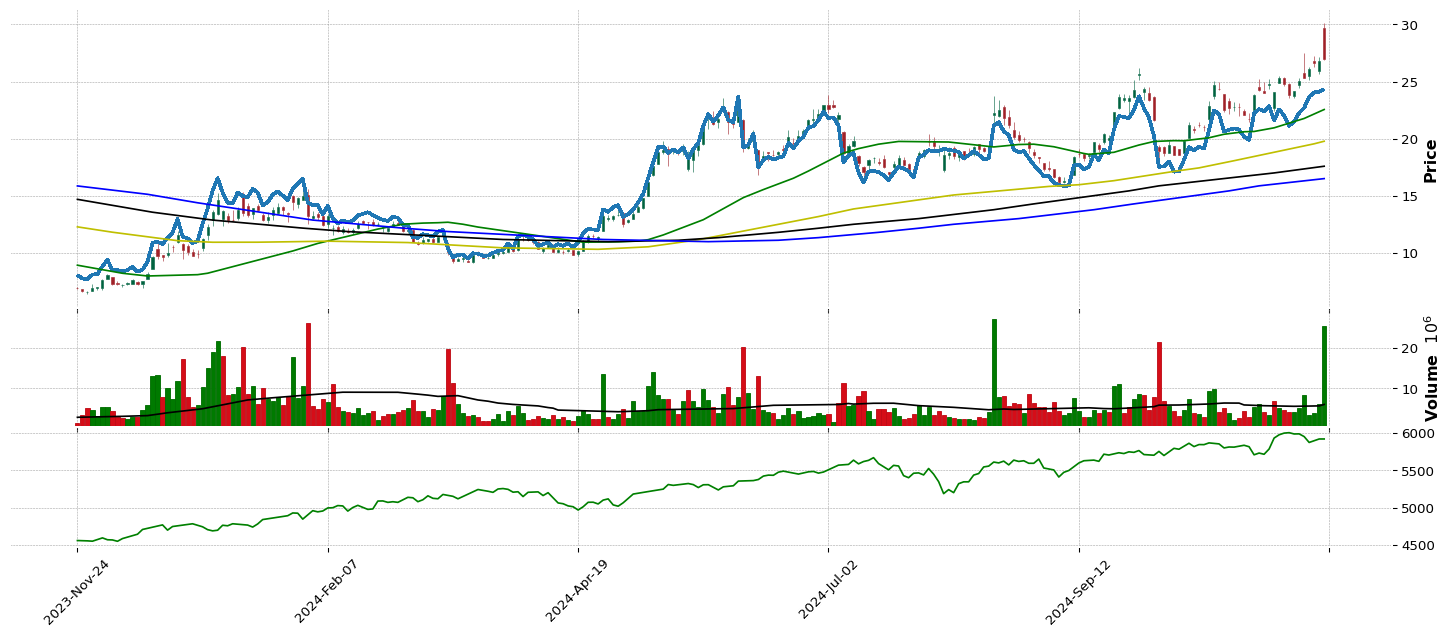
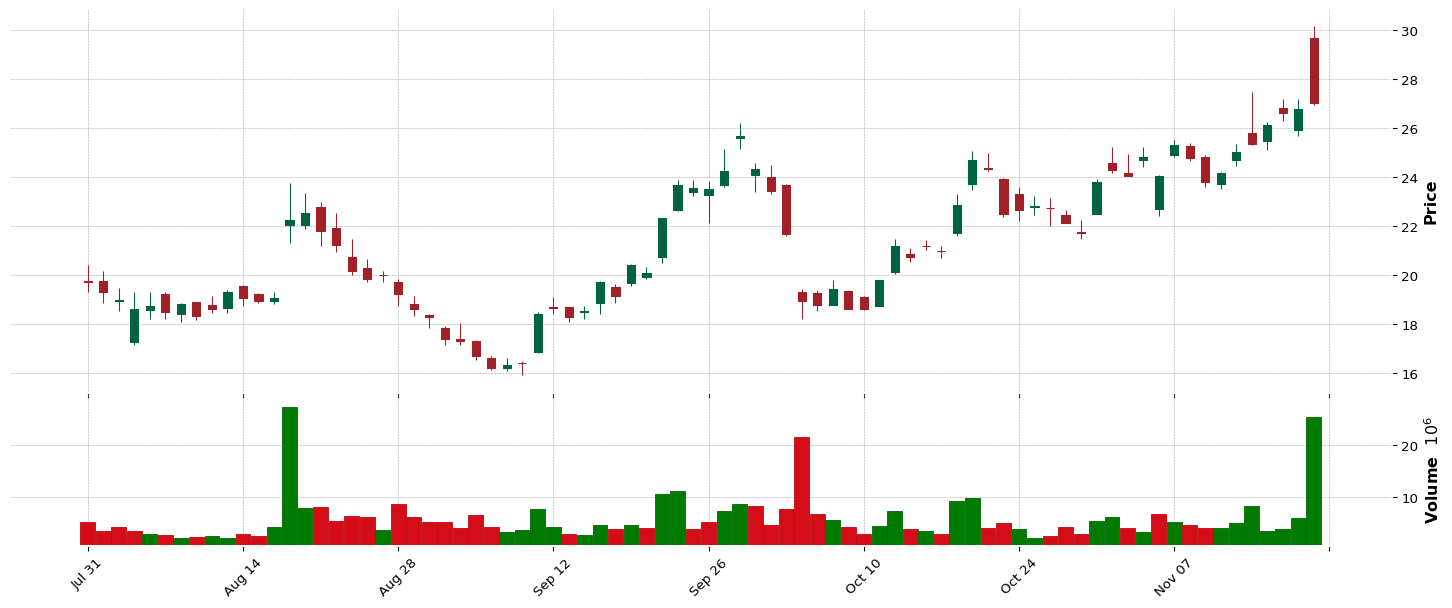
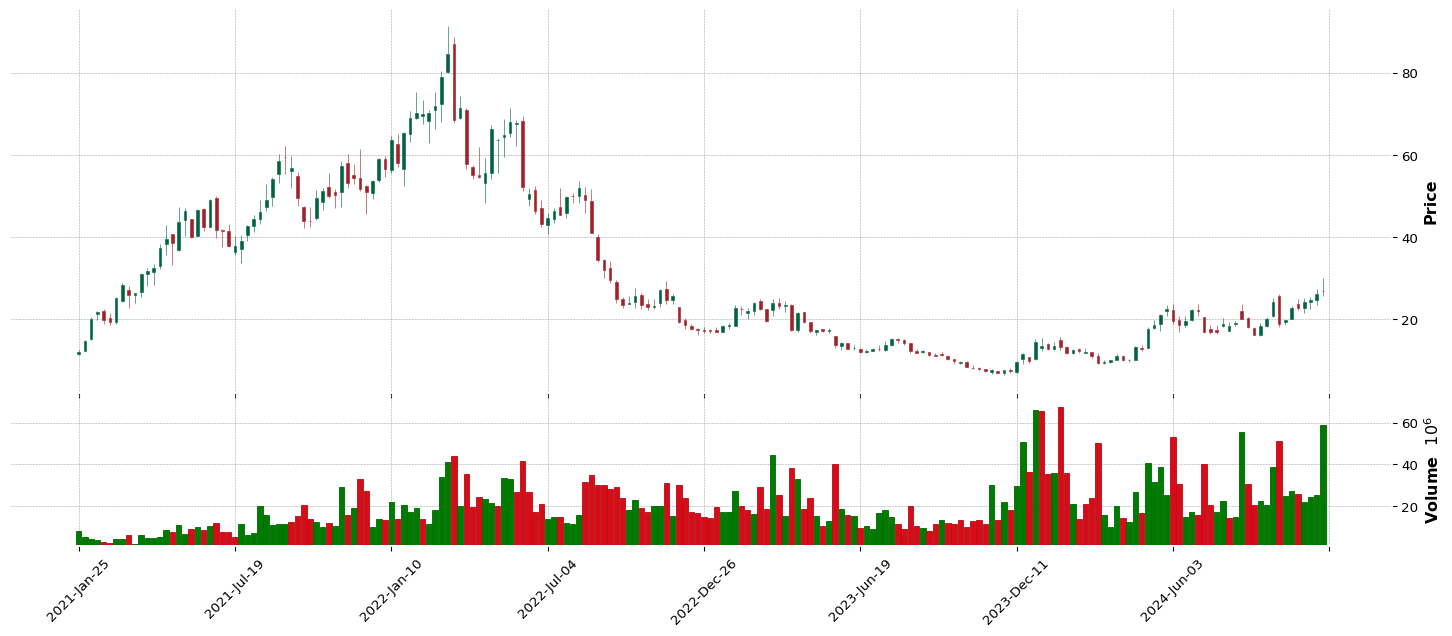
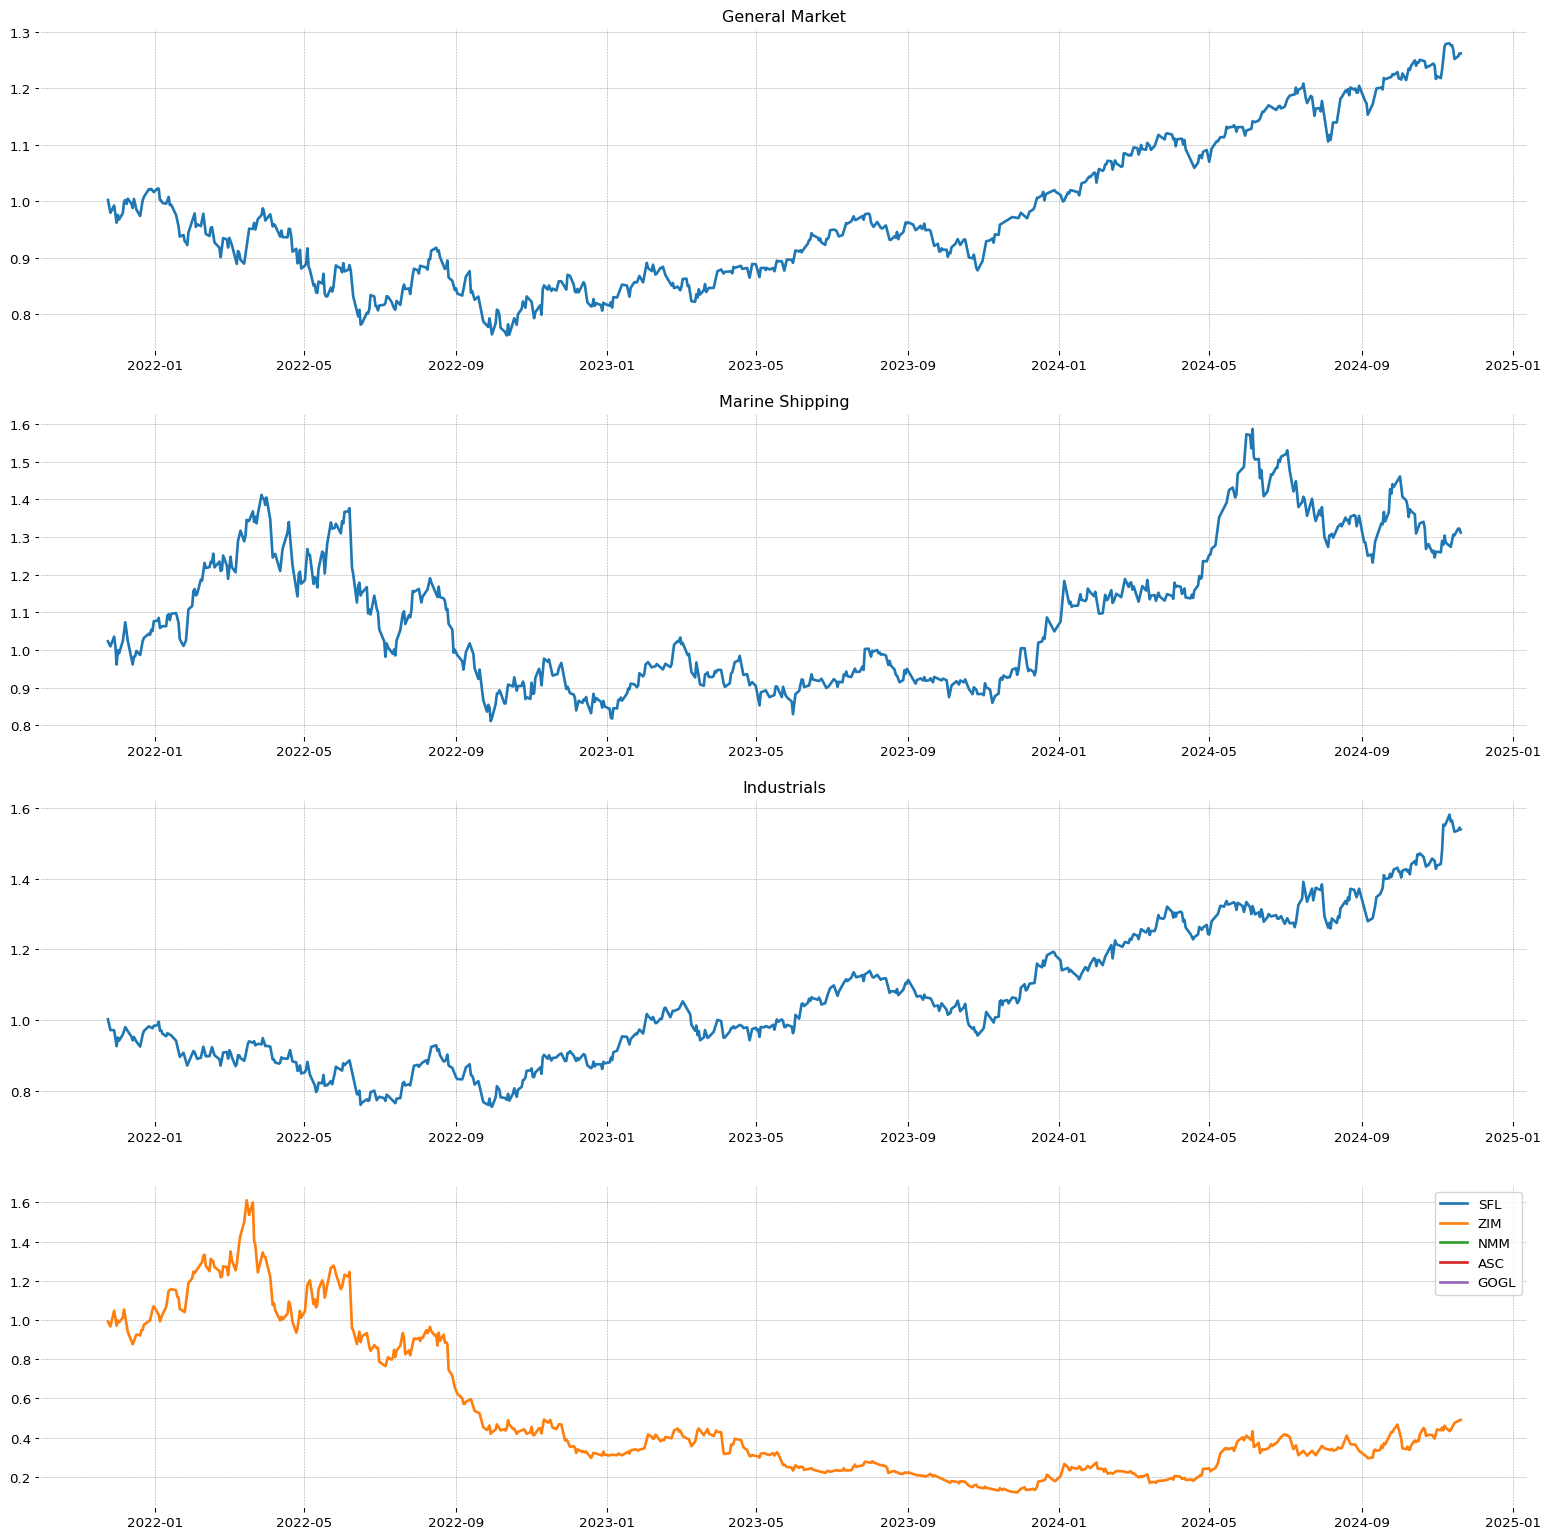
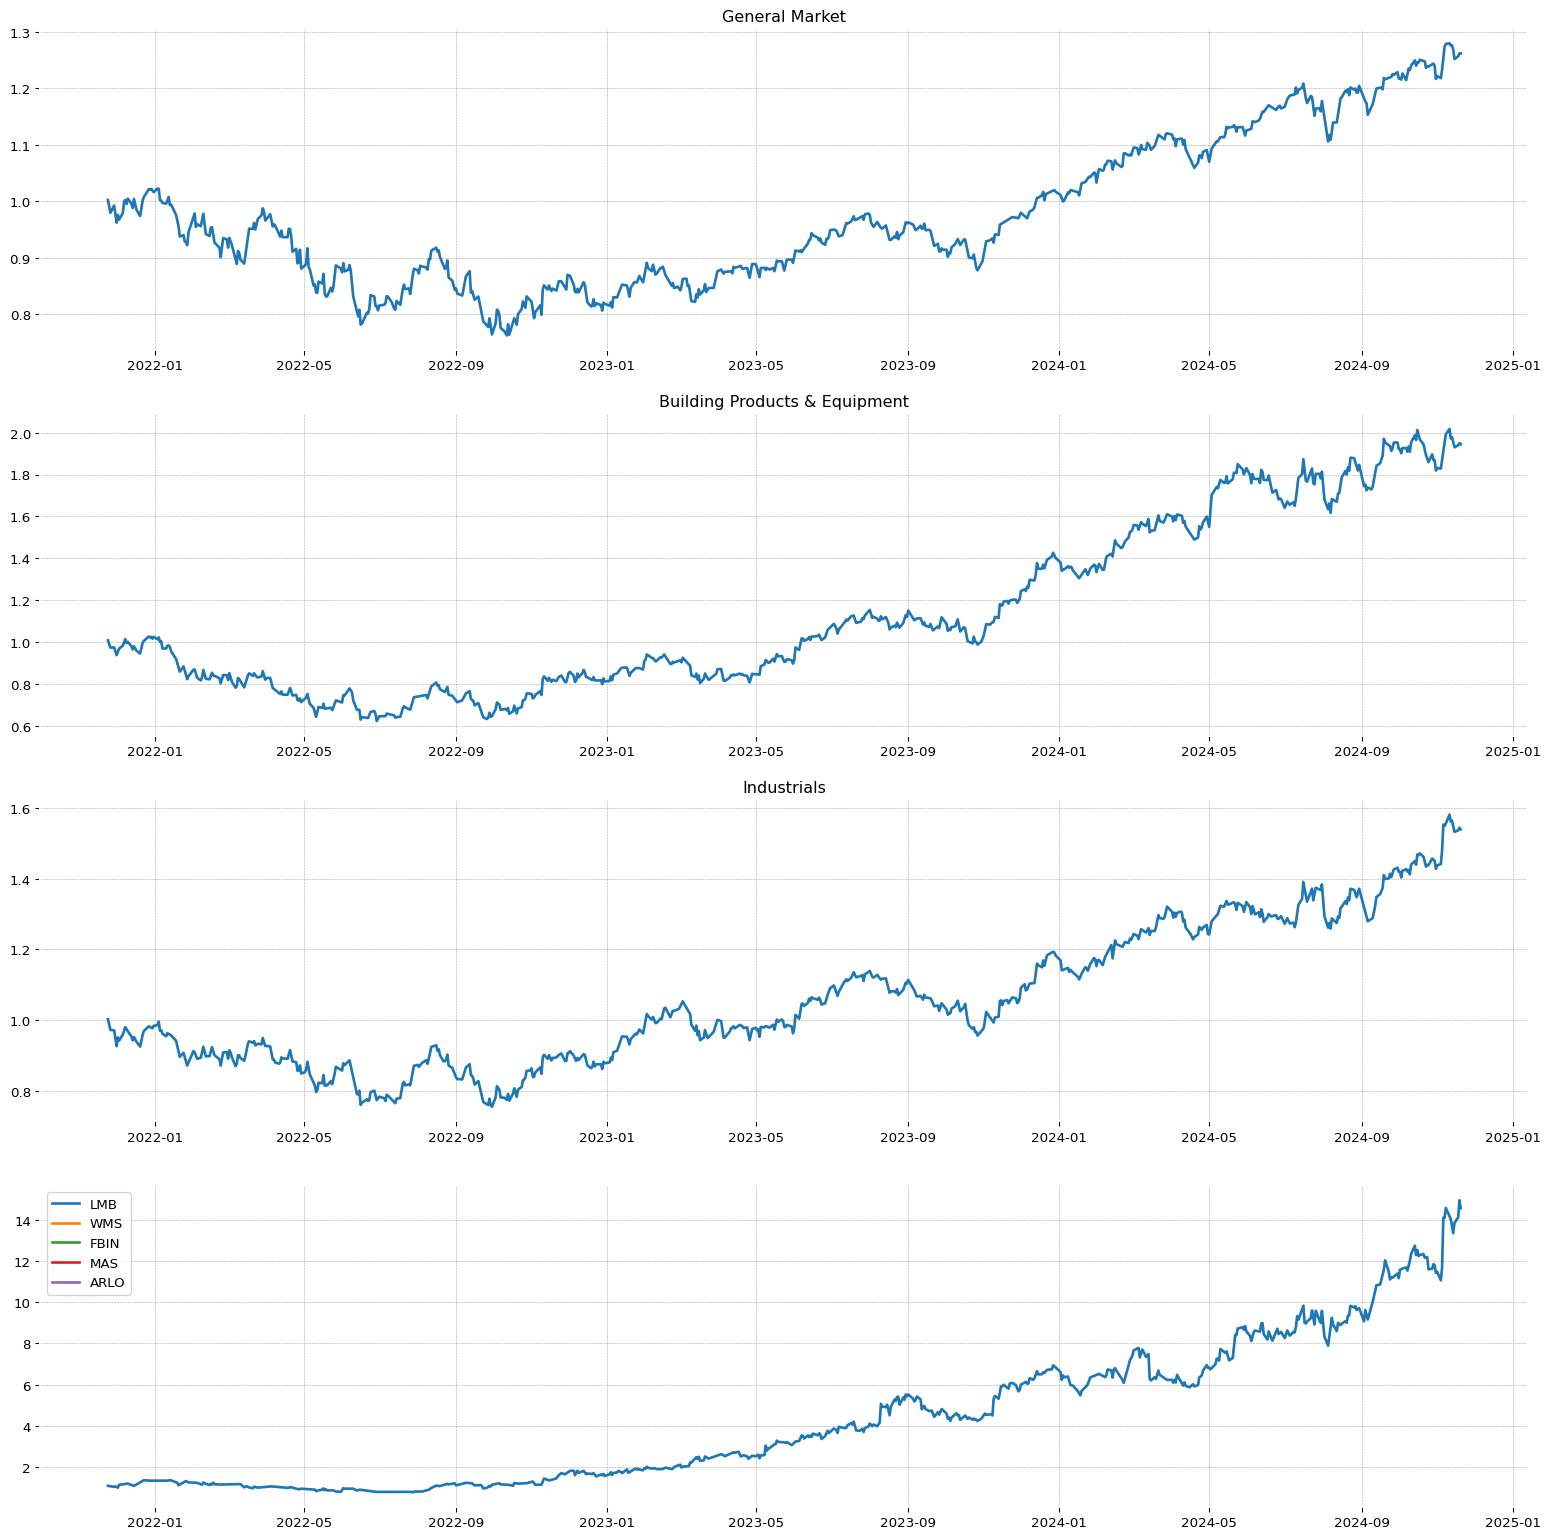 ZIM
ZIM| SMR | EPS | RS | 0.0 | 0.0 | 98 |
| Sector | Sector Position |
| Industrials | 4/11 |
| Industry | Industry Position - | Stock on industry - | RSI Sector: |
| Marine Shipping | 136/147 | 1/17 | 89/412 |
 PNRG
PNRG| SMR | EPS | RS | 0.0 | 0.0 | 90 |
| Sector | Sector Position |
| Energy | 8/11 |
| Industry | Industry Position - | Stock on industry - | RSI Sector: |
| Oil & Gas E&P | 92/147 | 1/57 | 7/192 |
